
Movement below 1,331.31 has invalidated the main hourly wave count and confirmed the alternate hourly wave count. A clear channel breach reinforces the alternate wave count.
I have a new alternate hourly wave count for you today. It would be invalidated with movement below 1,322.41. If it is invalidated then I would have more confidence in a trend change.
Summary: Overall I expect downwards movement from here for about 40 days. It may be very choppy and overlapping, or it may be a steep zigzag down. For the short term price should continue lower. At this stage the trend change is not confirmed with a channel breach and so we must accept that the alternate is possible and we may see new highs. A clear channel breach of the green channel would provide confidence in a trend change.
This analysis is published about 03:15 p.m. EST. Click on charts to enlarge.
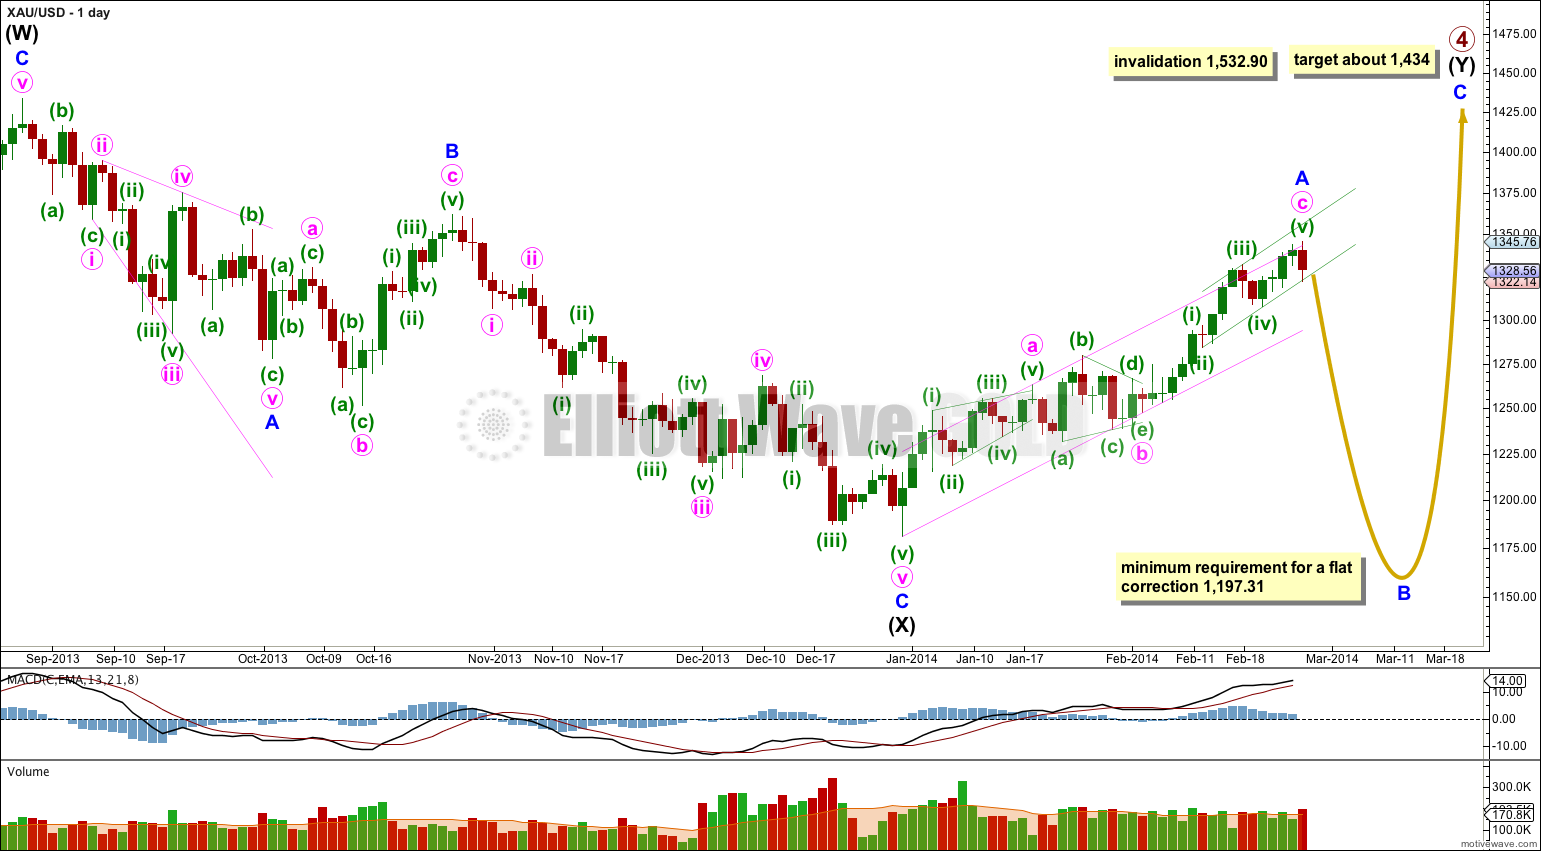
Gold is still within a large fourth wave correction at primary wave degree which is incomplete.
Primary wave 2 was a rare running flat. Primary wave 4 is unlikely to be a flat correction because it is likely to show structural alternation with primary wave 2.
The first upwards wave within primary wave 4 labeled here intermediate wave (W) subdivides as a three wave zigzag. Primary wave 4 cannot be an unfolding zigzag because the first wave within a zigzag, wave A, must subdivide as a five.
Primary wave 4 is unlikely to be completing as a double zigzag because intermediate wave (X) is a deep 99% correction of intermediate wave (W). Double zigzags commonly have shallow X waves because their purpose it to deepen a correction when the first zigzag does not move price deep enough.
Primary wave 4 is most likely to be completing as a double combination: zigzag – X – second structure. The second structure labeled intermediate wave (Y) may be either a flat or a triangle. For both these structures minor wave A must be a three, and is most likely to be a zigzag.
Minor wave A may now again be a complete zigzag. When the channel drawn about it is clearly breached by a full daily candlestick below and not touching the lower trend line then we will have trend channel confirmation of this trend change. While price remains within the channel we must accept the possibility that my analysis is wrong and we could see new highs.
There are more than thirteen possible corrective structures that minor wave B may take. Some of those possibilities, such as expanded flats or running triangles, may see an upwards correction within minor wave B which makes a new high above 1,345.52. Minor wave B may be a steep sharp zigzag downwards, or it may be a very choppy overlapping movement. When the first wave for minute wave a within it is complete then I can narrow down the possibilities for you.
Primary wave 4 may not move into primary wave 1 price territory. This wave count is invalidated with movement above 1,532.90.
Main Hourly Wave Count.
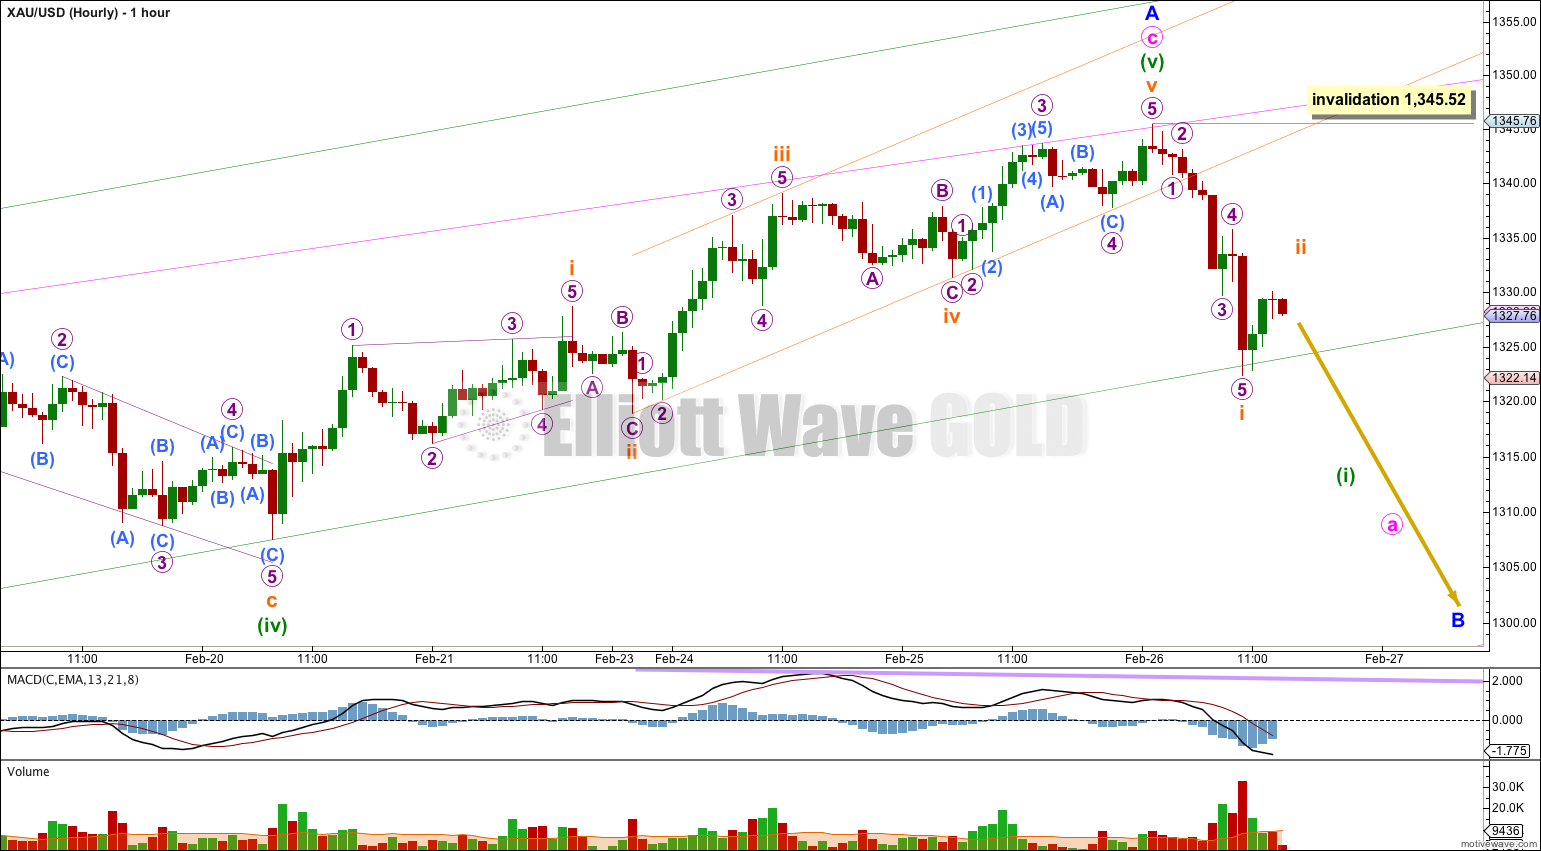
Downwards movement has very clearly breached the channel about minuette wave (v). This provides first indication that minor wave A may be over. Upwards movement to finish minor wave A found resistance and ended at the upper edge of the pink channel copied over here from the daily chart.
Ratios within minute wave c are: minuette wave (iii) is just 1.62 longer than equality with minuette wave (i), and minuette wave (v) has no Fibonacci ratio to either of minuette waves (i) or (iii).
Ratios within minuette wave (iii) are: subminuette wave iii has no Fibonacci ratio to subminuette wave i, and subminuette wave v is just 0.10 longer than 0.236 the length of subminuette wave iii.
Overall the Fibonacci ratios are slightly better for this main wave count in comparison to the alternate below.
I have drawn the green channel about minute wave c using Elliott’s second technique. Draw the first trend line from the lows of minuette waves (ii) to (iv) then place a parallel copy higher up on the high of minuette wave (iii). The lower trend line is showing where price is currently finding support.
The first downwards movement within minor wave B should be a five wave structure.
Depending upon risk appetite these are the things I would want to see (in sequence) to provide confidence in a trend change at 1,345.52:
1. Movement below 1,322.41 providing invalidation of the alternate hourly wave count below.
2. A clear breach of the green trend channel about minute wave c. It is at this stage that I would have confidence in a trend change and I would have only wave counts which expect minor wave B has begun.
3. A clear five wave structure downwards on the hourly chart.
4. A clear breach of the pink channel about minor wave A.
Within minor wave B minute wave a may subdivide as either a three wave corrective structure or a five wave motive structure, but the only structure it cannot take is a triangle. That still leaves multiple possibilities. I will have to manage these possibilities with alternate wave counts in coming days. For now I expect to see a 5-3-5 downwards unfold.
Within the first five down subminuette wave ii may not move beyond the start of subminuette wave i. This wave count is invalidated with movement above 1,345.52.
Alternate Hourly Wave Count.
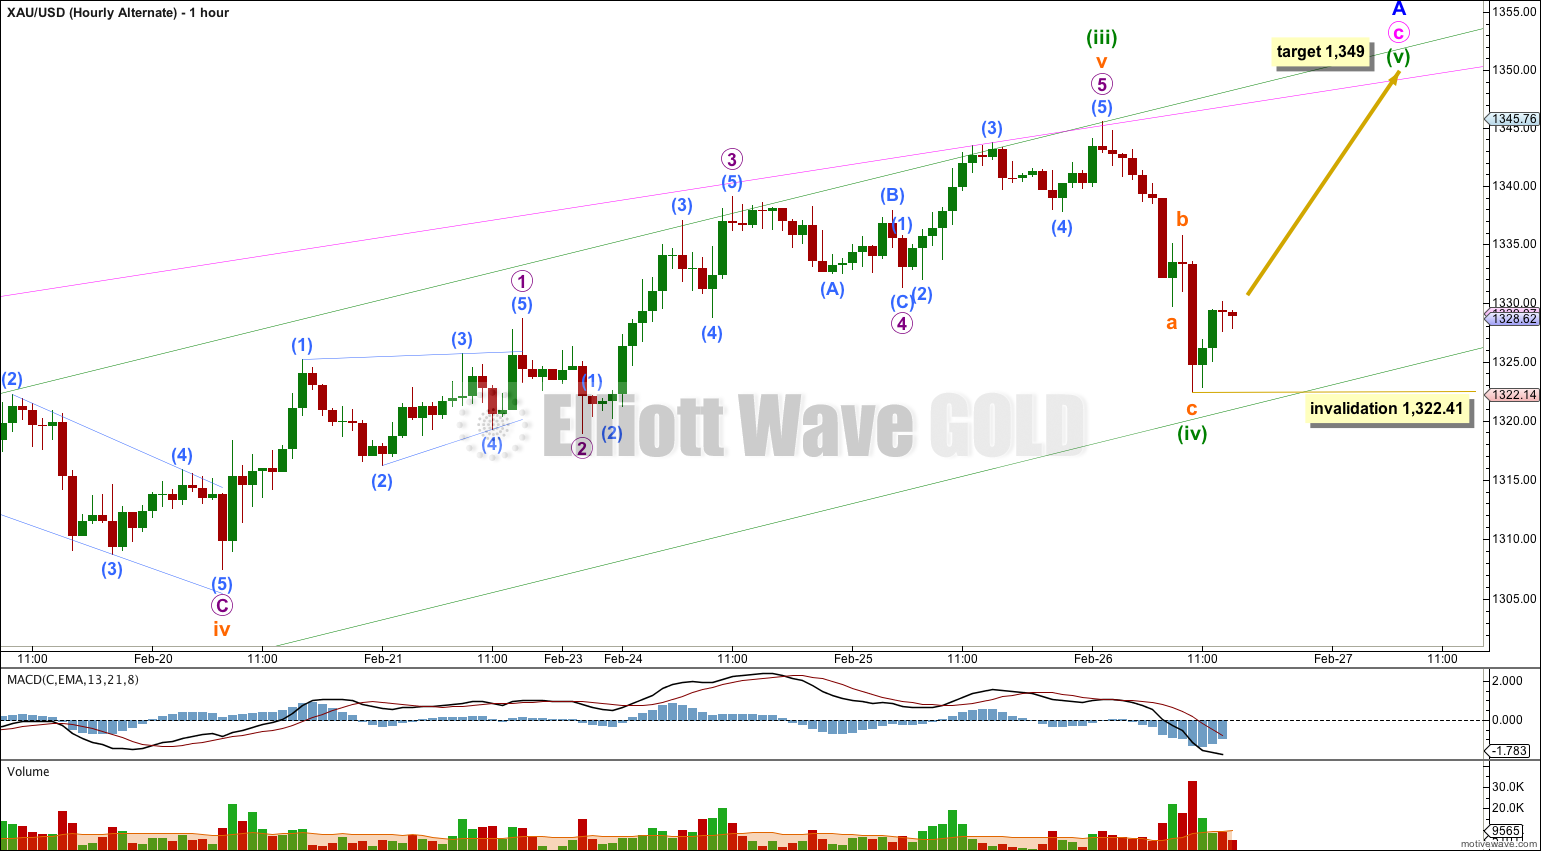
This wave count sees minuette wave (i) over earlier at 1,274.53. Minuette wave (iii) may have just ended with no Fibonacci ratio to minuette wave (i).
Ratios within minuette wave (iii) are: subminuette wave iii is 4.14 short of 4.236 the length of subminuette wave i, and subminuette wave v has no Fibonacci ratio to either of subminuette waves i or iii.
At 1,349 minuette wave (v) would reach equality in length with minuette wave (i). This target would see upwards movement find resistance again and end at the upper edge of the pink channel.
I judge this alternate to have a low probability. But it is possible. While price remains within the green channel drawn about minute wave c we must accept the possibility that minute wave c is not over and we may see new highs. I want to see that green channel clearly breached to have confidence in a trend change.
Alternate Daily Wave Count – Triangle.
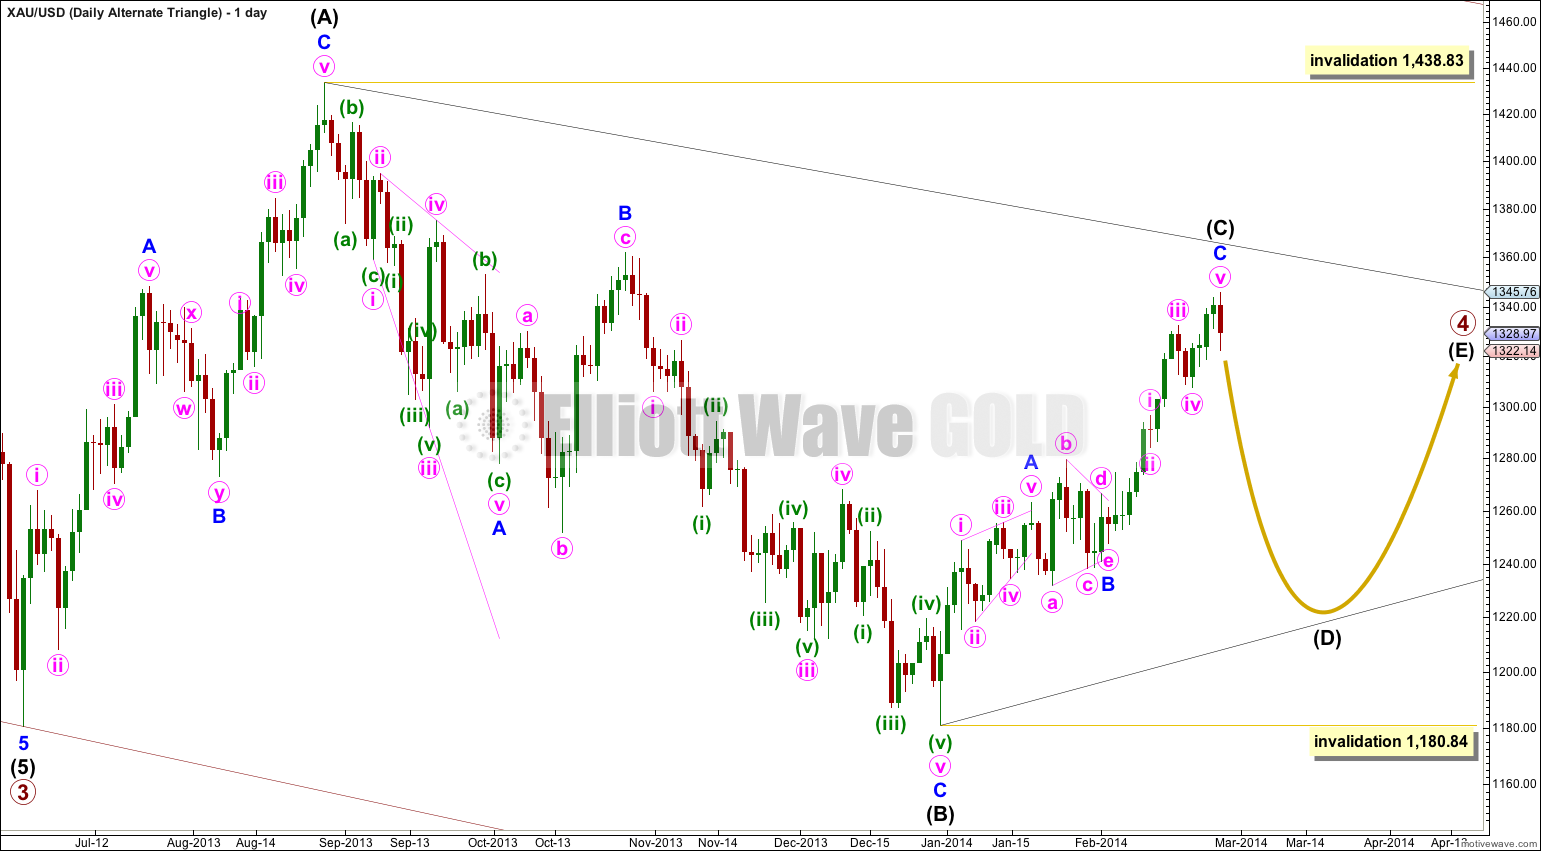
It is also possible that primary wave 4 may continue as a regular contracting (or barrier) triangle.
This wave count has a good probability. It does not diverge from the main wave count and it will not diverge for several weeks yet.
Triangles take up time and move price sideways. If primary wave 4 unfolds as a triangle then I would expect it to last months rather than weeks.
Brilliant Richard.
As with all technical analysis methods sometimes the situation is unclear. At the moment I have to sit on the fence with Gold.
Hopefully you can come our of the Saloon shortly when the Golden beast is on a clear track.
But a word of caution; the next movement is a B wave. They are the most variable and so the most difficult of all of the waves to analyse.
Danger ahead Will Robinson!
Yes, Will Robinson was ‘Lost in Space’.
We don’t want to be ‘Lossed in Gold”
I definitely got my money off the table with this untamed Golden beast now, maybe she got a spur in her hoofs or a rattler spooked her or she drank some fire water. I sold my Gold and silver miners Feb 19th for profits. Taking some time off and waiting for Gold and Silver to run wild and tire themselves out and let Chart Wizard and tour guide Lara have a chance to take down the hazard signs and issue some fresh maps before trying to ride this for money again. Maybe go to the Saloon and celebrate. P.S. Thanks for the warning Lara, it was a thrill a minute this week. Thankfully got out of DUST with a profit. Won’t do that again.