
The short term target at 1,364 was met and passed. Upwards movement was expected.
Summary: The trend is up. The target for it to end remains the same, at 1,390. This target may be met in three days.
This analysis is published about 03:30 p.m. EST. Click on charts to enlarge.
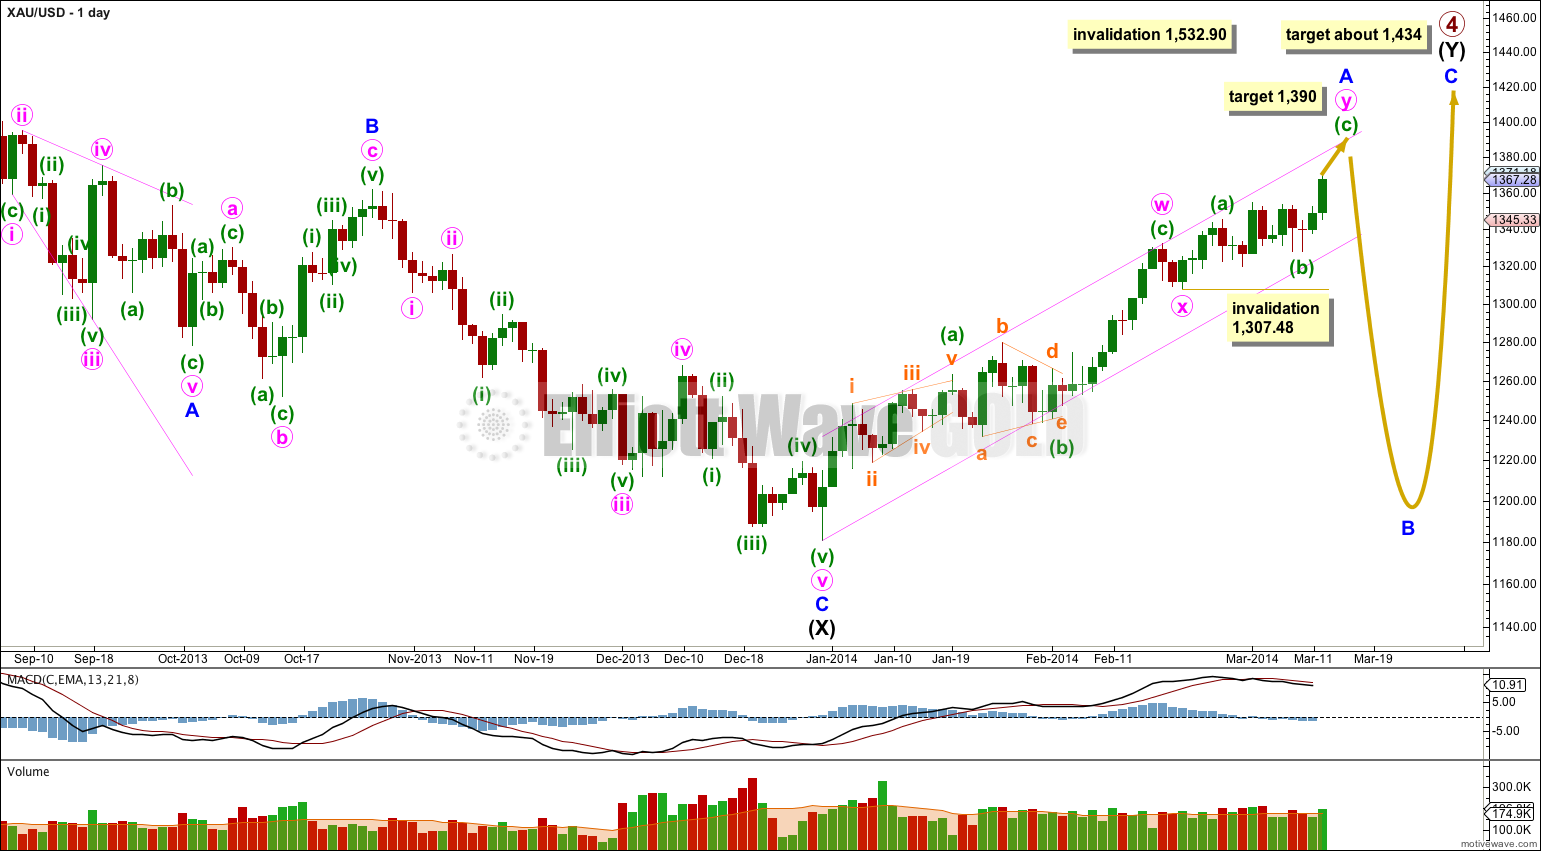
Gold is still within a large fourth wave correction at primary wave degree which is incomplete.
Primary wave 2 was a rare running flat. Primary wave 4 is unlikely to be a flat correction because it is likely to show structural alternation with primary wave 2.
The first upwards wave within primary wave 4 labeled intermediate wave (W) subdivides as a three wave zigzag. Primary wave 4 cannot be an unfolding zigzag because the first wave within a zigzag, wave A, must subdivide as a five.
Primary wave 4 is unlikely to be completing as a double zigzag because intermediate wave (X) is a deep 99% correction of intermediate wave (W). Double zigzags commonly have shallow X waves because their purpose it to deepen a correction when the first zigzag does not move price deep enough.
Primary wave 4 is most likely to be completing as a double combination: zigzag – X – second structure. The second structure labeled intermediate wave (Y) may be either a flat or a triangle. For both these structures minor wave A must be a three.
Minor wave A is an incomplete double zigzag. The second zigzag in the double is incomplete. There is a morning doji star candlestick pattern at the bottom of minuette wave (b) within minute wave y. A morning star pattern is one of the more reliable candlestick patterns. This provides some confirmation for the upwards trend.
Primary wave 4 may not move into primary wave 1 price territory. This wave count is invalidated with movement above 1,532.90.
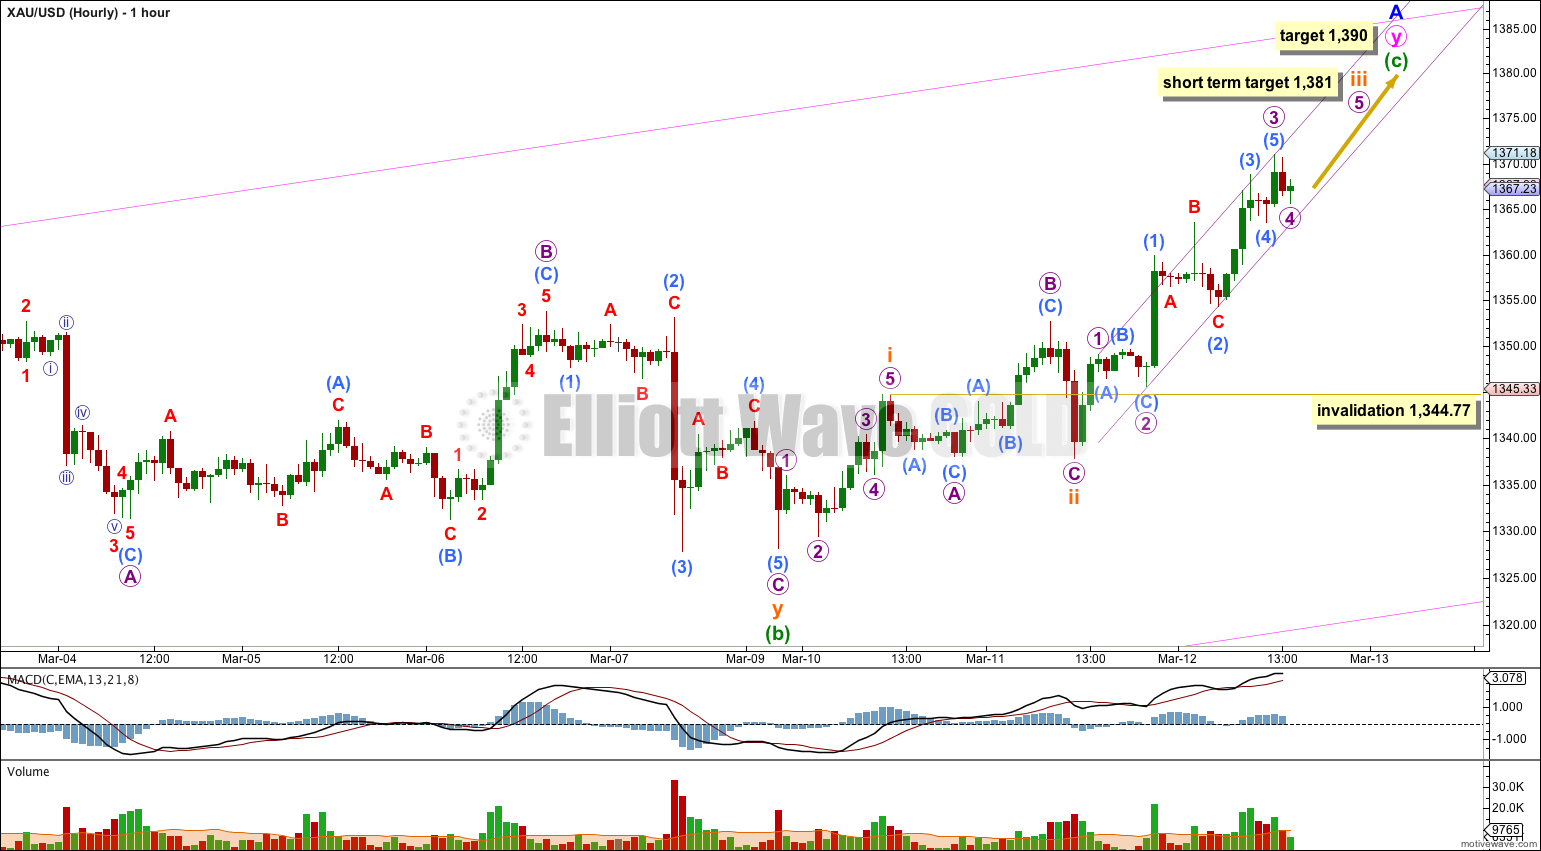
I have adjusted the labeling within minuette wave (c). It looks like the third wave within it is close to completion, as a clear increase in upwards momentum indicates.
I have drawn a channel about the middle of minuette wave (c). I would expect upwards movement to find some resistance at the upper edge, or overshoot the upper edge. Downwards corrections along the way may find support at the lower edge of this channel.
When subminuette wave iii is complete the channel must be redrawn to show where subminuette wave iv may find support. Draw the channel using Elliott’s first technique: the first trend line from the highs of subminuette waves i to iii, then place a parallel copy upon the low of subminuette wave ii.
At 1,381 subminuette wave iii would reach 2.618 the length of subminuette wave i. Subminuette wave iv should be a brief correction, over within 24 hours, as it should not show on the daily chart as a red candlestick. It may show as a green doji. It is a correction against the main trend, which is upwards.
Subminuette wave iv may not move into subminuette wave i price territory. This wave count is invalidated with movement below 1,344.77.
Alternate Daily Wave Count – Triangle.
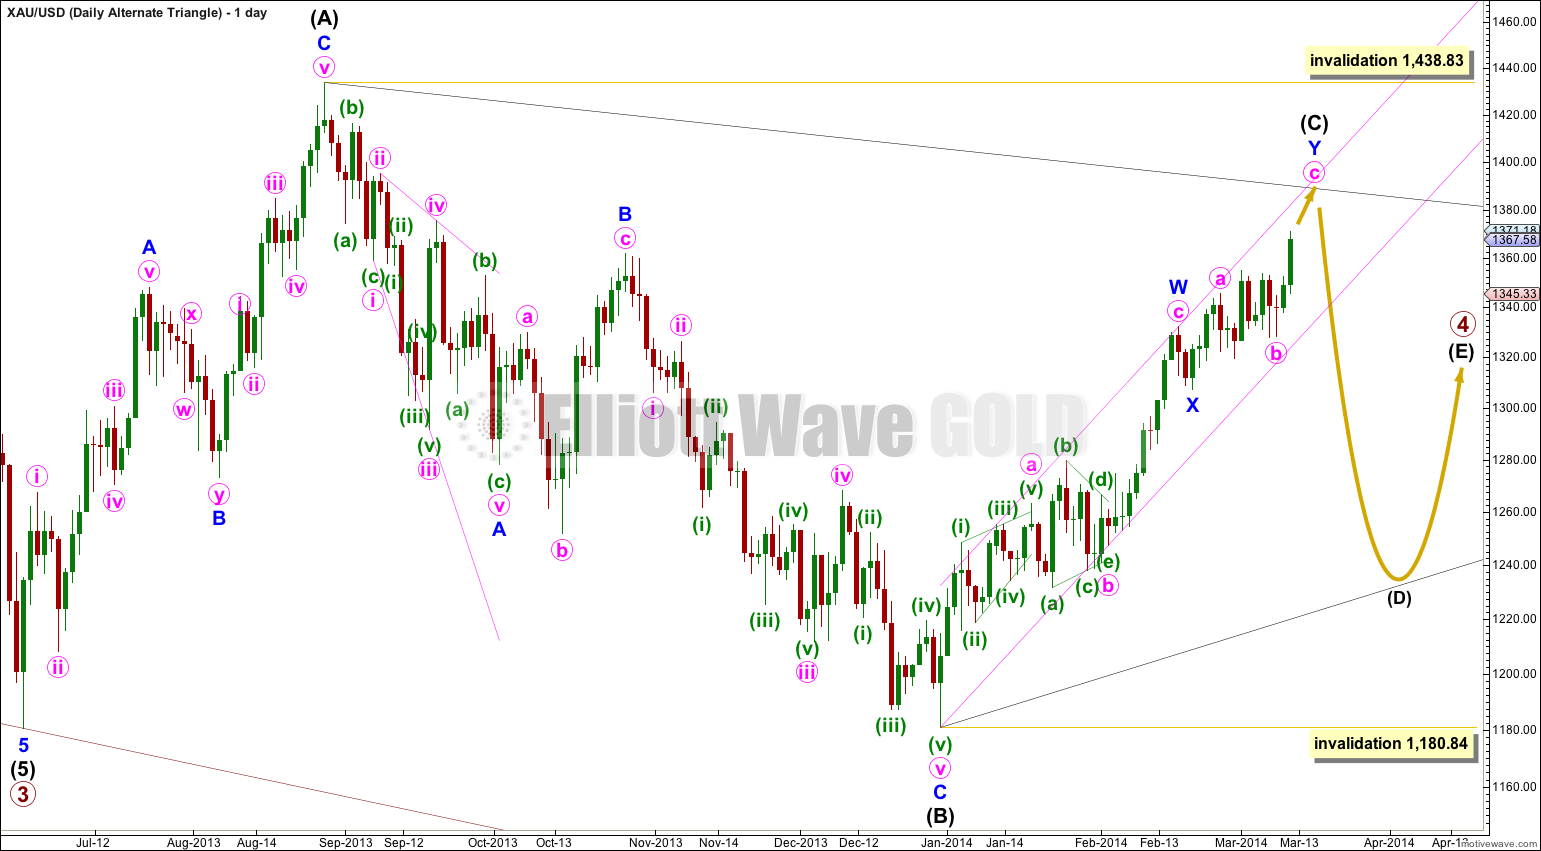
It is also possible that primary wave 4 may continue as a regular contracting (or barrier) triangle.
This wave count has a good probability. It does not diverge from the main wave count and it will not diverge for several weeks yet.
Triangles take up time and move price sideways. If primary wave 4 unfolds as a triangle then I would expect it to last months rather than weeks.
I don’t think Silver will make it actually.
At this stage I have confidence that Gold will not move above 1,434. Look at the Gold Historical analysis and look at the weekly chart there. The structure is very typical.
or their behaviour
Dear Lara,
is there any wavecount for gold, that is showing a target for gold at around 14**-1450? I´m not sure, if silver can run up to 25 in a few weeks without gold following in the same direction. The last weeks gold was showing more strenght.
Kind regards