
Monday began with a little more upwards movement before price turned lower to complete a red candlestick.
Summary: Upwards movement may be over for now. I have a little confidence in a trend change today due to the clear red candlestick on the daily chart. However, this trend change is unconfirmed. We need to see a clear breach of the pink channel on the daily chart before we may have confidence in this trend change.
This analysis is published about 02:50 p.m. EST. Click on charts to enlarge.
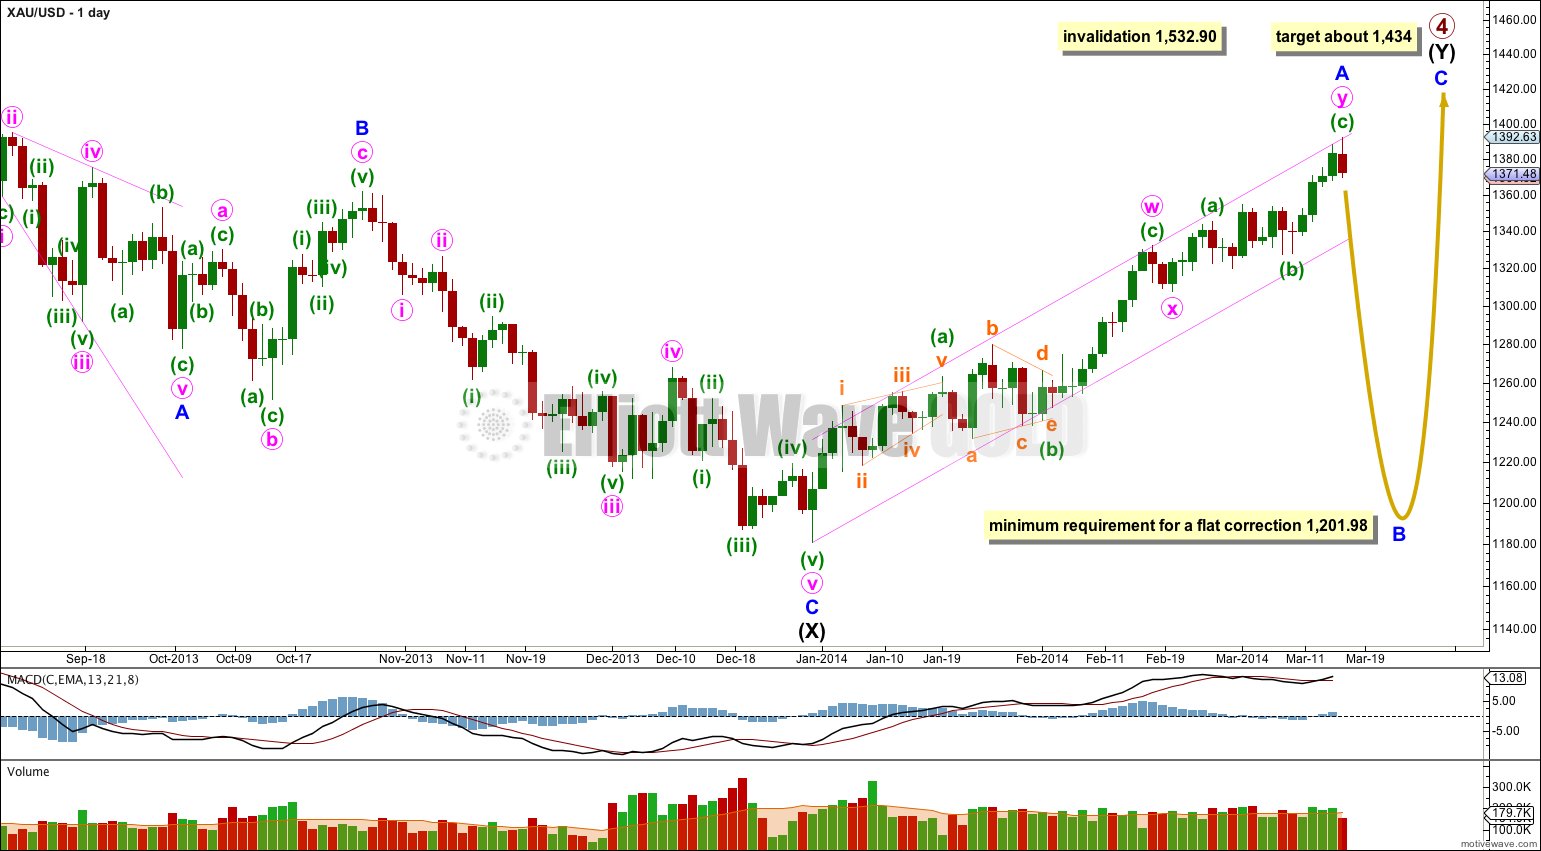
Gold is still within a large fourth wave correction at primary wave degree which is incomplete.
Primary wave 2 was a rare running flat. Primary wave 4 is unlikely to be a flat correction because it is likely to show structural alternation with primary wave 2.
The first upwards wave within primary wave 4 labeled intermediate wave (W) subdivides as a three wave zigzag. Primary wave 4 cannot be an unfolding zigzag because the first wave within a zigzag, wave A, must subdivide as a five.
Primary wave 4 is unlikely to be completing as a double zigzag because intermediate wave (X) is a deep 99% correction of intermediate wave (W). Double zigzags commonly have shallow X waves because their purpose it to deepen a correction when the first zigzag does not move price deep enough.
Primary wave 4 is most likely to be completing as a double combination: zigzag – X – second structure. The second structure labeled intermediate wave (Y) may be either a flat or a triangle. For both these structures minor wave A must be a three.
Minor wave A may again be a complete structure now that it unfolds nicely as a double zigzag. It may have ended at the upper edge of its channel. We need to see this channel breached with a full daily candlestick below the lower pink trend line and not touching it before we may have confidence in a trend change at minor degree.
Primary wave 4 may not move into primary wave 1 price territory. This wave count is invalidated with movement above 1,532.90.
Main Hourly Wave Count.
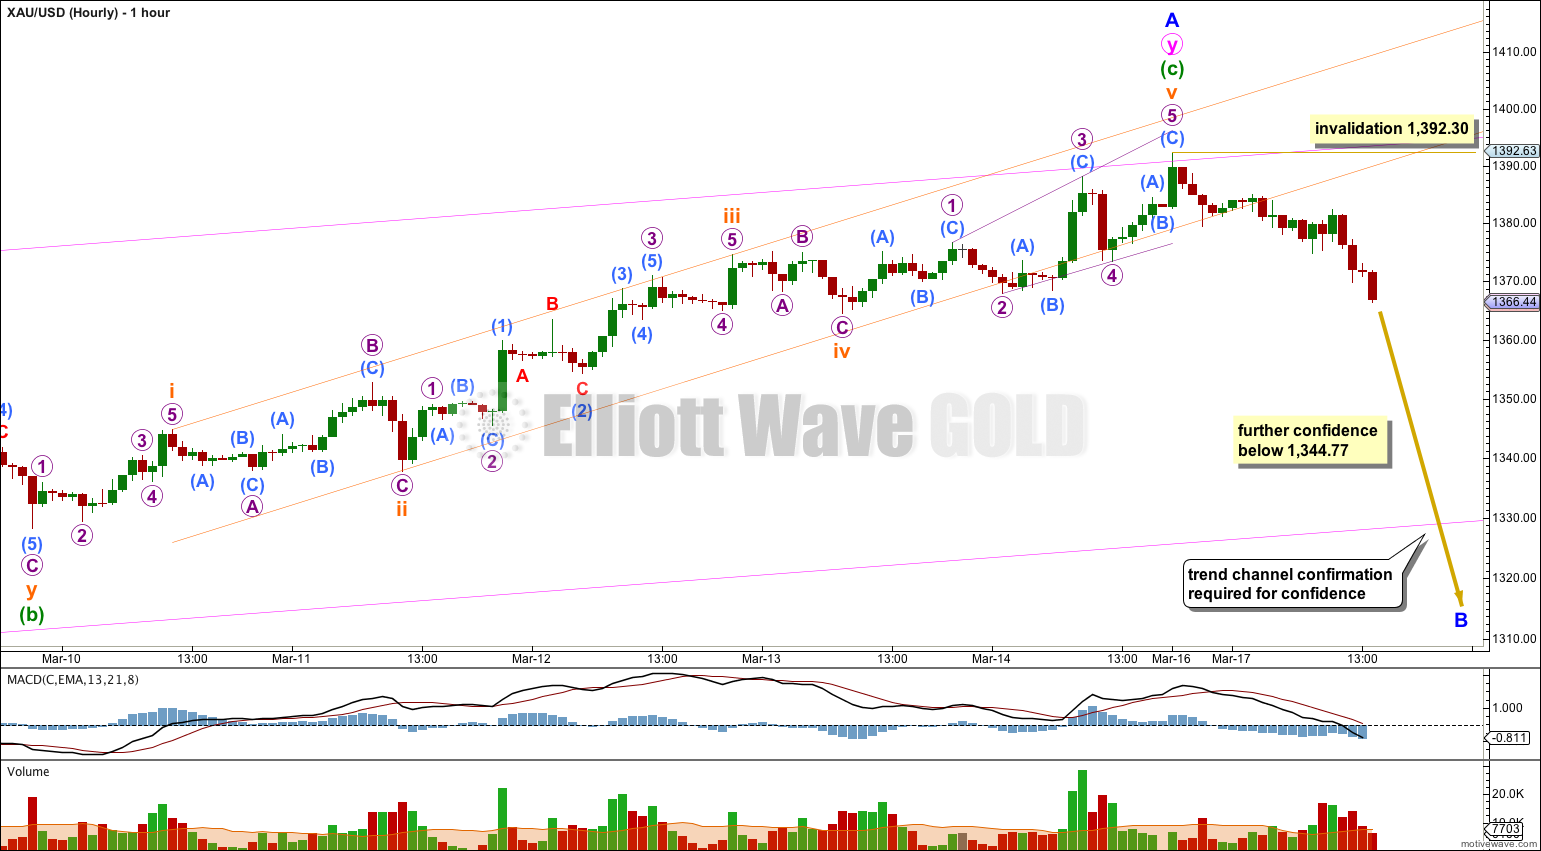
Minor wave A may be considered complete. I have adjusted the wave count back to seeing subminuette wave iv as a flat correction, and now subminuette wave v fits as an ending expanding diagonal (albeit with a third wave which is slightly the longest).
Within the second zigzag of minor wave A minuette wave (c) is now 2.57 longer than 1.618 the length of minuette wave (a).
Ratios within minuette wave (c) are: subminuette wave iii has no Fibonacci ratio to submineutte wave i, and subminuette wave v is now just 0.86 longer than 1.618 the length of subminuette wave i. The slight upwards movement which began the new week has improved the Fibonacci ratios within minuette wave (c).
The following three things will provide confidence in a trend change at minor degree:
1. We now have a very clear breach of the small orange parallel channel which contains minuette wave (c) upwards. This is initial indication we may have had a trend change.
2. Next I want to see movement below 1,344.77 to invalidate the alternate wave count below. This would provide more confidence.
3. Final confirmation with a clear channel breach on the daily chart of the wider pink channel containing minor wave A. Only when this channel is breached will I have full confidence in this trend change.
The clear red candlestick on the daily chart is significant. This provides me with some level of confidence in a trend change today. However, depending upon risk appetite final confidence will only come with a breach of the pink channel.
The new downwards trend should last several weeks to a couple of months or so.
Within the new downwards trend no second wave correction may move beyond the start of its first wave. This wave count is invalidated with movement above 1,392.30.
Alternate Hourly Wave Count.
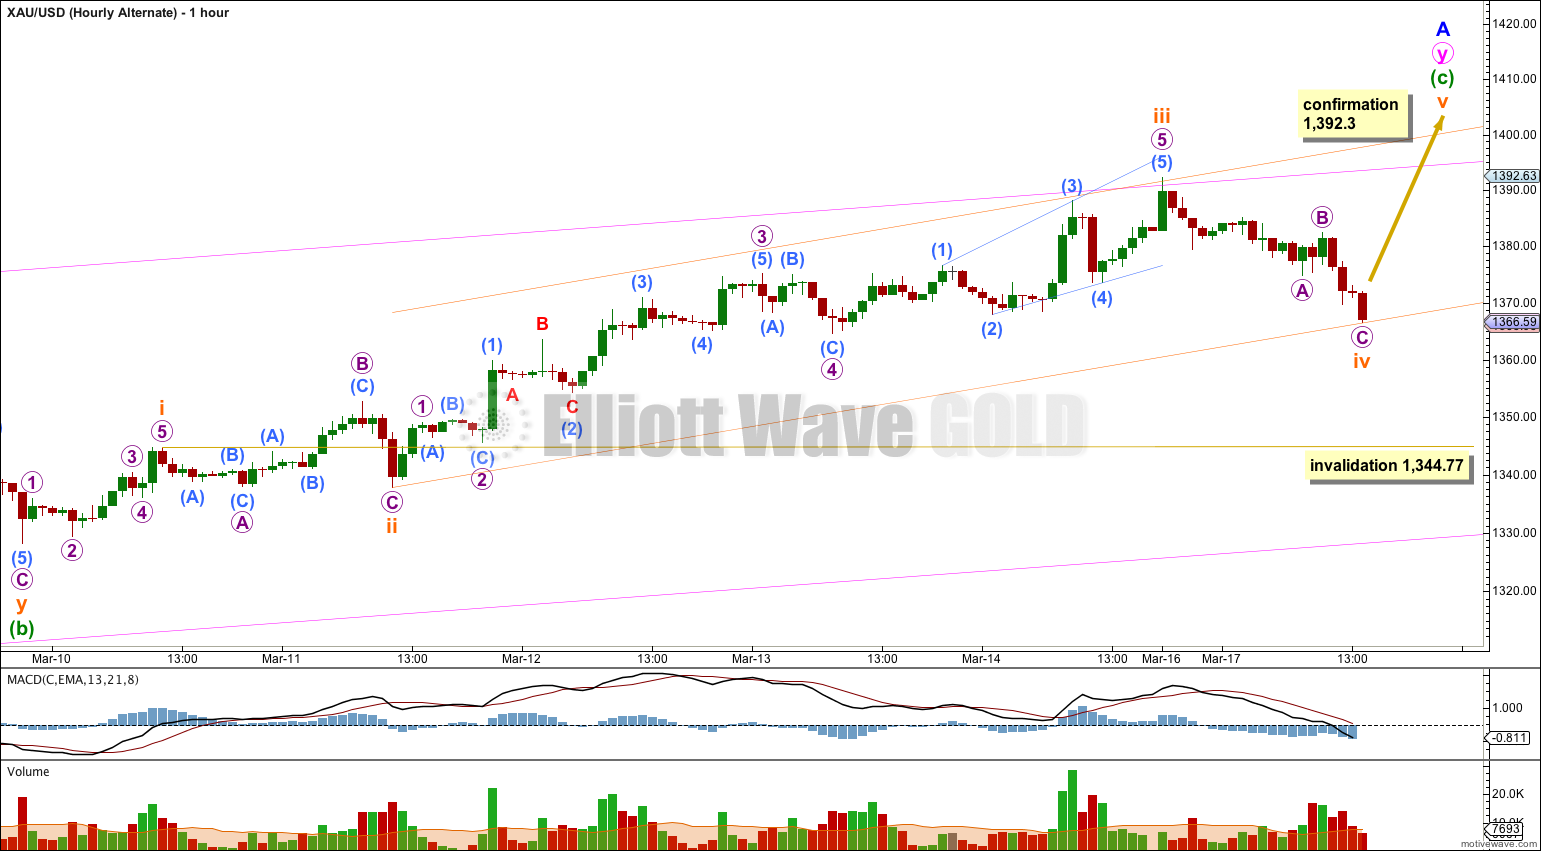
There is more than one way to see upwards movement, although the main wave count has the best fit. This alternate is possible, however, the middle of the third wave does not subdivide as neatly because it looks like a three wave movement when it should be a five.
If downwards movement is subminuette wave iv within minuette wave (c) then it is showing up on the daily chart while subminuette wave ii did not. This would be unusual for Gold and it reduces the probability of this wave count.
Subminuette wave iii has no Fibonacci ratio to submineutte wave i. Because subminuette wave iv may be incomplete I cannot calculate a target for subminuette wave v for you.
Subminuette wave iv may not move into submineutte wave i price territory. This wave count is invalidated with movement below 1,344.77.
Alternate Daily Wave Count – Triangle.
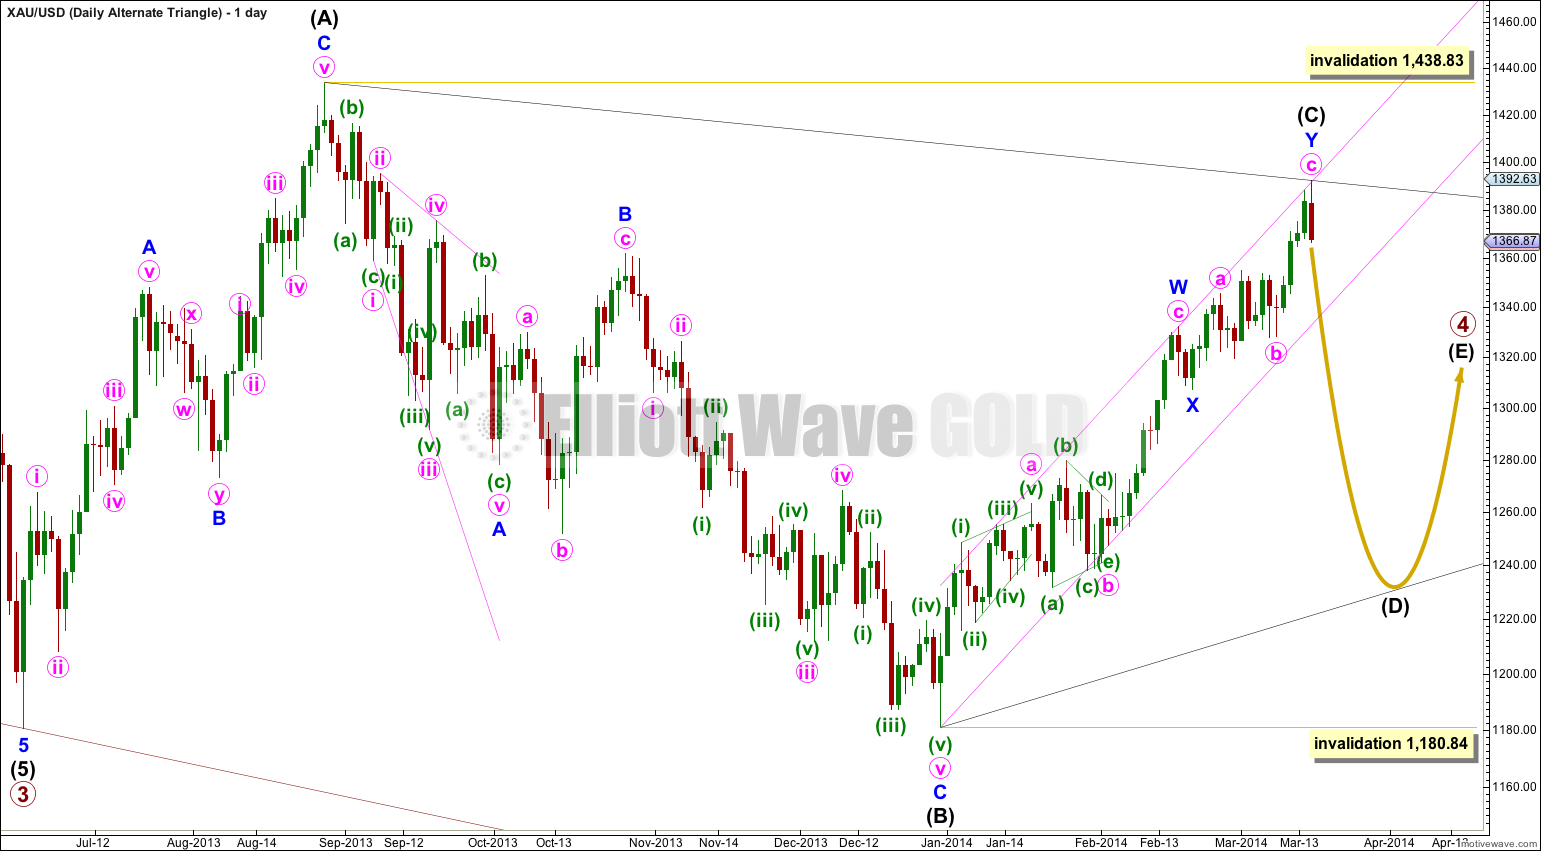
It is also possible that primary wave 4 may continue as a regular contracting (or barrier) triangle.
This wave count has a good probability. It does not diverge from the main wave count and it will not diverge for several weeks yet.
Triangles take up time and move price sideways. If primary wave 4 unfolds as a triangle then I would expect it to last months rather than weeks.
I m new to all this so fail to understand what should I do. Please advise me what trade should I follow? And how to follow all these analysis ?
It always concerns me when new members ask this question. It tells me you are unlikely to be an experienced trader.
Your question is answered in the FAQ. I cannot legally tell you how to trade, I am not a registered investment advisor and so I cannot offer investment advice.
What this website and service does is offer Elliott wave analysis. You can use my analysis to give you an idea of the most likely next direction.
I highly recommend you learn other basic Technical Analysis methods to assist you in your decision making. A good start (and maybe all you need) would be the classic “Technical Analysis of Stock Trends” by Edwards, Magee and Bassetti.
My analysis is best used as just one tool in your decision making toolkit. Members pay me to do EW analysis for them because it is very time consuming and difficult to do right.
This service does not teach you how to trade and it is not a signal service. It is pure analysis only.
Ensuring a positive record of trading in a practice account for at least 6 months before committing real money, and ensuring you develop and test a trading system first, is more likely to lead to profits.
Good luck.