
Last analysis expected continued downwards movement to a short term target at 1,295 to 1,293. This is not what happened; price moved slowly higher. Although the wave count remained valid the green candlestick on the daily chart indicates it was wrong and so it is changed.
We now have a clear breach of the pink channel on the daily chart providing final confirmation of a trend change at minor degree.
Summary: I still have full confidence in a trend change. This upwards movement is a typical pullback following a trend line break. I expect upwards movement is either over or very close to over, and should not break resistance at the pink trend line. I expect downwards movement next week to a target at 1,270.
This analysis is published about 04:10 p.m. EST. Click on charts to enlarge.
Main Wave Count.
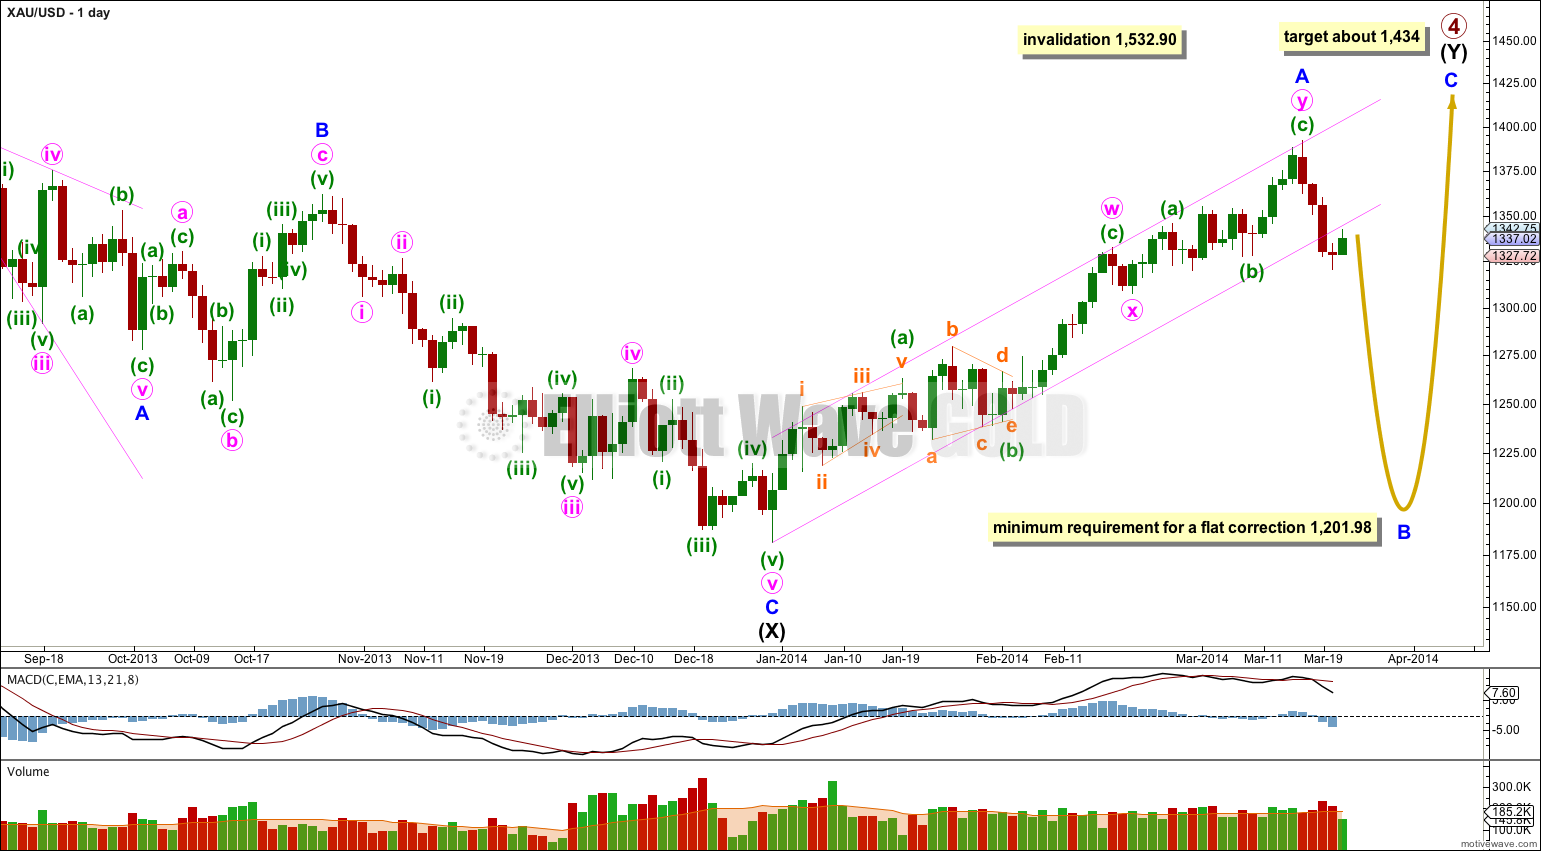
Gold is still within a large fourth wave correction at primary wave degree which is incomplete.
Primary wave 2 was a rare running flat. Primary wave 4 is unlikely to be a flat correction because it is likely to show structural alternation with primary wave 2.
The first upwards wave within primary wave 4 labeled intermediate wave (W) subdivides as a three wave zigzag. Primary wave 4 cannot be an unfolding zigzag because the first wave within a zigzag, wave A, must subdivide as a five.
Primary wave 4 is unlikely to be completing as a double zigzag because intermediate wave (X) is a deep 99% correction of intermediate wave (W). Double zigzags commonly have shallow X waves because their purpose it to deepen a correction when the first zigzag does not move price deep enough.
Primary wave 4 is most likely to be completing as a double combination: zigzag – X – second structure. The second structure labeled intermediate wave (Y) may be either a flat or a triangle. For both these structures minor wave A must be a three.
Primary wave 4 may not move into primary wave 1 price territory. This wave count is invalidated with movement above 1,532.90.
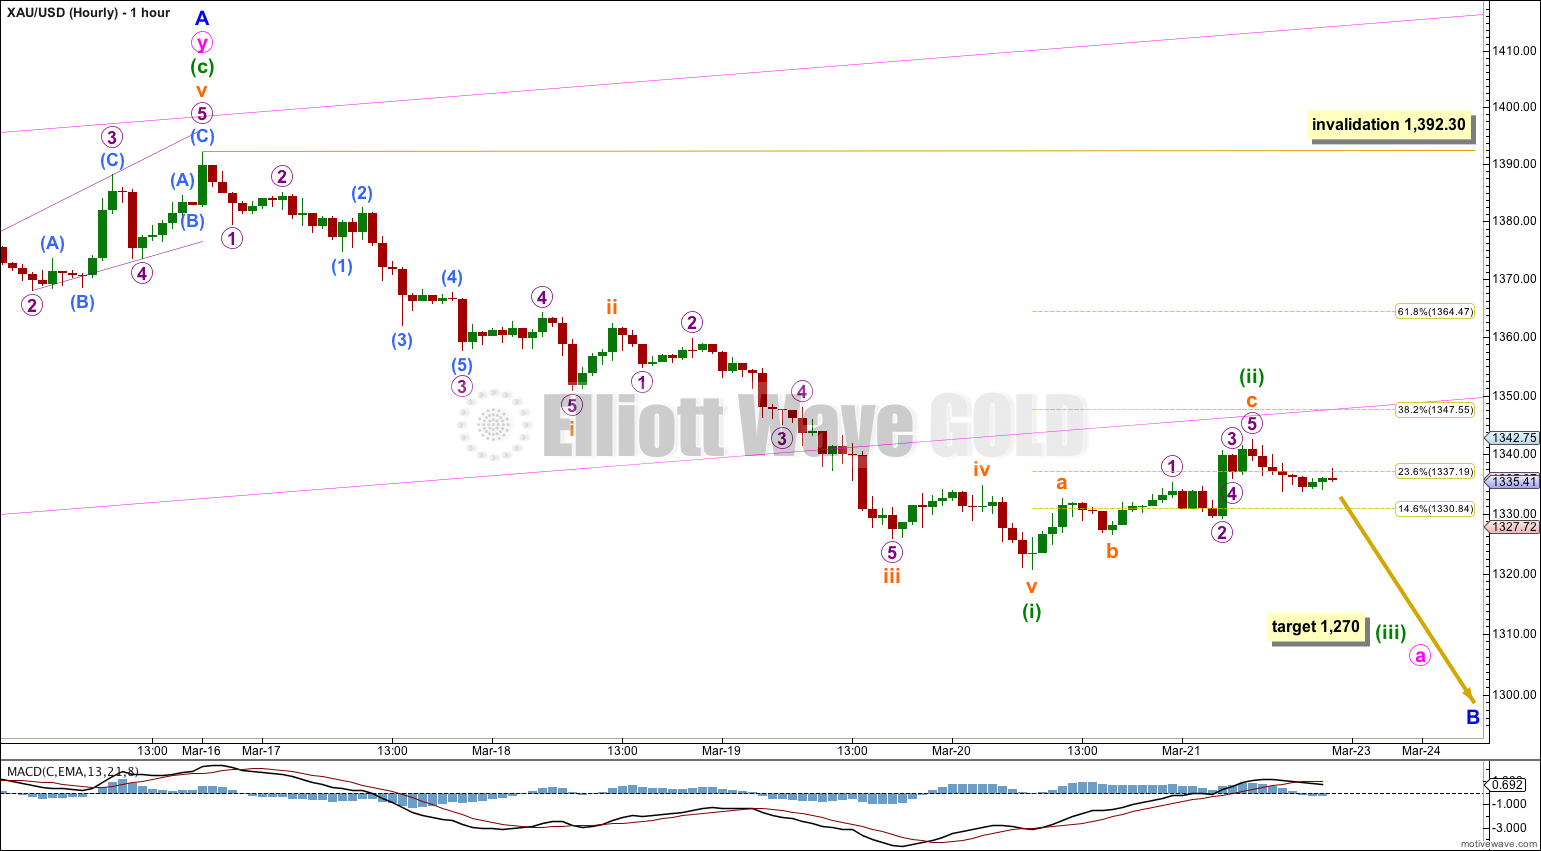
There are more than thirteen possible corrective structures that minor wave B may take. It is most likely to be a zigzag. Within a zigzag minute wave a must subdivide as a five wave motive structure, either a leading diagonal or an impulse. This downwards movement so far is clearly not a diagonal and it may be an impulse.
This main hourly wave count follows the most likely structure of a zigzag for minor wave B.
Within minute wave a impulse minuette wave (i) must be complete. The green candlestick on the daily chart is unlikely to be a correction within minuette wave (i) and it is very likely to be minuette wave (ii).
Ratios within minuette wave (i) are: there is no adequate Fibonacci ratio between subminuette waves iii and i, and subminuette wave v is just 0.21 longer than 0.382 the length of subminuettte wave iii.
Ratios within subminuette wave i are: there is no Fibonacci ratio between micro waves 1 and 3, and micro wave 5 is 0.52 longer than equality with micro wave 1.
Ratios within subminuette wave iii are: there is no adequate Fibonacci ratio between micro waves 3 and 1, and micro wave 5 is 1.62 short of 1.618 the length of micro wave 3.
I would expect minuette wave (ii) to find resistance at the lower edge of the pink channel copied over here from the daily chart. I would expect that this is where it is most likely to end, and so it is most likely to be over.
At 1,270 minuette wave (iii) would reach equality with minuette wave (i). This target may be met next week. Minuette wave (iii) down should show a clear and strong increase in downwards momentum.
Minuette wave (ii) may not move beyond the start of minuette wave (i). This wave count is invalidated with movement above 1,392.30.
Alternate Hourly Wave Count.
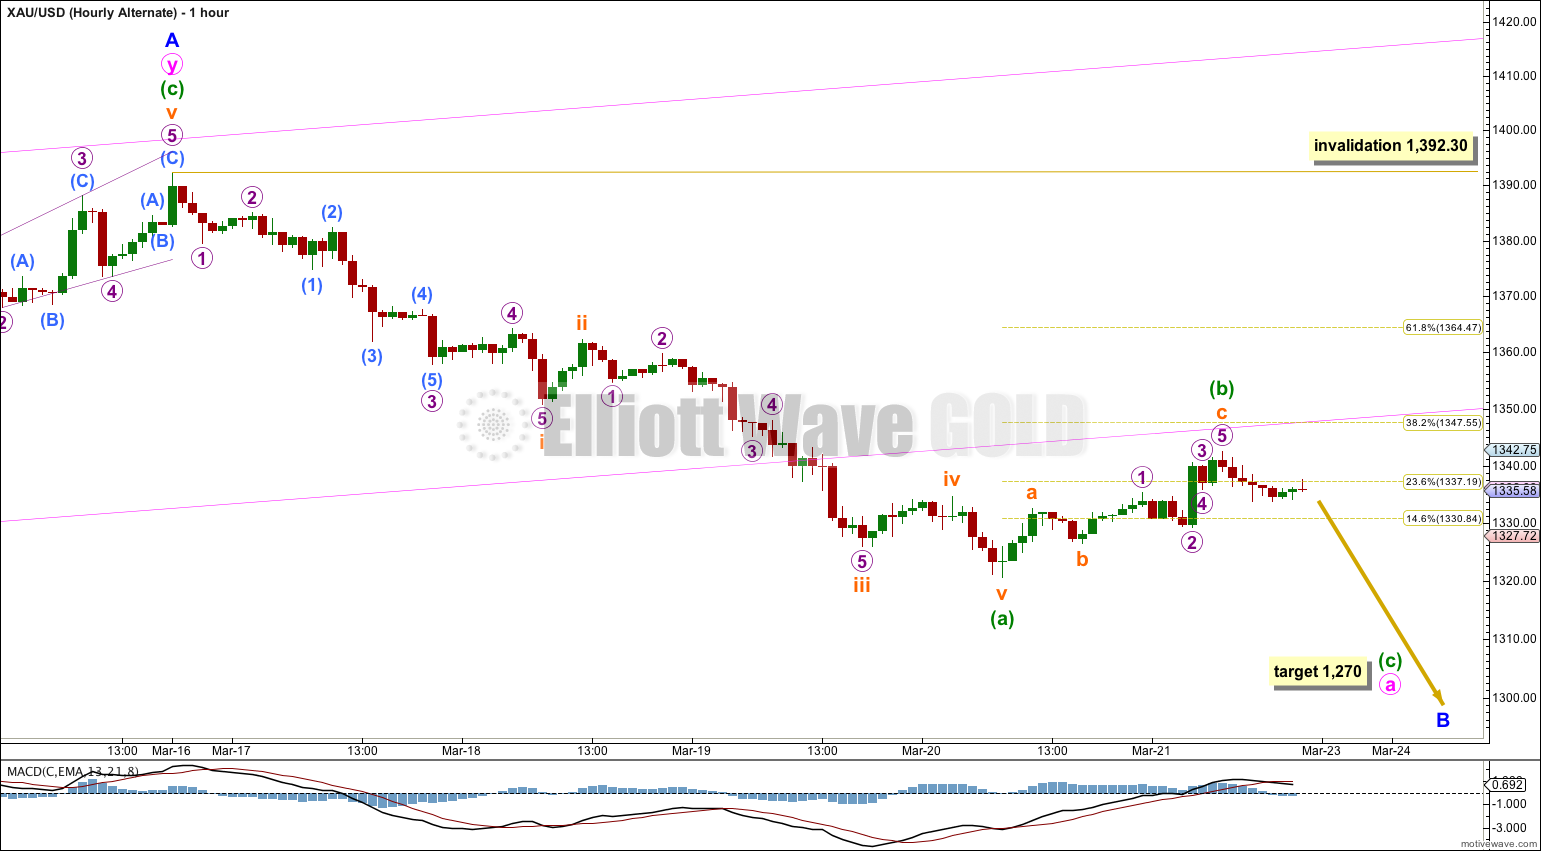
If minor wave B is a flat (or a combination with a flat as the first structure) then minute wave a within it must subdivide as a three. Minute wave a for this alternate is seen as an incomplete zigzag.
A-B-C of a zigzag and 1-2-3 of an unfolding impulse subdivide in exactly the same way. It is impossible to tell the difference, unless downwards momentum of the next wave does not show a clear and strong increase. But C waves often do show stronger momentum than A waves.
This wave count does not diverge from the main wave count and will not diverge for a few days yet.
Because minuette wave (a) subdivides as a five minute wave a may be a zigzag. Within a zigzag minuette wave (b) may not move beyond the start of minuette wave (a). This wave count is invalidated with movement above 1,392.30.
Alternate Daily Wave Count – Triangle.
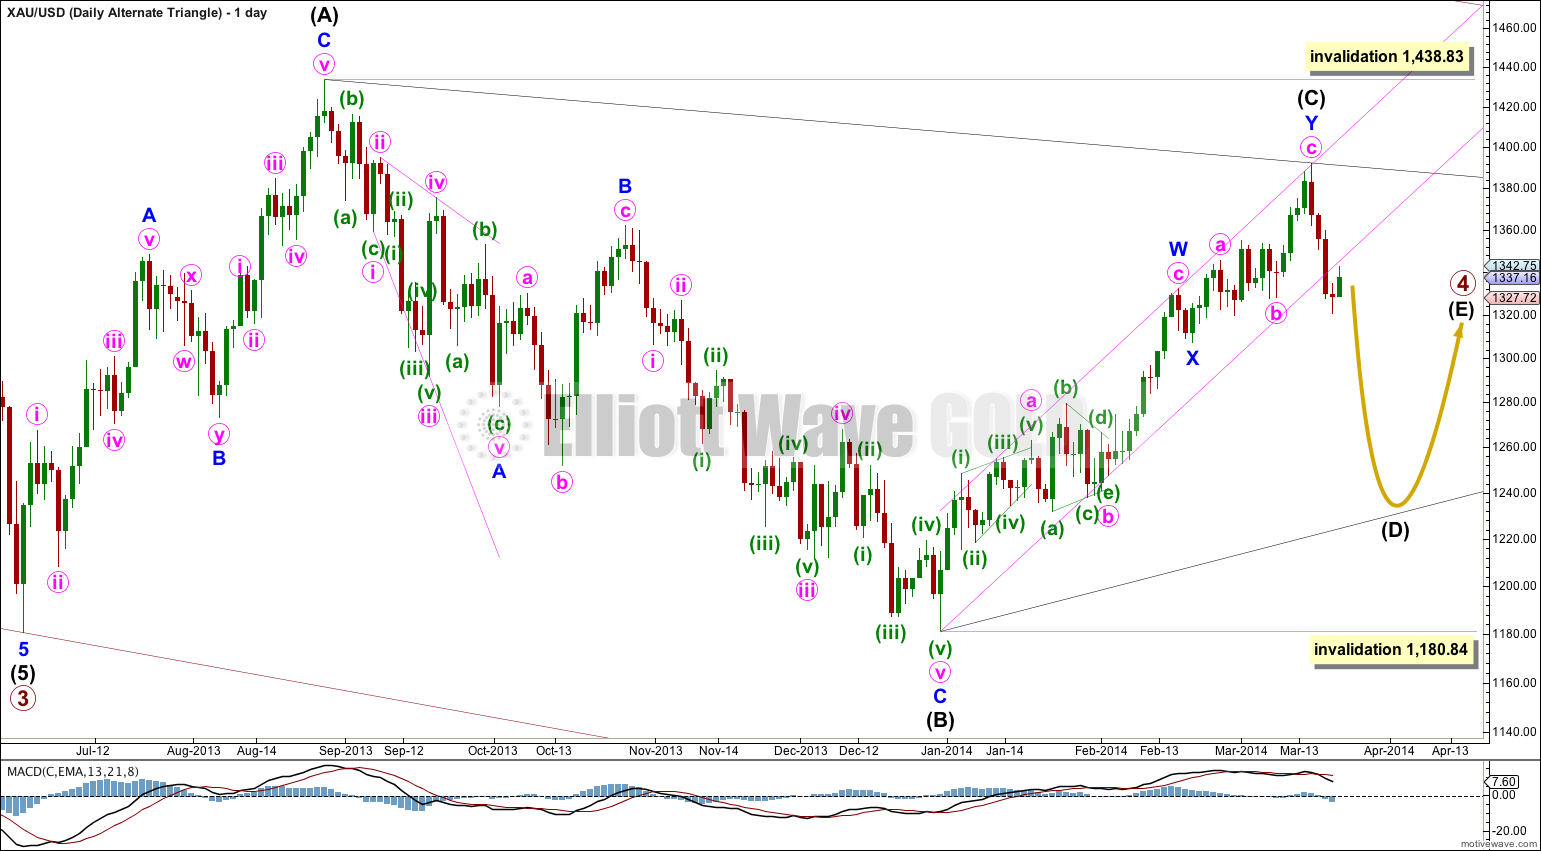
It is also possible that primary wave 4 may continue as a regular contracting (or barrier) triangle. With MACD moving reasonably close to the zero line on the daily chart this triangle looks typical. This wave count has an even probability with the main wave count.
This wave count has a good probability. It does not diverge from the main wave count and it will not diverge for several weeks yet.
Triangles take up time and move price sideways. If primary wave 4 unfolds as a triangle then I would expect it to last months rather than weeks.
No. They would both be very similar flats; the running flat moves price sideways subdividing 3-3-5, a regular flat also moves price sideways and subdivides 3-3-5. There would be virtually no alternation. It could happen, but the probability is very low.
And your explanation should be accompanied by a chart; I have no idea how you can see primary wave 1 as a five wave structure followed by primary wave 2 as a regular flat. Believe me, I’ve tried to see an alternative to the rare running flat and I cannot.
FYI, just a quick note that the Wave Notation (linked on the RHS of this page under Categories) links to an empty post.
But your degree labels appear to be
Green – Minuette
Pink – Minute
Blue – Minor
Black – Intermediate
Dark Red – Primary
Hi Judy, thank you for letting us know about the broken link. We’ve had a look and it is now working properly. For your reference, the link to the Wave Notation post is: http://elliottwavegold.com/2013/09/wave-notation/
Hi Lara, it seems minuette ii is awfully shallow and brief in relation to minuette i. It would not shock me to see minuette ii continue on as a WXY and hit $1348-$1355 before resuming downtrend
You’re right, and at only 22 hours to minuette wave (i) 83 hours that would have seen it better in proportion.
However, a combination W-X-Y should move sideways.
A double zigzag should deepen the correction.
Anyway, the market has answered the question today. It was over already.
Lara, from big picture from 2011, I still see the primary wave 4 correction is more like a regular flat which is still different from wave 2 (running flat). Is it possible? If it is possible, than current intermediate wave Y may have 5 waves structure so that W-X-Y becomes 3-3-5.
Lara, do you have estimate on how many trading days to reach target of 1270 ?
Three or four days.