
Yesterday’s analysis expected downwards movement to continue. A slight new low was made, but overall price has moved sideways and slightly higher for the session. The target remains the same and the wave count is mostly the same.
Summary: It is most likely we shall see an increase in downwards momentum over the next 24 to 36 hours. The target is at 1,271.
This analysis is published about 04:40 p.m. EST. Click on charts to enlarge.
Main Wave Count.
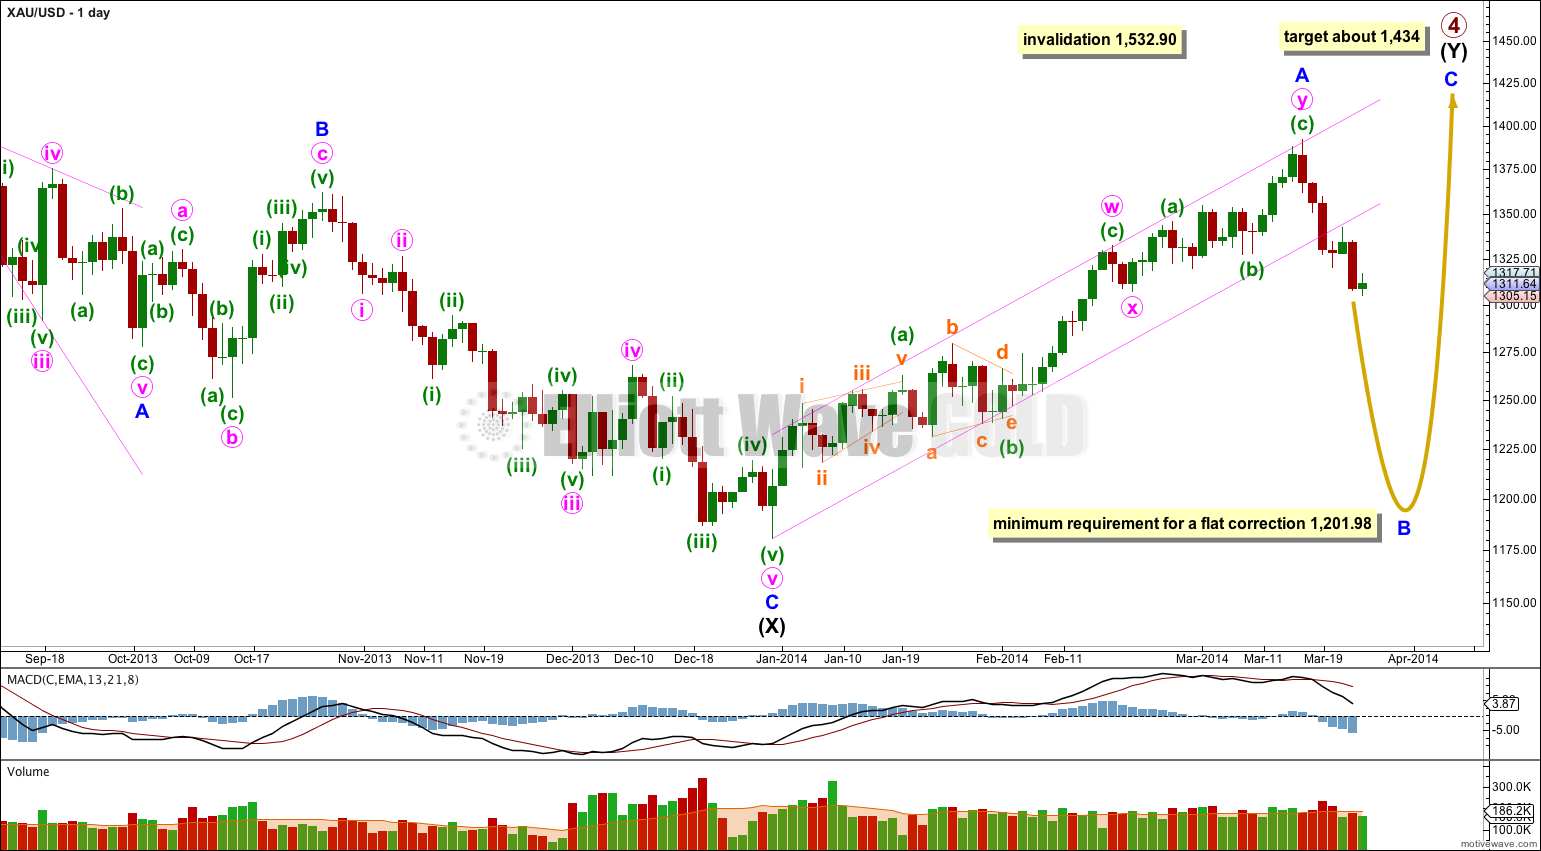
Gold is still within a large fourth wave correction at primary wave degree which is incomplete.
Primary wave 2 was a rare running flat. Primary wave 4 is unlikely to be a flat correction because it is likely to show structural alternation with primary wave 2.
The first upwards wave within primary wave 4 labeled intermediate wave (W) subdivides as a three wave zigzag. Primary wave 4 cannot be an unfolding zigzag because the first wave within a zigzag, wave A, must subdivide as a five.
Primary wave 4 is unlikely to be completing as a double zigzag because intermediate wave (X) is a deep 99% correction of intermediate wave (W). Double zigzags commonly have shallow X waves because their purpose it to deepen a correction when the first zigzag does not move price deep enough.
Primary wave 4 is most likely to be completing as a double combination: zigzag – X – second structure. The second structure labeled intermediate wave (Y) may be either a flat or a triangle. For both these structures minor wave A must be a three.
Primary wave 4 may not move into primary wave 1 price territory. This wave count is invalidated with movement above 1,532.90.
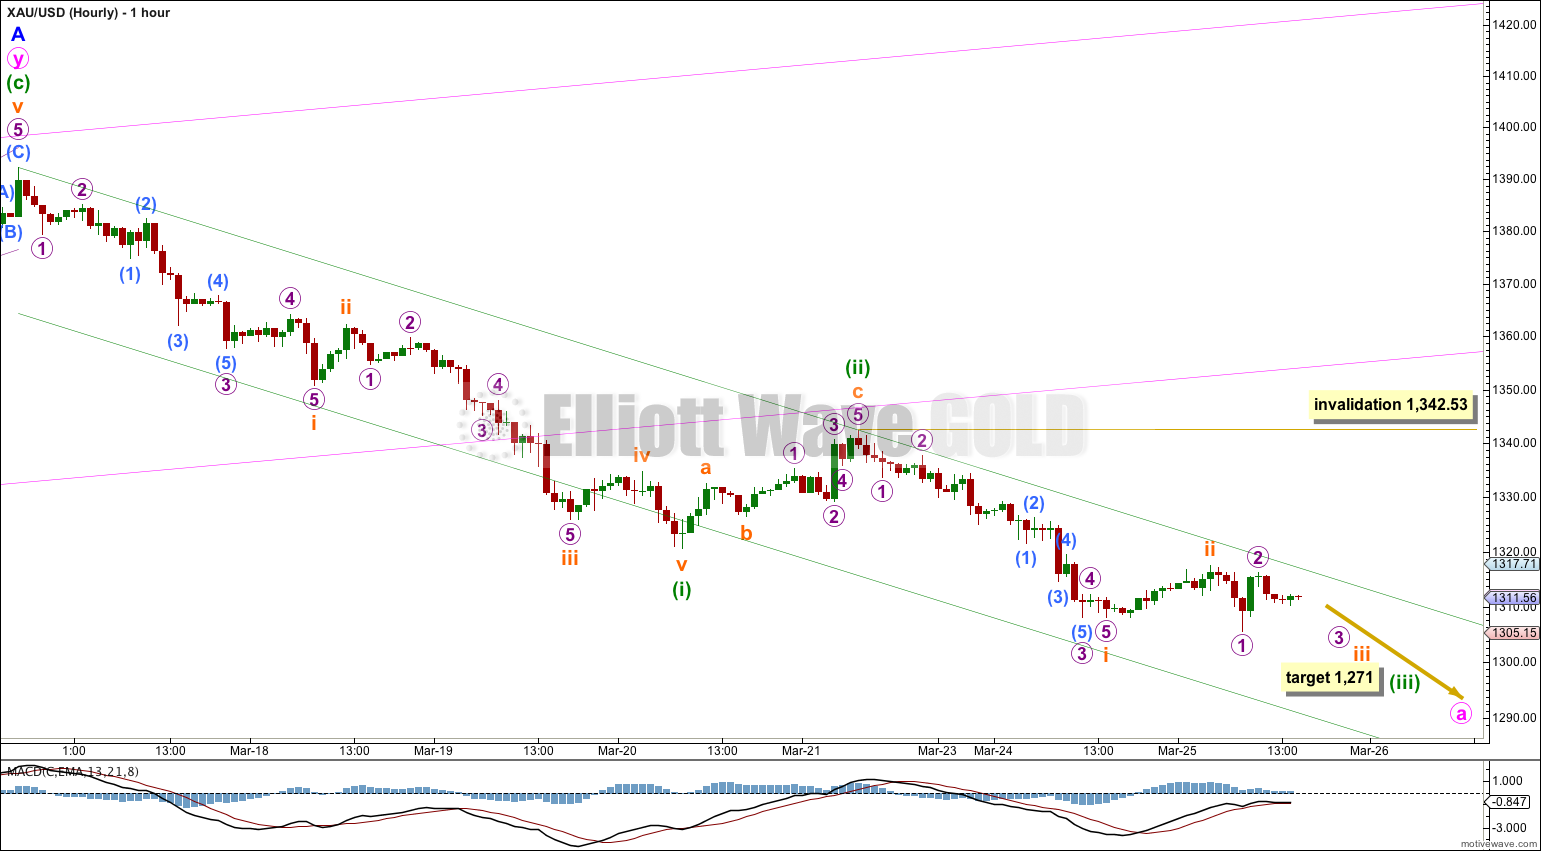
There are more than thirteen possible corrective structures that minor wave B may take. It is most likely to be a zigzag. Within a zigzag minute wave a must subdivide as a five wave motive structure, either a leading diagonal or an impulse. This downwards movement so far is clearly not a diagonal and it may be an impulse.
This main hourly wave count follows the most likely structure of a zigzag for minor wave B.
If minuette wave (iii) is extending then within it we may see subminuette waves ii and iv show on the daily chart. It looks like that is what is happening. Subminuette wave ii may now be over, but if it continues further it should find resistance at the upper edge of the base channel drawn about minuette waves (i) and (ii).
At 1,271 minuette wave (iii) would reach equality with minuette wave (i). Within minuette wave (iii) when subminuette waves iii and iv are complete I will add to this target calculation at a second wave degree, so it may change. If it changes I would expect it to be lower.
The next wave downwards would be a third wave within a third wave, and it should show an increase in downwards momentum beyond that seen for minuette wave (i) and should strongly breach the lower edge of the base channel.
Subminuette wave ii may not move beyond the start of subminuette wave i. This wave count is invalidated with movement above 1,342.53.
Alternate Hourly Wave Count.
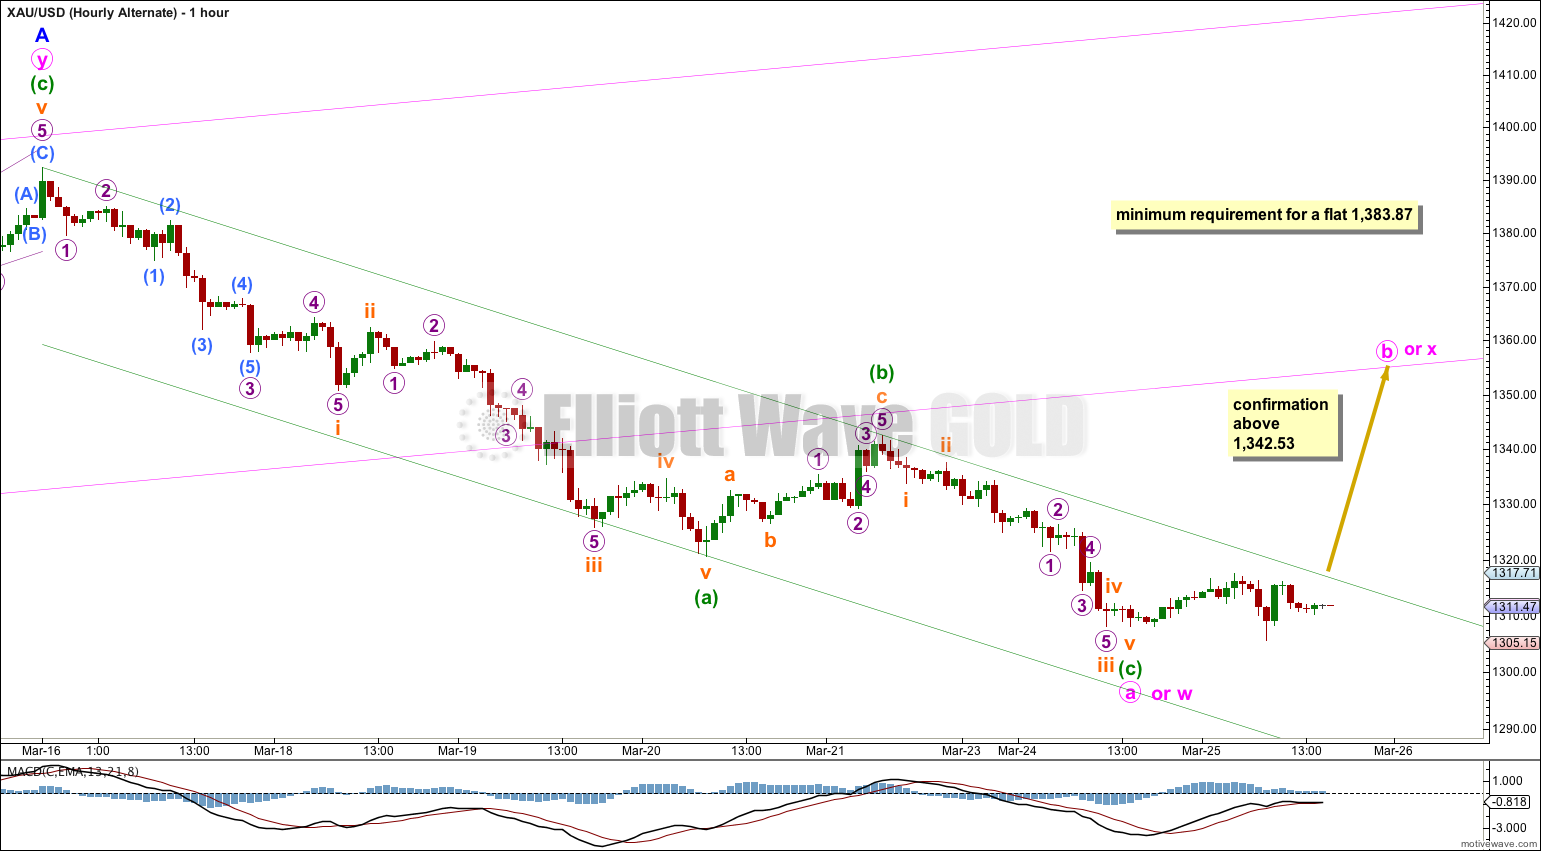
If minor wave B is a flat (or a combination with a flat as the first structure) then minute wave a within it must subdivide as a three. Minute wave a for this alternate is seen as a zigzag which may now be complete. If the main wave count is invalidated then this is the wave count I would use.
When minute wave a subdivides as a three then minute wave b may make a new price extreme beyond the start of minute wave a. There is no upper invalidation point for this reason.
If minor wave B is a flat correction then within it minute wave b must reach a minimum 90% length of minute wave a at 1,383.87.
If minor wave B is a combination or double zigzag (instead of minute a-b-c we would relabel this minute w-x-y) then there is no minimum requirement for an upwards minute wave x. I would expect it to find resistance at the lower edge of the pink channel.
The green channel drawn here is termed a corrective channel when it is drawn about a correction. Now that minuette wave (c) may be complete a clear breach of the upper edge of this channel would indicate that minute wave a (or w) is over and minute wave b (or x) is underway.
Alternate Daily Wave Count – Triangle.
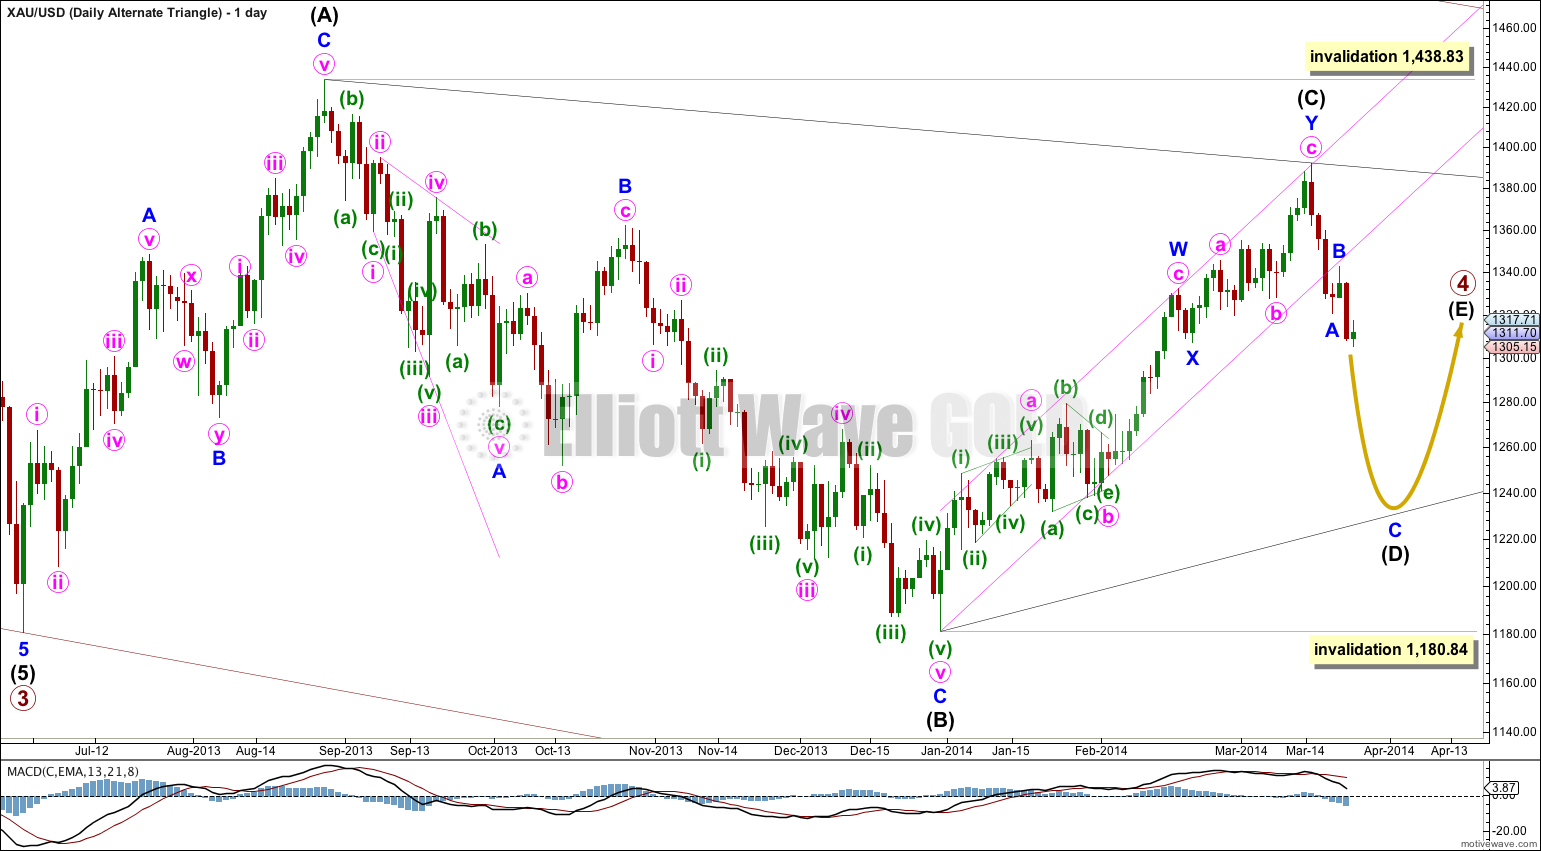
It is also possible that primary wave 4 may continue as a regular contracting (or barrier) triangle. With MACD moving reasonably close to the zero line on the daily chart this triangle looks typical. At this stage the subdivisions within primary wave 4 do not indicate whether it is a triangle or combination, both are possible. A triangle is less likely only because it is not as common a structure as a double combination.
This wave count has a good probability. It does not diverge from the main wave count and it will not diverge for several weeks yet.
Triangles take up time and move price sideways. If primary wave 4 unfolds as a triangle then I would expect it to last months rather than weeks.
Thanks Richard!
Hi Lara,
I am thinking about the possibility that blue letter A-B-C waves have already been completed, making completed Y, and the wave 4. To me, this count seems more natural in terms of time spent in this current up wave since late December. If so, gold is in impulse 5 waves down – same with your GDX count.
What do you think?
Thank you for your excellent work in gold analysis.
I think it looks wrong at the weekly chart level. Also, if that were the case you would have to see the upwards wave I have labeled minor wave A as a completed single zigzag, and the subdivisions don’t fit very well for that. Finally, that would make primary wave 4 a double zigzag but it would be a weird looking double zigzag; the X wave is way too deep and the second zigzag would not have deepened the correction. The purpose of double zigzags is to deepen a correction when the first zigzag does not move price deep enough which is why their X waves are typically shallow and the second zigzag moves price beyond the end of the first zigzag. Like minor wave A as I have it labeled, that looks like a typical double zigzag.
Great charts this week Lara. You are the Einstein of Elliott Waves.
Tomorrow or Thursday I dump the nets and pull in the catch of my Gold profits. Thanks Lara. You Rock!