Price has moved lower as expected for Friday, but the targets have not been met. At this stage the alternate hourly wave count diverges from the main wave count.
Summary: The trend remains down. We may not see the increase in momentum I was expecting. This downwards movement may end at 1,262 (first short term target) or 1,273 to 1,270. If downwards momentum increases then the lower targets will be used.
This analysis is published about 05:40 p.m. EST. Click on charts to enlarge.
Historic Analysis.
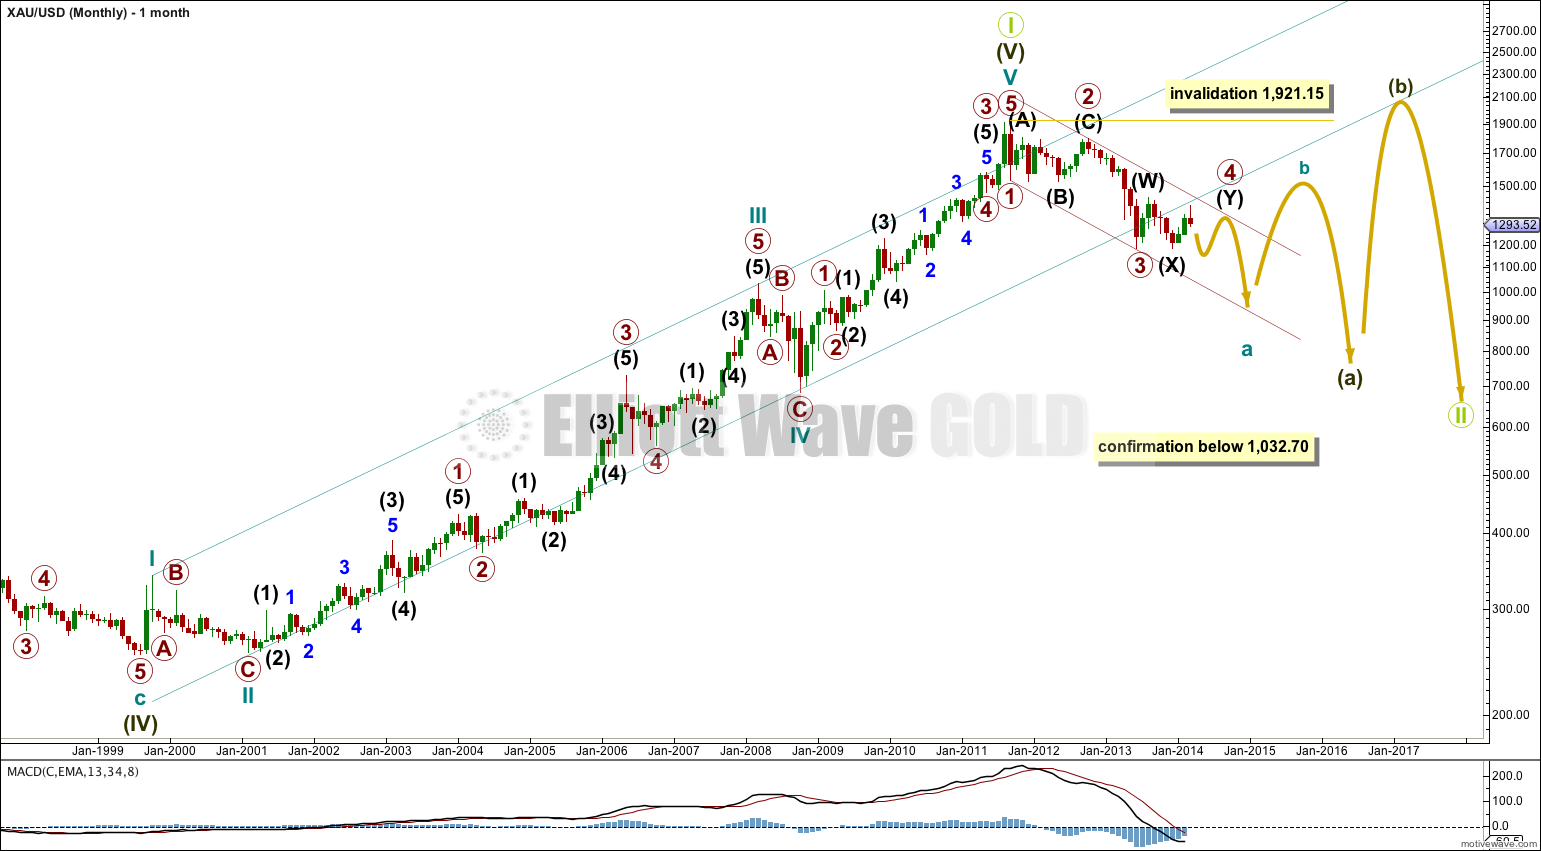
This main monthly wave count expects that Gold is within a huge Grand Super Cycle second wave correction (lime green II circled).
Within the the correction super cycle wave (a) may be unfolding as a zigzag.
Within super cycle wave (a) cycle wave a is unfolding as an impulse and price is currently within primary wave 4 of that impulse.
When cycle wave a is complete then cycle wave b upwards must subdivide as a corrective structure. It may not move beyond the start of cycle wave a above 1,921.15.
This main wave count is confirmed at the monthly chart level because at that stage my alternate would be invalidated.
To see larger monthly charts, a comparison with Silver, and the alternate wave count click here.
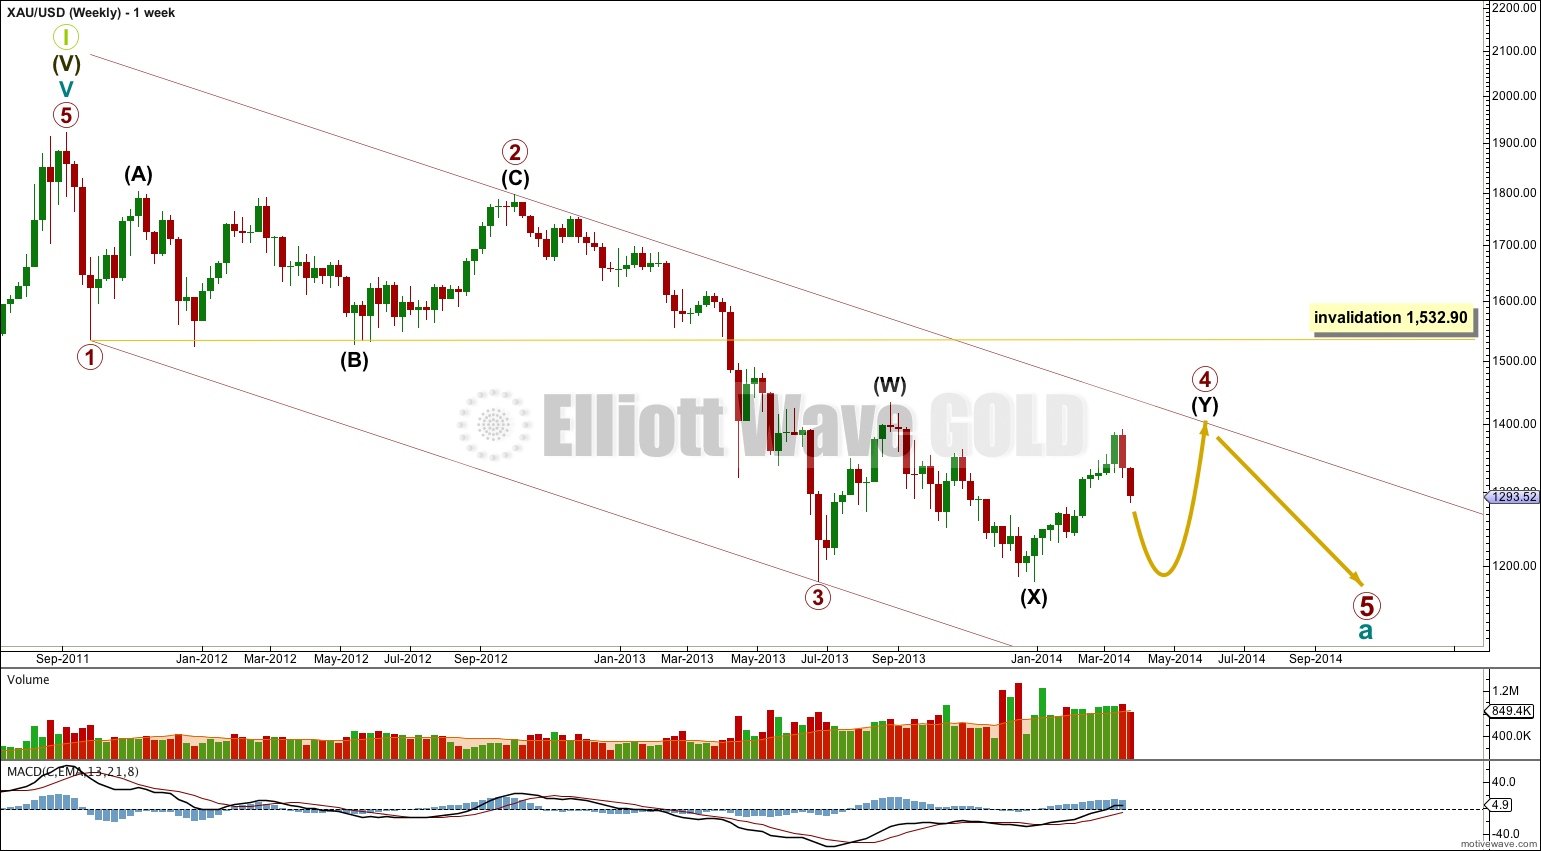
So far to the downside this movement is unfolding as an impulse which is incomplete.
Primary wave 1 must end as labeled and not on the next low within intermediate wave (B) (as some have suggested), because primary wave 1 must look clearly like a five wave structure (and not look like a three wave structure) on the weekly and monthly charts.
This means primary wave 2 is a rare running flat. Within it intermediate wave (B) is a clear three wave structure and it ends slightly beyond the start of intermediate wave (A). Intermediate wave (C) fails slightly to move price beyond the end of intermediate wave (A).
I have also considered the possibility that primary wave 2 ended at the high labeled intermediate wave (A) and that subsequent sideways movement was intermediate waves (1) and (2) within primary wave 3. I have firmly discarded that idea as it would see intermediate wave (2) much longer in duration (it would be 40 weeks) in comparison to primary wave 2 which would be 6 weeks. Also a lower degree second wave would strongly breach a base channel about a first and second wave one degree higher. This may be sometimes acceptable on an hourly chart, but not with intermediate and primary degrees waves on a weekly chart.
My conclusion is that primary wave 4 must be incomplete. This is supported by the structure of intermediate wave (X) downwards as a clear three. That cannot be primary wave 5 because primary wave 5 must subdivide as a five wave structure.
Draw a channel about this downwards movement on the weekly chart. Draw the first trend line from the ends of primary waves 1 to 3, then place a parallel copy upon the end of primary wave 2. Expect upwards movement to find resistance at the upper edge of that channel as primary wave 4 comes to end, if it gets up that close.
Primary wave 4 may not move into primary wave 1 price territory. This wave count is invalidated with movement above 1,532.90.
Main Wave Count.
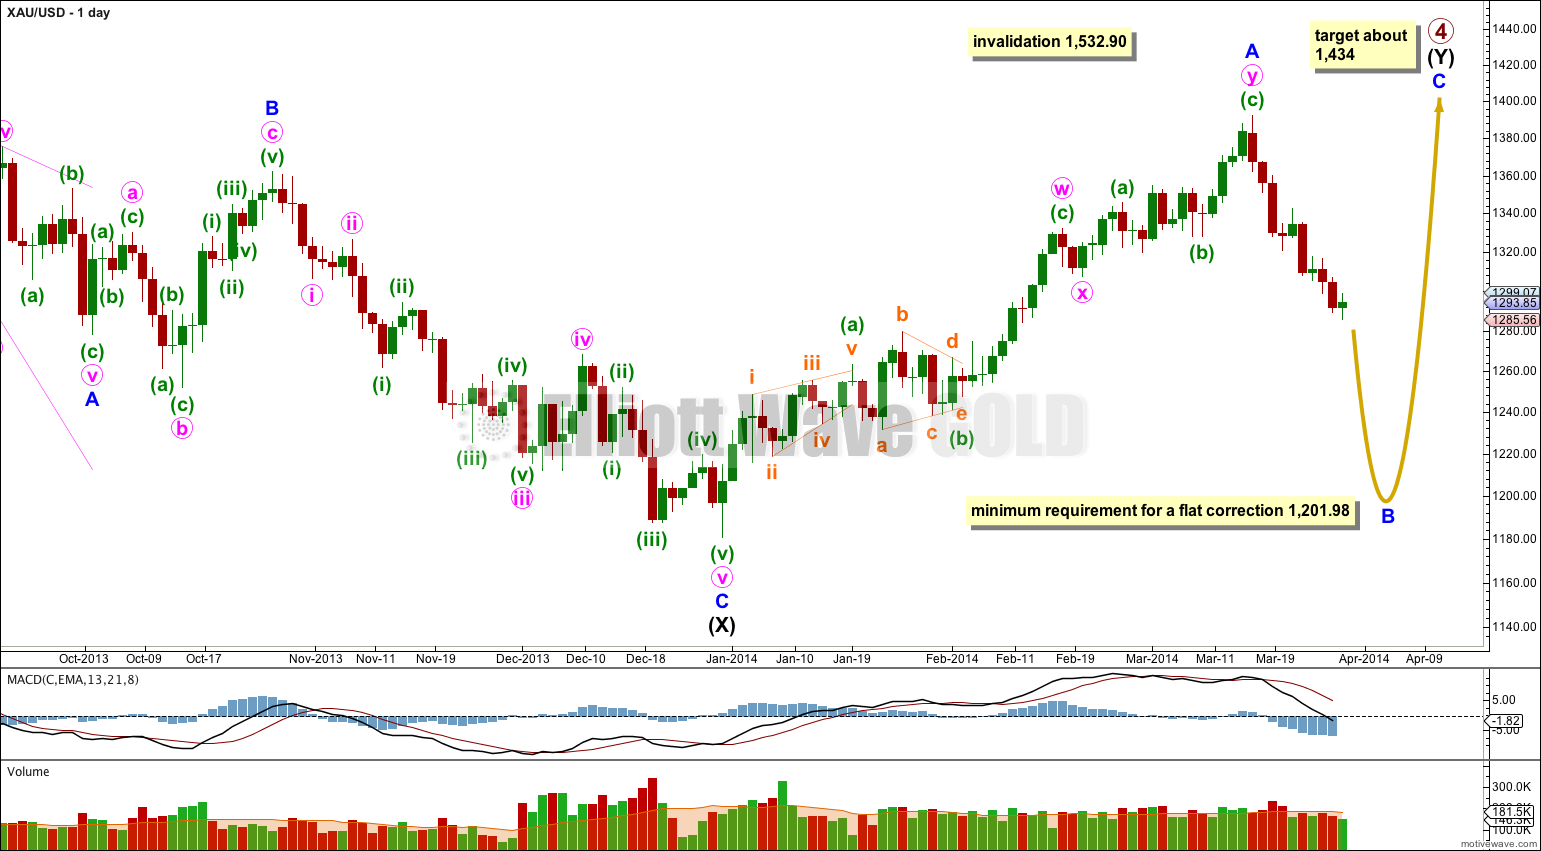
Gold is still within a large fourth wave correction at primary wave degree which is incomplete.
Primary wave 2 was a rare running flat. Primary wave 4 is unlikely to be a flat correction because it is likely to show structural alternation with primary wave 2.
The first upwards wave within primary wave 4 labeled intermediate wave (W) subdivides as a three wave zigzag. Primary wave 4 cannot be an unfolding zigzag because the first wave within a zigzag, wave A, must subdivide as a five.
Primary wave 4 is unlikely to be completing as a double zigzag because intermediate wave (X) is a deep 99% correction of intermediate wave (W). Double zigzags commonly have shallow X waves because their purpose it to deepen a correction when the first zigzag does not move price deep enough.
Primary wave 4 is most likely to be completing as a double combination: zigzag – X – second structure. The second structure labeled intermediate wave (Y) may be either a flat or a triangle. For both these structures minor wave A must be a three.
Primary wave 4 may not move into primary wave 1 price territory. This wave count is invalidated with movement above 1,532.90.
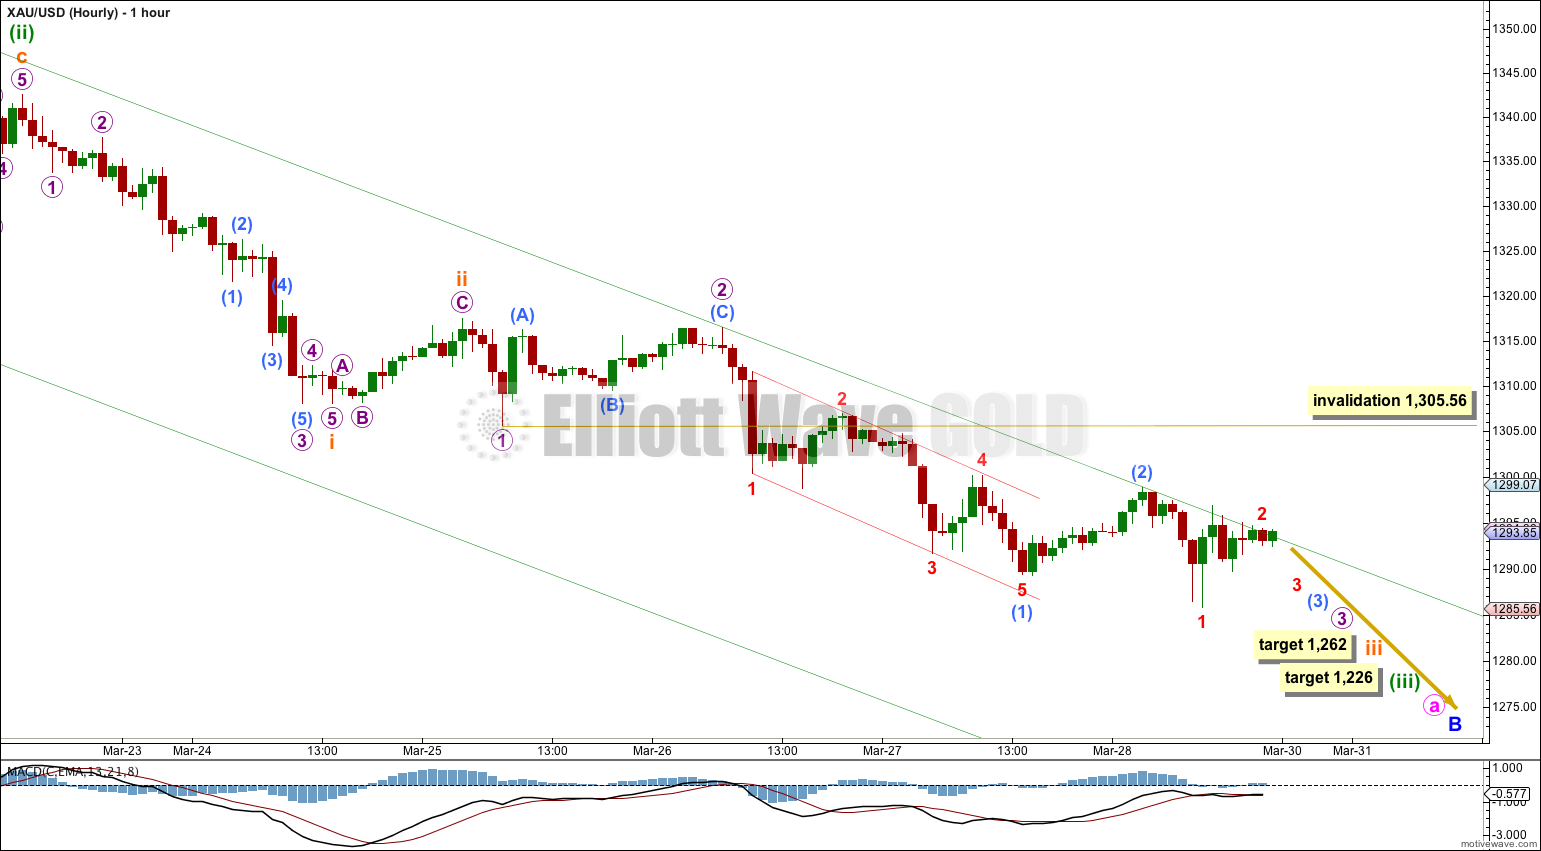
This main hourly wave count expects minor wave B downwards is unfolding as a zigzag which subdivides 5-3-5. Within a zigzag minute wave a must subdivide as a five wave structure, and this may be an incomplete impulse.
Within minute wave a the third wave has not passed the middle, because we have not seen a strong increase in downwards momentum beyond that seen for minuette wave (i). At 1,226 minuette wave (iii) would reach 1.618 the length of minuette wave (i).
Also, within minuette wave (iii) the middle has not yet passed because subminuette wave iii has not yet shown an increase in downwards momentum beyond that seen for subminuette wave i. At 1,262 subminuette wave iii would reach 1.618 the length of subminuette wave i.
This wave count requires an imminent very strong increase in downwards momentum. Failure to see this increase so far puts some doubt on this wave count. However, it is my experience that sometimes third waves begin slowly, and when they do this they convince us the wave count is wrong and we have seen a trend change. This happens right before a strong third wave takes off. If is for this reason that I still publish this wave count as it is for you.
The green best fit channel is nicely showing where upwards movement is finding resistance. The first trend line is drawn from the high of minor wave A to the high of micro wave 2 within subminuette wave iii. If upwards movement clearly breaches this channel then I would favour the alternate hourly wave count below.
Within subminuette wave iii micro wave 4 may not move back into micro wave 1 price territory. This wave count is invalidated with movement above 1,305.56.
Alternate Hourly Wave Count.
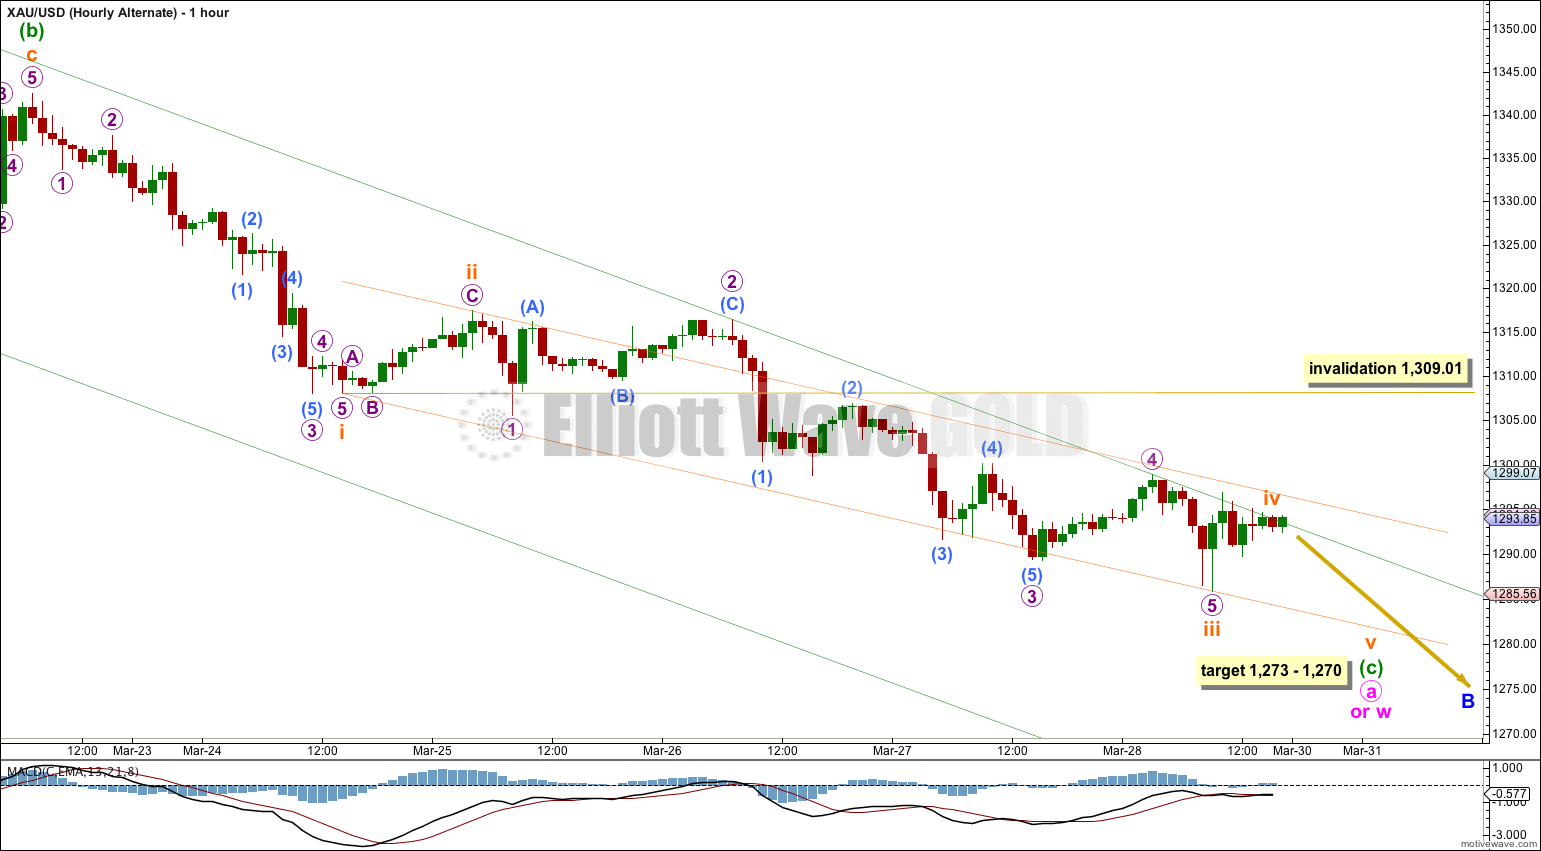
If minor wave B is a flat (or a combination with a flat as the first structure) then minute wave a (or w) within it must subdivide as a three. Minute wave a (or w) for this alternate is seen as an almost complete zigzag.
I have some concerns with this alternate wave count too today. If minuette wave (c) has passed its middle then within it subminuette wave iii did not show stronger momentum than subminuette wave i. This is possible but unusual. Sometimes for Gold fifth waves show stronger momentum than its third waves, but rarely do first waves show stronger momentum than its third waves.
However, within zigzags C waves do not have to show stronger momentum than A waves. The fact that minuette wave (c) has not shown an increase in momentum beyond that seen for minuette wave (a) certainly fits this wave count.
The current sideways movement which I am labeling subminuette wave iv looks like a contracting triangle which fits nicely for a fourth wave.
At 1,273 subminuette wave v would reach 0.618 the length of subminuette wave i. At 1,270 minuette wave (c) would reach equality in length with minuette wave (a). This gives us a $3 target zone calculated at two wave degrees.
If the next wave down does not show an increase in momentum then this alternate will be correct.
Within minuette wave (c) subminuette wave iv may not move into subminuette wave i price territory. This wave count is invalidated with movement above 1,309.01.
Alternate Daily Wave Count – Triangle.
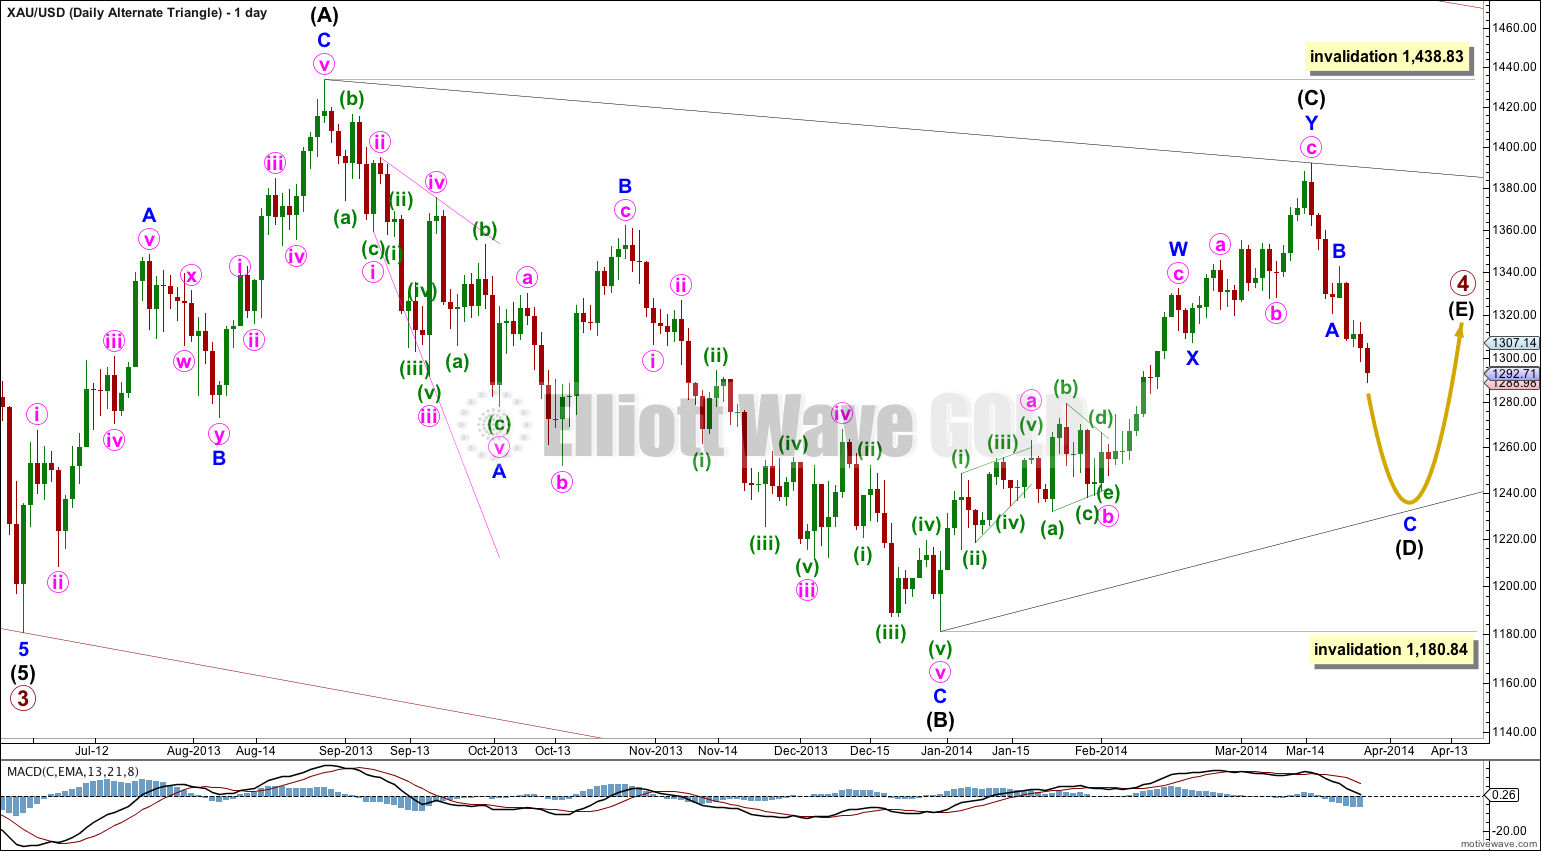
It is also possible that primary wave 4 may continue as a regular contracting (or barrier) triangle. With MACD moving reasonably close to the zero line on the daily chart this triangle looks typical. At this stage the subdivisions within primary wave 4 do not indicate whether it is a triangle or combination, so both are possible. A triangle is less likely only because it is not as common a structure as a double combination.
This wave count has a good probability. It does not diverge from the main wave count and it will not diverge for several weeks yet.
Triangles take up time and move price sideways. If primary wave 4 unfolds as a triangle then I would expect it to last months rather than weeks.

Daneric’s chart
Posting Daneric’s long term chart here for reference. Very similar to Lara’s, just not as detailed. Also, showing that Primary 4 may complete as a triangle which is still an alternate in the background for Lara.
Wasn’t the USD based upon the gold price? If so then I think the relationship would allow for gold to be freely traded? The price of gold was not fixed?
Even if the price of gold was “artificially” fixed that is a part of social mood.
I do have an alternate monthly wave count with this current correction as a supercycle wave IV. The problem with that is if that is the case, it should have been over at the low of 1,180.40. Which means the last wave down does not fit, it should be a five and it’s clearly a three. And also the first wave up from the low at 1,180.40 should be a five and it cannot be because there is a triangle in a second wave position.
That scenario looks extremely unlikely.
It would be finally invalidated with movement below 1,032.70, that is where I have the high for a possible cycle wave I. Cycle wave IV may not move into cycle wave I price territory below 1,032.70.
Lara I have a spreadsheet from EWI Theorist dated November 15, 2013 and they show Gold from 1900 up to date.
Cycle l ended about 1934, ll 1968, lll 1/21/1980, lV 8/25/1999 and V 9/6/2011.
Lara their counts match your counts. You are correct as usual Lara, especially since you are the Einstein of Elliott Waves. Good for you and us!
If Elliott Wave theory measures investor psychology then is it not the case that markets have to be freely traded? In the early part of the 20th century gold was linked to the dollar and so the price was not freely discovered and as such the wave count should start around 1970 when the tie was broken. Your long term chart shows the 1980 peak as supercycle III but perhaps this should be supercycle I, with III in 2011, and we are now in supercycle IV. I think you might have had this option at one time and it does fit with MACD. Does this seem like a reasonable possibility?