Last analysis had three hourly wave counts. The main wave count expected a little more upwards movement. The alternate wave count was invalidated.
Summary: While price remains within the channel on the hourly chart we must expect the short term trend remains up. I am still expecting to see a small correction against this trend show up this week.
This analysis is published about 5:00 p.m. EST. Click on charts to enlarge.
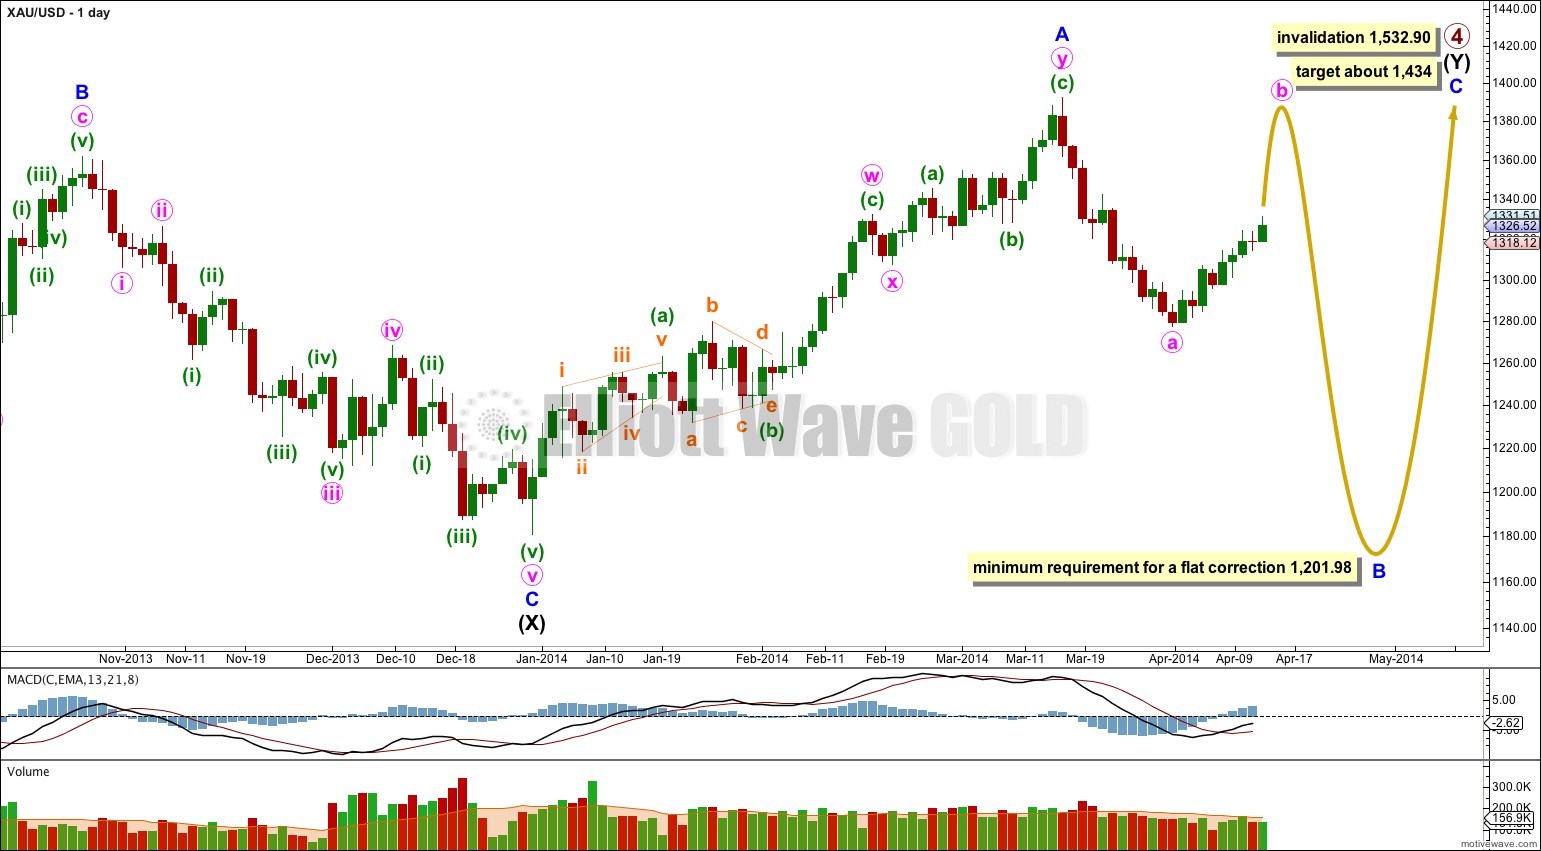
Gold is still within a large fourth wave correction at primary wave degree which is incomplete.
Primary wave 2 was a rare running flat. Primary wave 4 is unlikely to be a flat correction because it is likely to show structural alternation with primary wave 2.
Primary wave 4 is most likely to be completing as a double combination: zigzag – X – second structure. The second structure labeled intermediate wave (Y) is most likely to be a flat correction. Within the flat correction minor wave B must reach a minimum 90% the length of minor wave A at 1,201.98.
Overall the structure for primary wave 4 should take up time and move price sideways, and the second structure should end about the same level as the first at 1,434. Primary wave 4 may not move into primary wave 1 price territory. This wave count is invalidated with movement above 1,532.90.
Within intermediate wave (Y) minor wave B downwards is an incomplete corrective structure: either a flat correction (main hourly wave count) or a double zigzag (alternate hourly wave count). Minor wave B should continue for a few more weeks and may make a new low below 1,180, and is reasonably likely to do so in coming weeks.
Primary wave 4 may also be a large contracting triangle, but at this stage this idea does not have the “right look” and so I will not publish a chart for it. I will continue to follow this idea and will publish a chart in coming weeks for it if it shows itself to be correct. At this stage there is no divergence between wave counts for a triangle or a double combination.
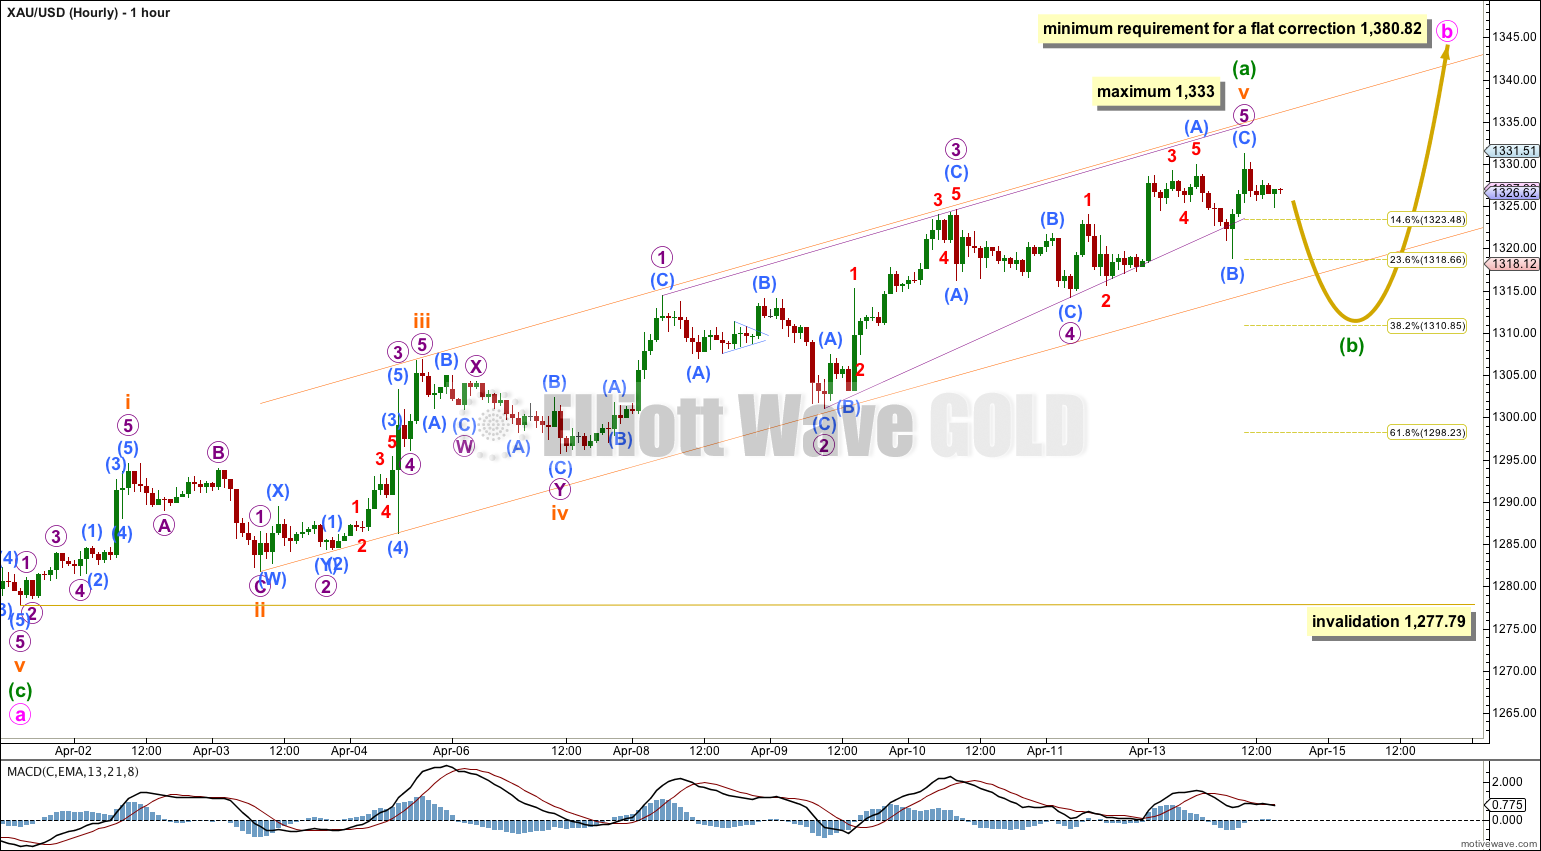
This main wave count follows the idea that minor wave B may be unfolding as a flat correction. Within the flat correction minute wave a subdivides as a single zigzag. Minute wave b within the flat must reach a minimum of 90% the length of minute wave a at 1,380.82.
Minute wave b is most likely to subdivide as a single or double zigzag in order to reach 1,380.82.
Within a zigzag minuette wave (a) must subdivide as a five wave structure. It may be a complete impulse. I would want to see the channel containing minuette wave (a) upwards clearly breached by downwards movement to have any confidence that for now upwards movement is over and minuette wave (b) downwards has begun.
Within minuette wave (a) subminuette wave iii is 2.07 short of 1.618 the length of subminuette wave i. There is no Fibonacci ratio between subminuette wave v and either of subminuette waves i or iii. Subminuette wave v is now a complete ending contracting diagonal.
If upwards movement continues from there then micro wave 5 would reach equality in length with micro wave 1 at 1,333. It should end before that point. It would be likely to end at or before reaching the upper edge of the channel.
Minuette wave (a) may have lasted nine days. I would expect minuette wave (b) to last at least three days, and maybe up to eight or nine days. It should show up very clearly on the daily chart. It may be be very choppy and overlapping, and it may include a new price extreme beyond its start.
Minuette wave (b) may not move beyond the start of minuette wave (a) below 1,277.79.
Alternate Hourly Wave Count.
This alternate wave count follows the idea that minor wave B downwards may be unfolding as a double zigzag. The first zigzag downwards is labeled minute wave w. The double should be joined by a “three” in the opposite direction which may subdivide as any corrective structure labeled minute wave x.
At this stage this alternate wave count is again the same as the main wave count with the sole exception of minute wave x not requiring a minimum upwards length.
Minuette wave (b) may end about either the 0.382 or 0.618 Fibonacci ratios of minuette wave (a). When there is some structure within it to analyse then I may be able to calculate a target for it to end.
Minuette wave (b) may not move beyond the start of minuette wave (a) below 1,277.79.


I have the answer now, both channel lines works as the price is accelerating to downward movement while it is passing them.
Lara, I need to praise you once again on what have you done last Friday analysis at 11th April, you analysis the subminuette V wave is a ending diagonal, when I watched your report on Saturday, I believe your first analytical guess is perfectly fit, I remember at that night when running the Miniscute 3,4,5 of submicro (c) in Micro 3, I really have no idea what was going on on the Impluse Micro wave 3 and the coming after correction on wave 4,how to count it correctly. After you published on Friday report, I feel consensus to your analysis and finally comes true today now.
Yes, that one worked nicely.
The only question now is have I got the analysis of minuette wave (a) as a five correct? Could it be a three?
I’ll be looking at that possibility.
Please excuse me I forget to attached my chart
Hi, Lara,
Why do I draw the running channel looks like different from yours? I drew my channel line referring to the subminuette i, iii of minuette wave a, while your channel seems to referring to the line joining the micro 1 and 3 of subminuette v ? Do you mean that it should confident on trend change only if the price break through your channel drawn rather than mine one. Is it because we are running in subminuette wave v, so we need to referring that channel created by micro wave 1,3
My channel was drawn as a “best fit” because it had a better fit than an Elliott channel. You have drawn your channel using Elliott’s technique.
The market has answered. Both channels are clearly breached today!