
Last analysis looked for a channel breach on the hourly chart before confidence could be had in a trend change and downwards targets. The channel was not breached and upwards movement continued. Price remains below the invalidation point on the daily chart.
Click on charts to enlarge.
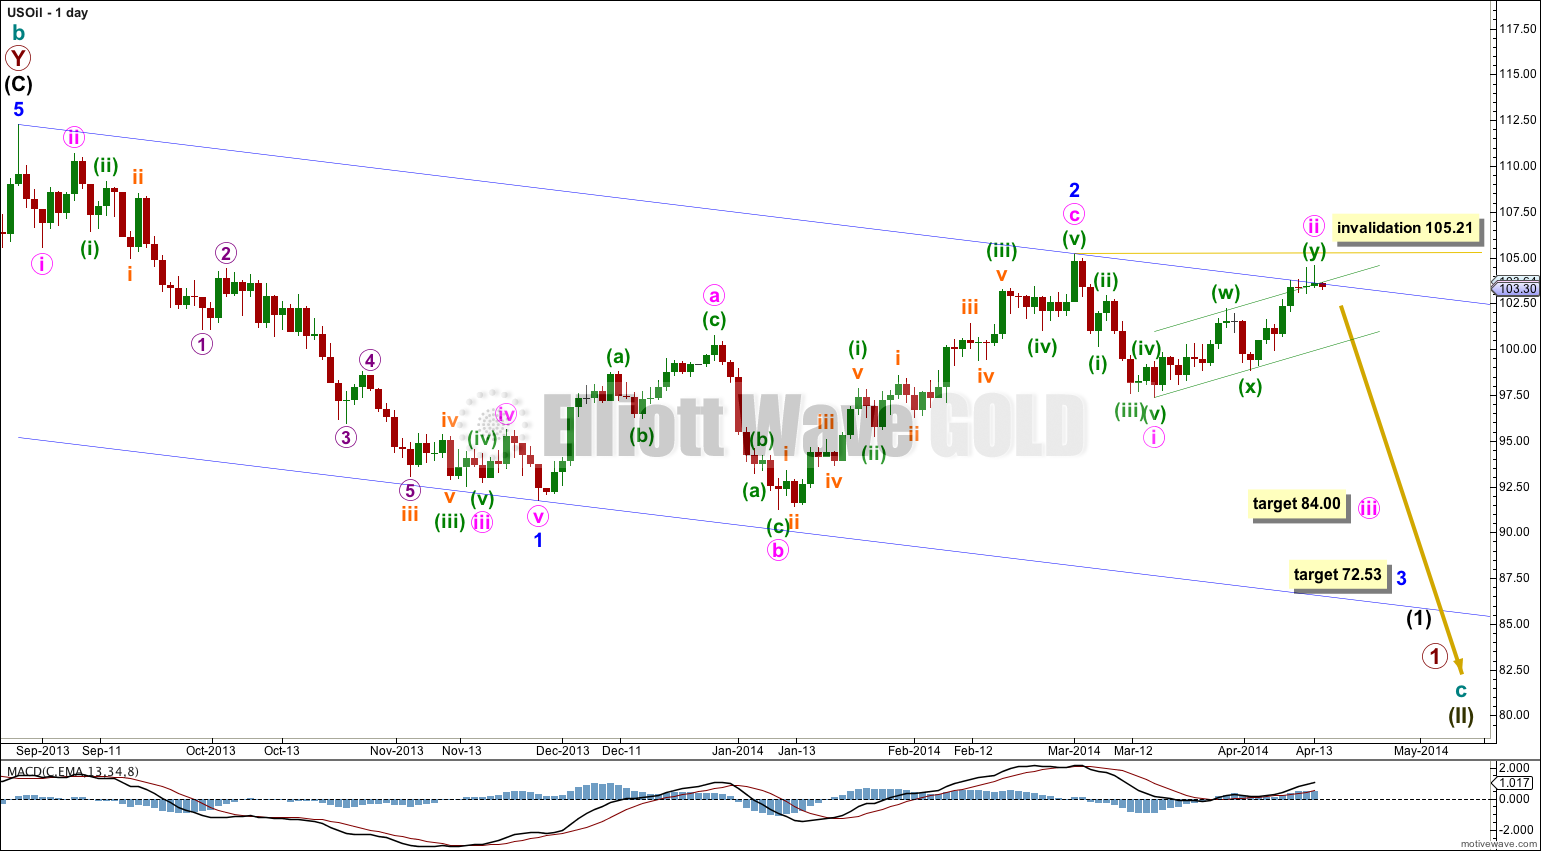
The daily chart shows all of the start of cycle wave c downwards.
Minor wave 1 subdivides perfectly as an impulse. Minor wave 2 is now complete as an expanded flat correction which is a 66% correction of minor wave 1.
At 72.53 minor wave 3 would reach 1.618 the length of minor wave 1.
Minor wave 1 lasted 65 days and minor wave 2 lasted 67 days. Minor wave 3 is likely to be extended and so should last longer than 65 days. It may complete in a total Fibonacci 89 days.
The channel drawn about minor waves 1 and 2 is a base channel. Minor wave 3 downwards should clearly and strongly breach the lower edge of the channel. Along the way down upwards corrections should find resistance about the upper edge of the channel. The channel is slightly overshot. Price should return to below the upper trend line. If this wave count is correct then minute wave ii must be over here as there is almost no room left for it to move higher.
Minute wave ii may not move beyond the start of minute wave i. This wave count is invalidated with movement above 105.21.
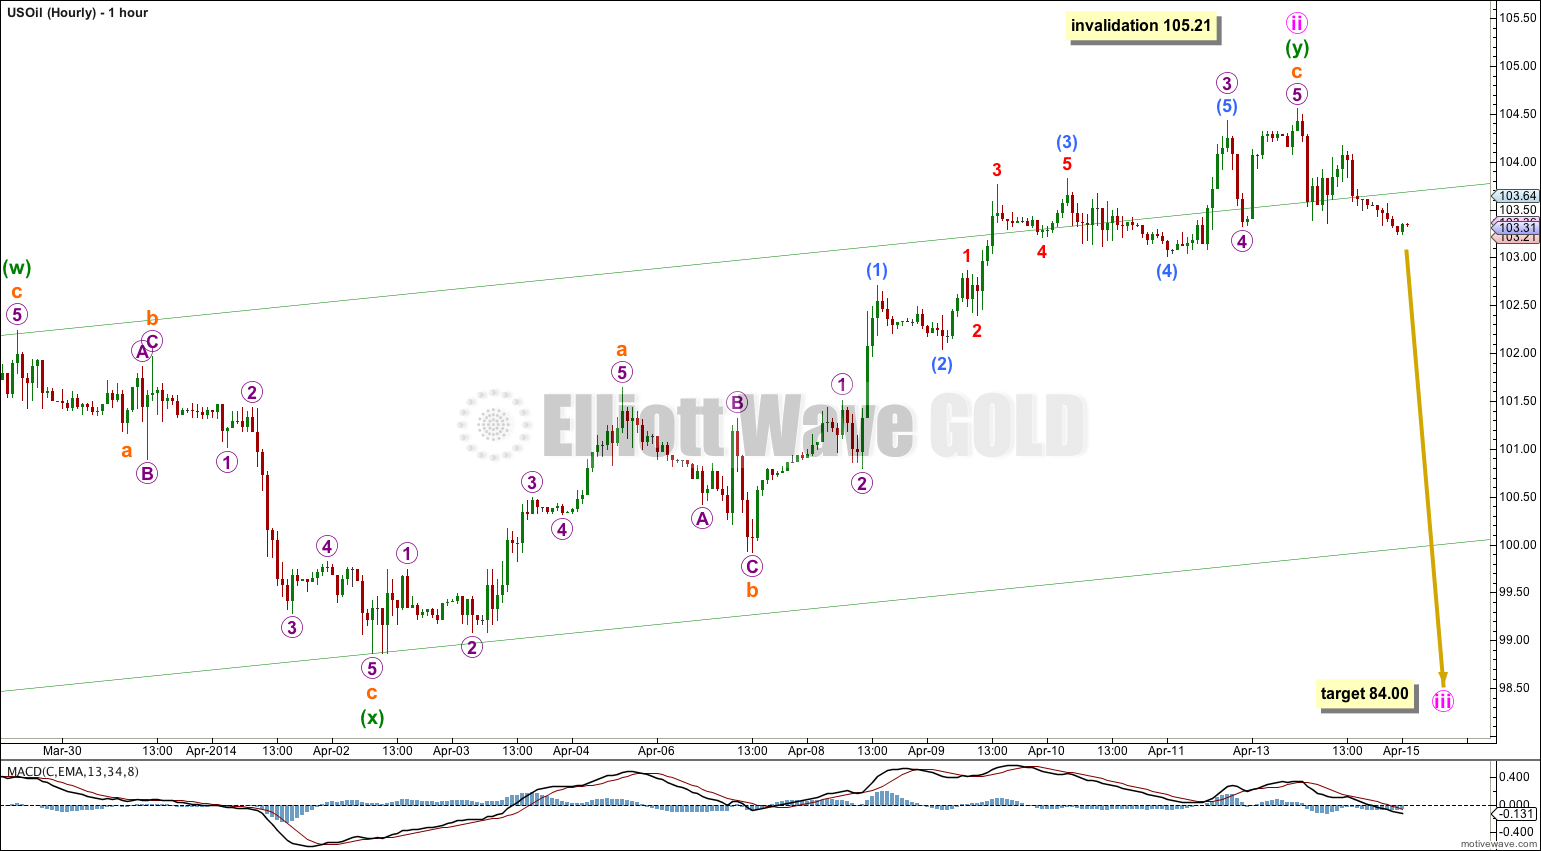
Minute wave ii continued higher as a double zigzag. There is no Fibonacci ratio between the two zigzags in this double, which is normal.
Within the first zigzag in the double, labeled minuette wave (w) (seen on the daily chart) there is no Fibonacci ratio between its subminuette waves a and c.
Within the second zigzag in the double, labeled minuette wave (y), subminuette wave c is 0.12 longer than 1.618 the length of subminuette wave a.
The channel drawn as a best fit which contains the whole structure of minute wave ii is overshot at the upper edge. There is divergence at the hourly chart level with price trending higher and MACD trending lower. This indicates a trend change is imminent.
If minute wave ii moves any higher it may not move above 105.21.
This wave count expects to see downwards movement for the next few weeks towards 84.00 where minute wave iii would reach 2.618 the length of minute wave i.
Minute wave i lasted 10 days, minute wave ii so far has lasted 20 days. I would expect minute wave iii to be extended so it should be longer in both duration and price than minute wave i. It should last at least three weeks, probably longer.
I’ll be doing this over the weekend.
Hi Lara
Would love an update if you get the time
Amr
Yes. The channel about the last second wave correction has been clearly broken. It’s probably on a third wave down now.
Hi Lara,,
Do you think US Oil has started 3rd of 3rd….So far we have not seen the kind of momentum 3rd of 3rd should witness. What is your take now?
Hi Lara,
if 105.21 does not hold, what would be your alternate wave count?
Thanks and have a good Easter weekend!
Heiko
I would expect that minor wave 2 is incomplete and moving sideways. The invalidation point would move up to the start of minor wave 1 at 112.24.
Thank you Lara. Now it appears the impulsive move to the downside is starting.
Heiko