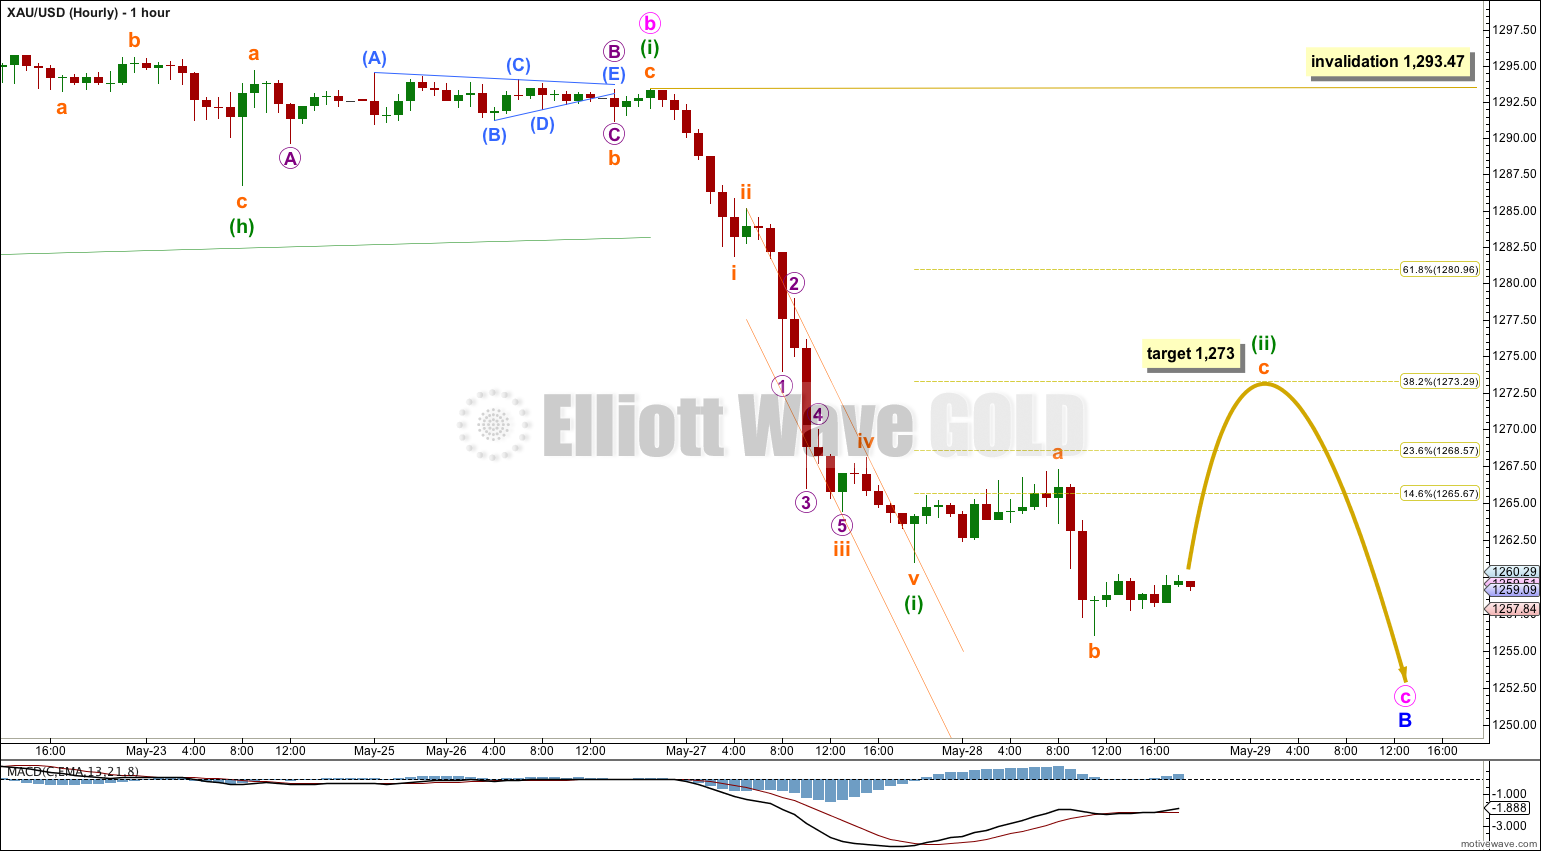
The short term target was 1,256. Price reached down to 1,256.06, so far. The wave count is unchanged.
Summary: I expect to see some upwards movement to complete a second wave correction at 1,273. This may complete a green candlestick for Thursday’s session. The invalidation point is at 1,293.47.
Update: if we see a new low below 1,256.06 before upwards movement then the second wave correction may not have yet arrived and I would expect price to continue lower.
This analysis is published about 07:30 p.m. EST. Click on charts to enlarge.
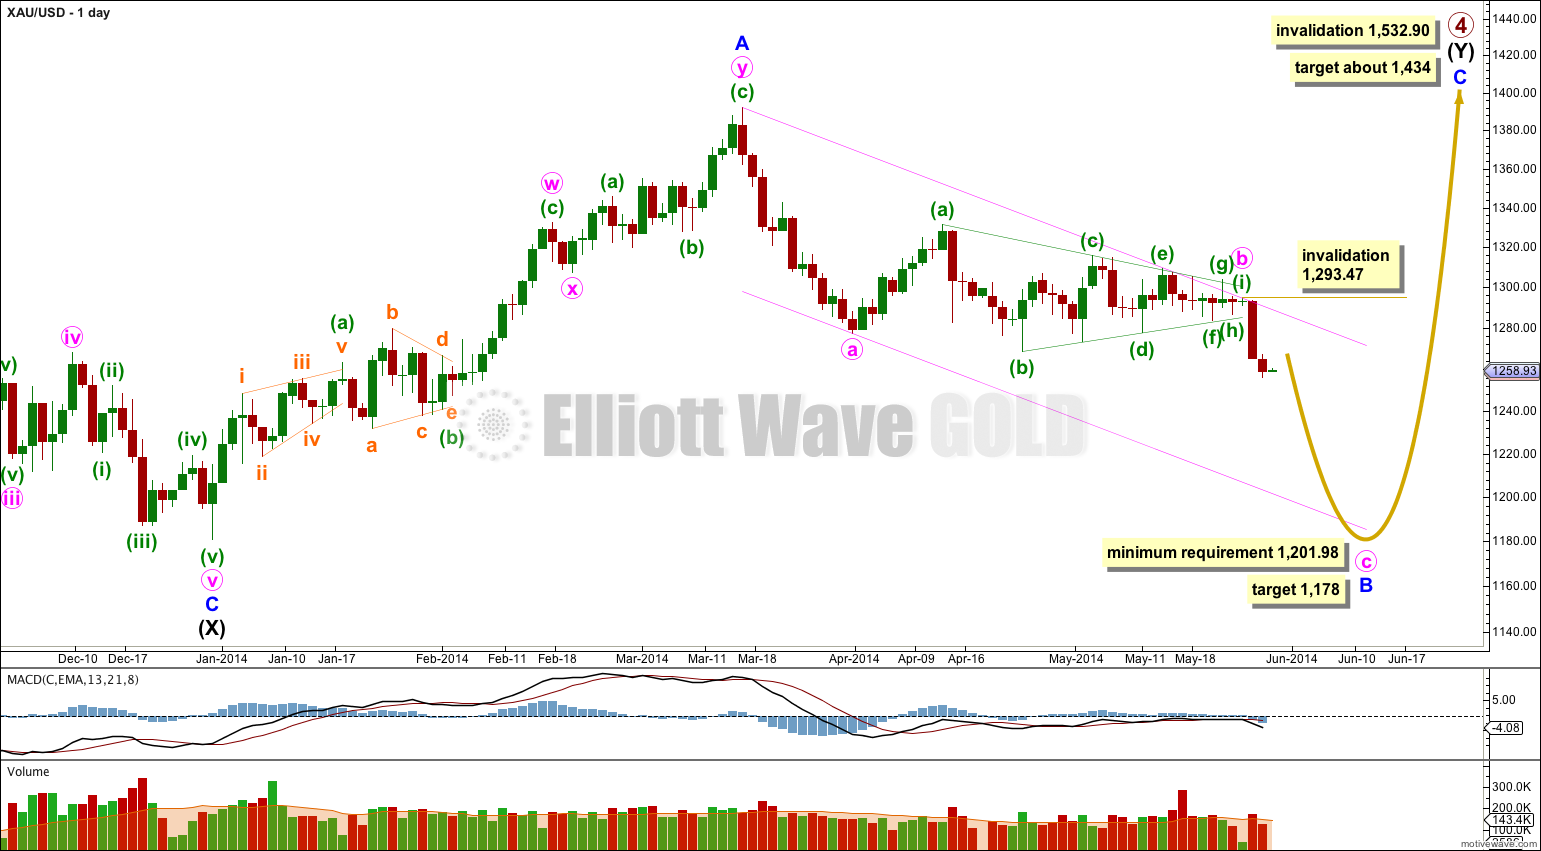
Gold is still within a large fourth wave correction at primary wave degree which is incomplete.
Primary wave 2 was a rare running flat. Primary wave 4 is unlikely to be a flat correction because it is likely to show structural alternation with primary wave 2.
Primary wave 4 is most likely to be completing as a double combination: zigzag – X – second structure. The second structure labeled intermediate wave (Y) is most likely to be a flat correction. Within the flat correction minor wave B must reach a minimum 90% the length of minor wave A at 1,201.98.
If downwards movement does not reach 1,201.98 or below then intermediate wave (Y) may not be a flat correction and may be a contracting triangle. I will keep this alternate possibility in mind as this next wave down unfolds. If it looks like a triangle may be forming I will again chart that possibility for you.
It remains possible that primary wave 4 in its entirety is a huge contracting triangle. If 1,201.98 is not met I would also consider this possibility.
Overall the structure for primary wave 4 should take up time and move price sideways, and the second structure should end about the same level as the first at 1,434. Primary wave 4 may not move into primary wave 1 price territory. This wave count is invalidated with movement above 1,532.90.
Within intermediate wave (Y) minor wave B downwards is an incomplete corrective structure, and at this stage the structure is most likely to be a single zigzag with a triangle for minute wave b which is now complete. At 1,178 minute wave c would reach equality in length with minute wave a. This would see minor wave B 101% the length of minor wave A and so intermediate wave (Y) would be a regular flat correction.
I have drawn a channel about minor wave B downwards: draw the first trend line from the start of minute wave a to the end of minute wave b, then place a parallel copy upon the end of minute wave a. I will expect downward movement to find support at the lower end of this channel due to this being the most common place for minute wave c to end.
Within minute wave c no second wave correction may move beyond the start of its first wave above 1,293.47. If minute wave c reaches equality in duration with minute wave a it will end in another ten days.
There is now a completed five wave structure downwards. Although price reached the target at 1,256 this is not where minuette wave (i) ends.
Ratios within minuette wave (i) are: subminuette wave iii is 1.80 longer than 1.618 the length of subminuette wave i, and subminuette wave v is just 0.11 short of 0.618 the length of subminuette wave i.
The small orange channel drawn about minuette wave (i) is drawn using Elliott’s second technique, and it is clearly breached by sideways and upwards movement. This is an indication that the first five down for minuette wave (i) is now complete and minuette wave (ii) is underway.
Minuette wave (ii) subdivides as an incomplete expanded flat correction. Subminuette wave a subdivides as a three, and importantly subminuette wave b downwards is a perfect three wave zigzag on the five minute chart. At 1,273 subminuette wave c would reach 2.618 the length of subminuette wave a, and minuette wave (ii) would reach up to the 0.382 Fibonacci ratio of minuette wave (i).
I would expect minuette wave (ii) to show up on the daily chart as at least one green candlestick, and that would give minute wave c a typical look on the daily chart.
When minuette wave (ii) is over then the next wave should be a third wave down.
Minuette wave (ii) may not move beyond the start of minuette wave (i) above 1,293.47.


I think you are mixing up traditional technical analysis descending triangle structures with Elliott wave triangles.
You’re right. Primary wave 4 could be a huge triangle. I’m again publishing this idea each day.
yes i see you been publishing that idea for long time I been having that same idea as well which makes me feel better about Descending Triangle 🙂 cuz you also show that it will come down to 1200 area so if your elliot wave count show it will come down and my descending triangle that makes it 2 indicators however the thing that you showed earlier that after it drops to 1200 it will go back up to 1400 or so doesn’t fit my descending triangle AT ALL!!!!! so thats why i was wondering.
Lara, in the light of the recent breakdown perhaps you should update your silver wave count, which has been contradicting your gold prediction for quite a while…
I do plan on doing that today.
Contradicting it may be, but you must acknowledge that Gold and Silver do not always bottom (or top) together.
I have no problem with seeing Silver move sideways while Gold moves lower. In fact, look at the historical record back to the 1970’s and you will see that Silver has several times found its low before Gold. That is what I expect may happen again here.
I believe you wrong I mean you right that it will go to 1200 – 1180 zone however once it will get there it will finish forming a Descending Triangle by that rule Descending triangle must have at least 2 bottoms yes it could go back up to the upper line of the triangle however it can’t go above it and your target is 1400 that will invalidate triangle Thus the next target after 1180 is 1430 – 1180 = 250 so to calculate next target we need to 1180 – 250 which is low 900$ and that will conclude major 5th wave down and 62% retracement which is also shown on my monthly gold chart.