
I expect that Gold has finished this correction and should break out of the range in which it has been trading for the last 23 days. I expect to see downwards movement next week. Friday’s price action has necessitated a reanalysis of recent movement and the wave count is changed.
Summary: The target for downwards movement to end is 1,190. Movement below 1,273.43 to a new low would provide confidence that the downwards trend has resumed.
This analysis is published about 12:30 a.m. EST. Click on charts to enlarge.
Main Wave Count.
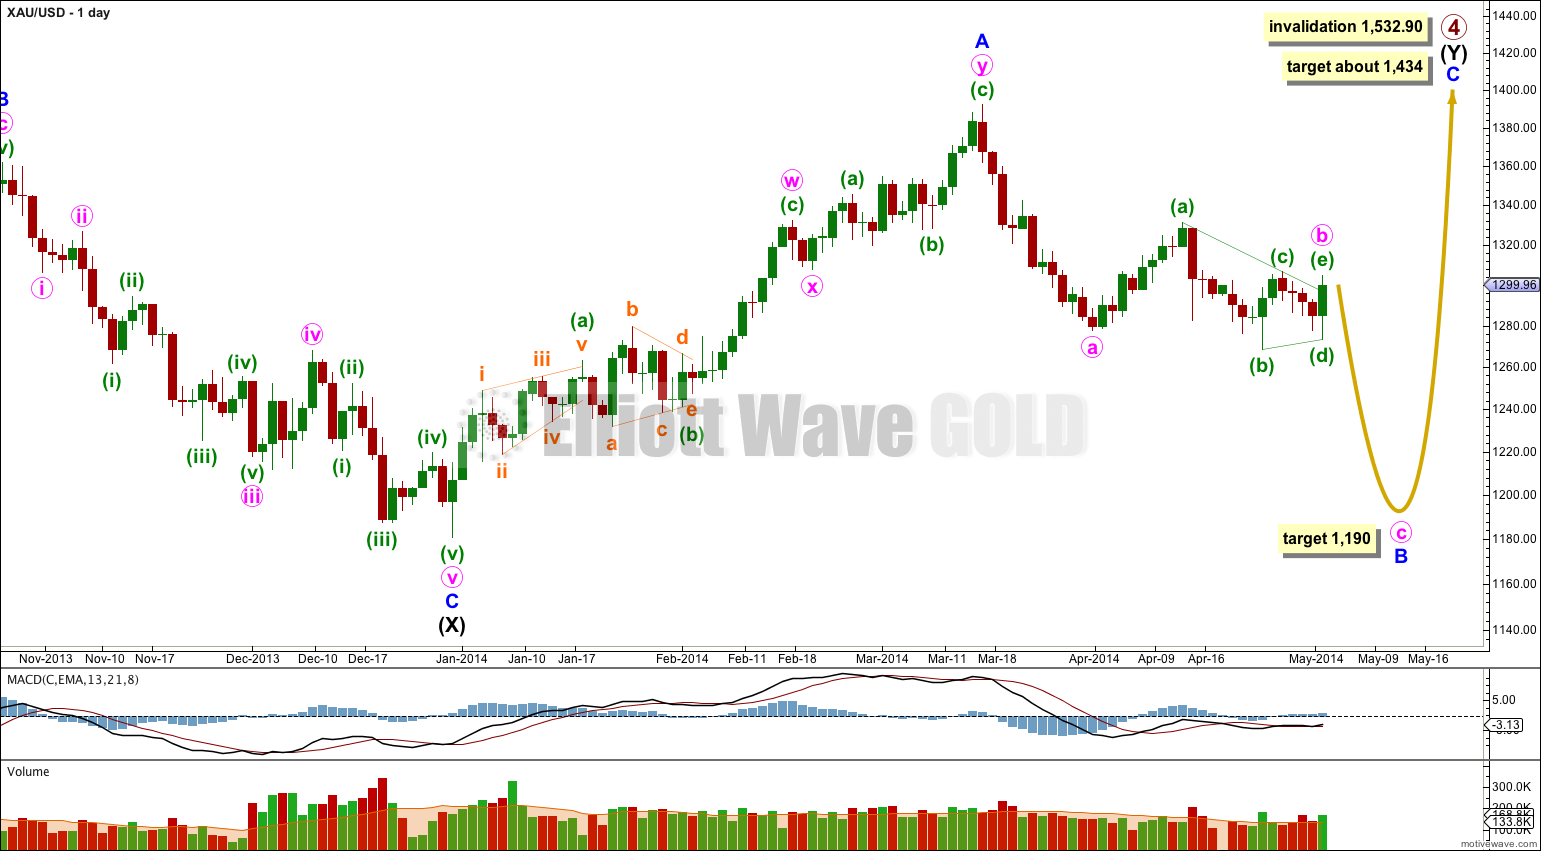
Gold is still within a large fourth wave correction at primary wave degree which is incomplete.
Primary wave 2 was a rare running flat. Primary wave 4 is unlikely to be a flat correction because it is likely to show structural alternation with primary wave 2.
Primary wave 4 is most likely to be completing as a double combination: zigzag – X – second structure. The second structure labeled intermediate wave (Y) is most likely to be a flat correction. Within the flat correction minor wave B must reach a minimum 90% the length of minor wave A at 1,201.98.
Overall the structure for primary wave 4 should take up time and move price sideways, and the second structure should end about the same level as the first at 1,434. Primary wave 4 may not move into primary wave 1 price territory. This wave count is invalidated with movement above 1,532.90.
Within intermediate wave (Y) minor wave B downwards is an incomplete corrective structure, and at this stage the structure fits best as an incomplete single zigzag. Minor wave B should continue for a few more days and may make a new low below 1,180, and is reasonably likely to do so in coming weeks. So far minor wave B has lasted a Fibonacci 34 days. It it continues for a Fibonacci 21 days it may total a Fibonacci 55 days.
At 1,190 minute wave c would reach equality in length with minute wave a, and minor wave B would be longer than 90% the length of minor wave A.
Of all the possibilities I have considered for price movement during the last 14 days, this wave count has a good fit and the best overall look.
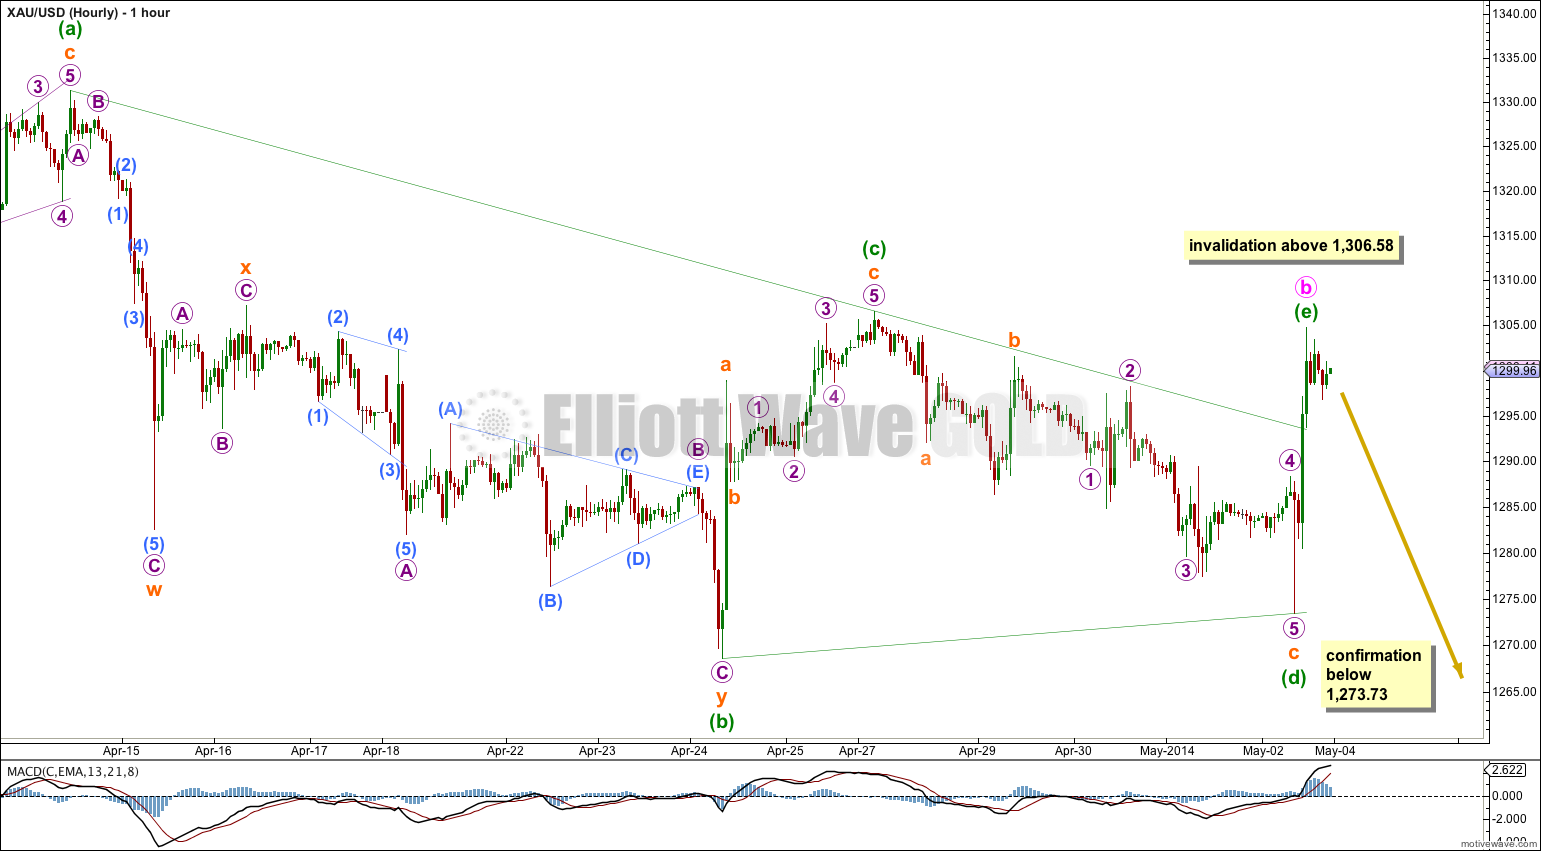
If minor wave B downwards is unfolding as a single zigzag then minute wave a within it must be seen as a five wave impulse. This is possible.
Within the zigzag minute wave b may now be a complete running contracting triangle. Within the triangle minuette wave (e) has overshot the A-C trend line. E waves most commonly undershoot the A-C trend line, but sometimes they do overshoot this trend line. This gives the wave count a reasonably typical look.
Most importantly the A-C and B-D trend lines both clearly slope, and this gives the possible triangle the right look.
My only concern with this wave count today is the sideways movement at the end of Friday’s session because normally when triangles complete they are followed by very sharp movement out of them. For this reason I will consider the alternate ideas below.
If price moves lower from here then this wave count would be my only wave count. A new low below 1,273.73 would provide confidence in a trend change at minute degree.
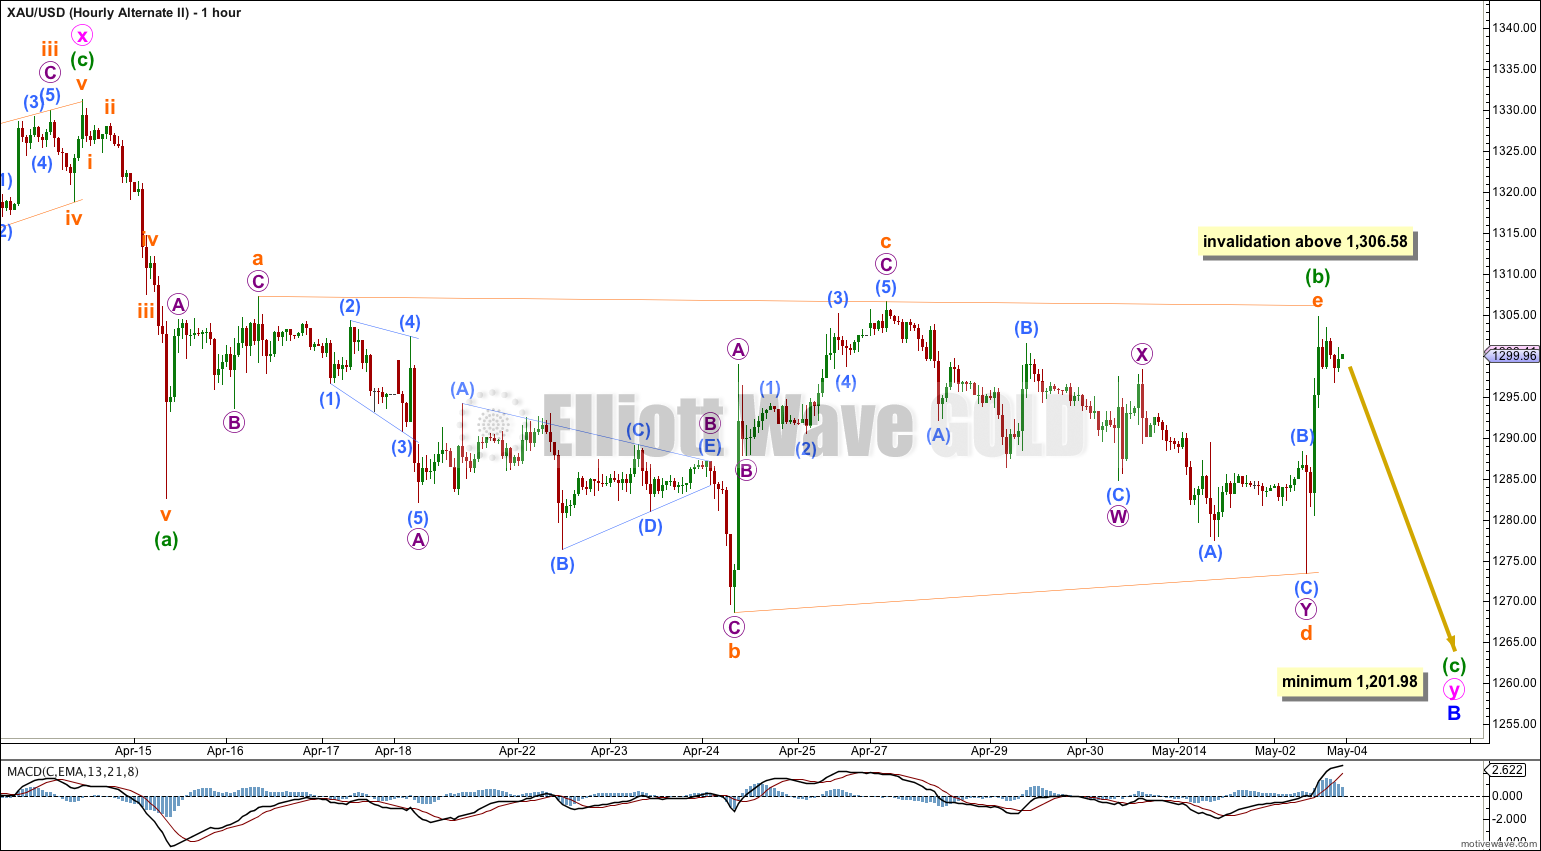
The triangle is invalidated with movement above 1,306.58; minuette wave (e) may not move beyond the end of minuette wave (c).
Alternate Wave Count.
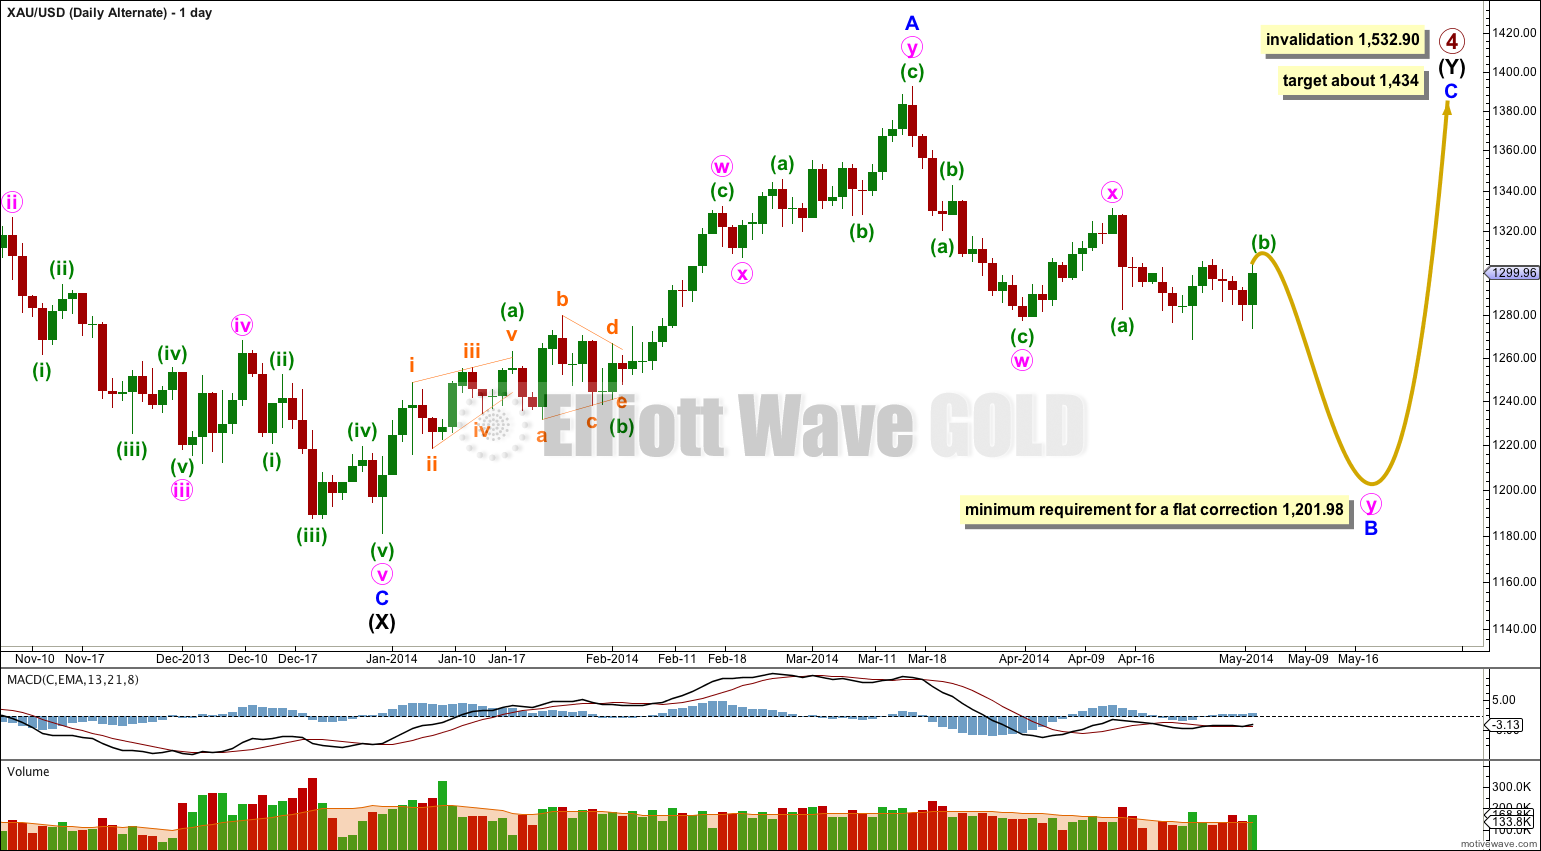
This wave count was previously the main wave count. It sees minor wave B downwards as a double zigzag.
The problem with this wave count at this stage is the structure of minuette wave (b) because it does not subdivide into any typical looking corrective structure. All the possibilities I have considered have serious problems which reduce their probability.
I will consider two possibilities for minuette wave (b) below.
If minuette wave (b) is a double combination then the first structure within the double is a very rare running flat. The depth of micro wave B within subminuette wave w significantly reduces the probability of this wave count.
The double combination would be incomplete. Subminuette wave y should unfold as a zigzag and should move price higher.
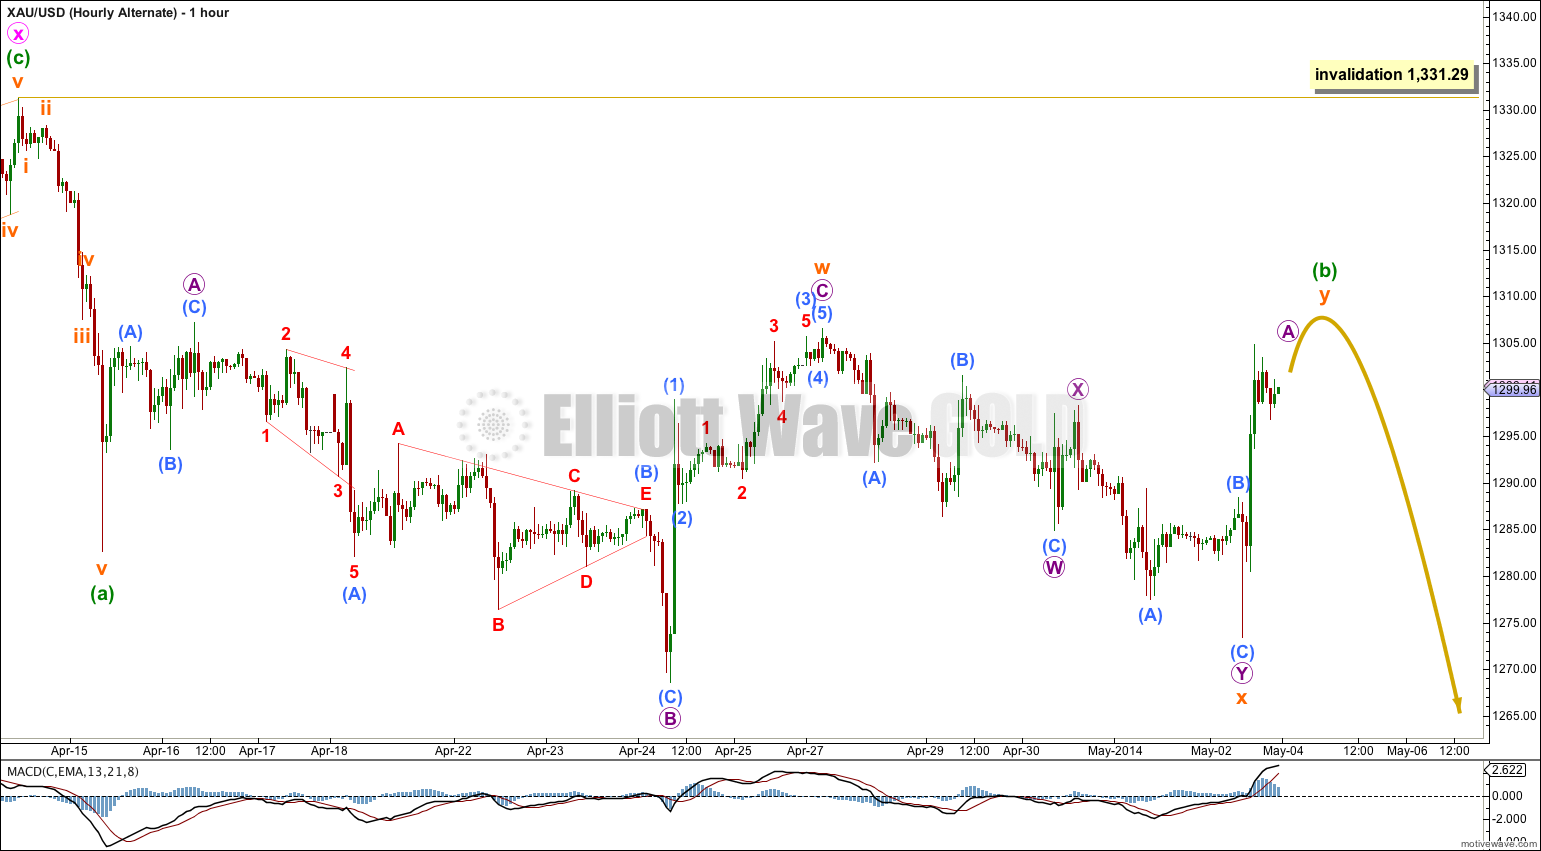
If the main wave count is invalidated by upwards movement then I would consider this alternate.
Minuette wave (b) may not move beyond the start of minuette wave (a) above 1,331.29.
In considering all possibilities for minuette wave (b) the only idea which fits all the subdivisions is a contracting running triangle. This is an idea I have considered before.
The problem with this idea remains the A-C trend line. For a contracting triangle the A-C trend line should clearly slope, but in this case it is almost flat. This is not a barrier triangle as they have B-D trend lines which are flat and A-C trend lines slope.
This triangle does not have the “right look” and this reduces the probability of this alternate wave count.
Gold just exceeded the INVALIDATION point with movement above $1306.58.
Gold just hit a high of $1,309.57 at 21:00 EST, May 4th.
The hourly alternate chart may apply and it has no upper limit although the chart does look like gold would end around $1,308. We get clarification tonight.
There is an invalidation point. But it’s too far away to be useful. At 1,392.30.