Price has moved sideways which fits both wave counts for Silver. I am today swapping over my main and alternate wave counts for Silver to be in line with what I expect to see for Gold. However, the alternate wave count below could still be correct.
Silver made a new low of 18.581 on 30th April, 2014, Gold did not. Silver and Gold do not always turn at the same time, and their highs and lows are sometimes separate in time. It seems that Silver often leads Gold and may be doing so again.
Click on charts to enlarge.
Main Wave Count.
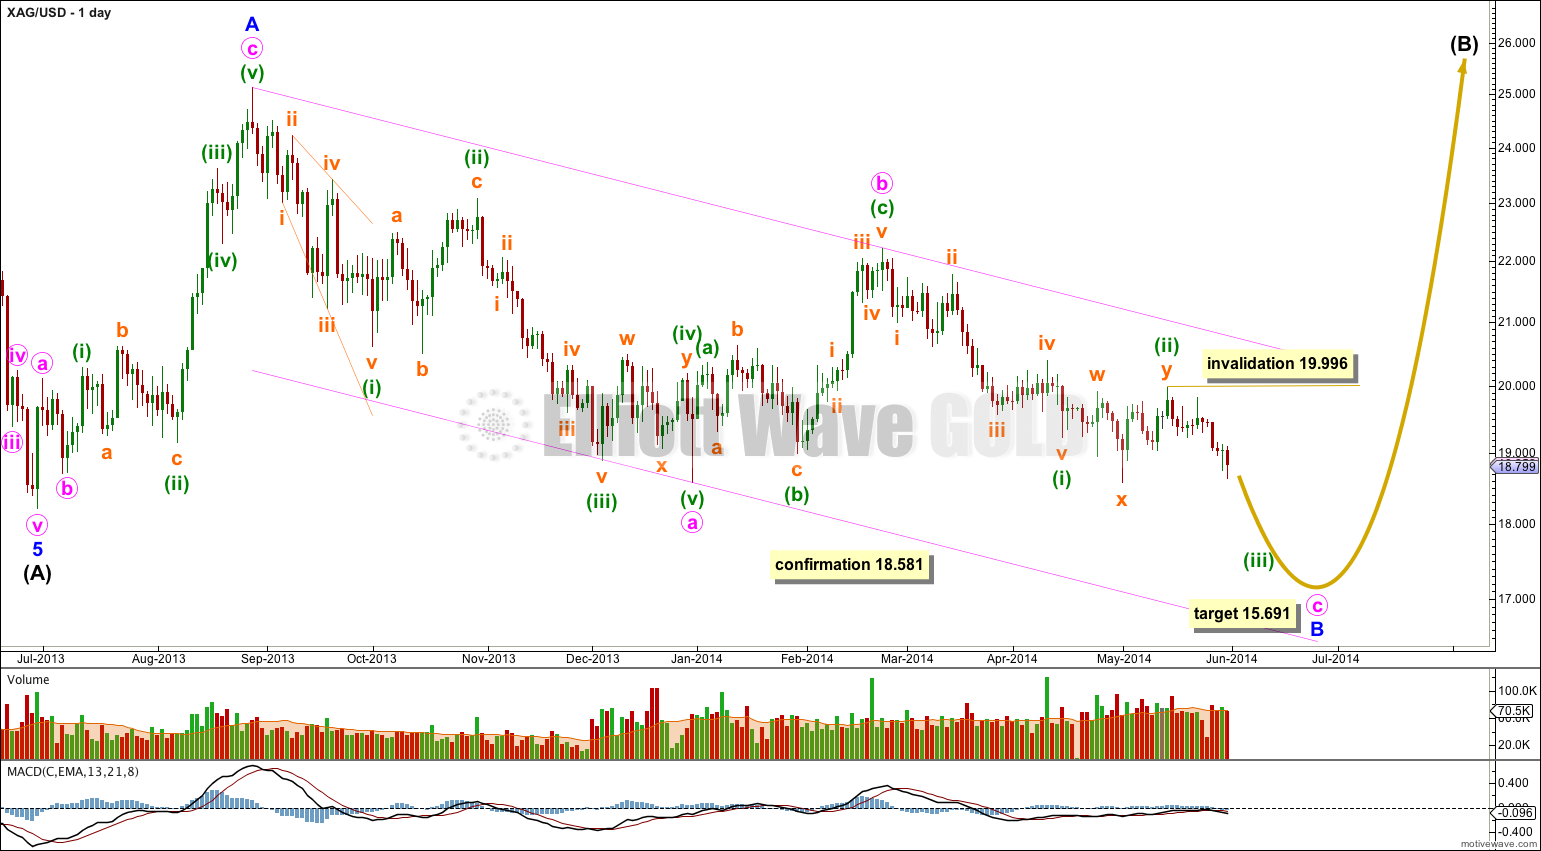
Silver is within an intermediate degree (B) wave. Unfortunately, B waves are the most difficult of all Elliott wave structures to analyse because they have the widest variety. There are more than thirteen possible structures this B wave may take and so flexibility in analysis is essential.
Intermediate wave (B) may be an incomplete flat correction.
Within the flat minor wave A subdivides as a three wave zigzag.
Minor wave B downwards may be an incomplete zigzag.
Within the zigzag of minor wave B minute waves a and b are complete. Minute wave c would be an incomplete impulse.
The target for downwards movement to end is at 15.691 where minute wave c would reach equality in length with minute wave a.
If price moves below 18.581 in the next few days then this wave count would be confirmed.
This wave count expects to see an increase in downwards momentum as a third wave unfolds.
Price should find support and resistance at the pink trend lines about minor wave B on the way down.
Within minute wave c minuette wave (ii) may not move beyond the start of minuette wave (i) above 22.224.
Alternate Wave Count.
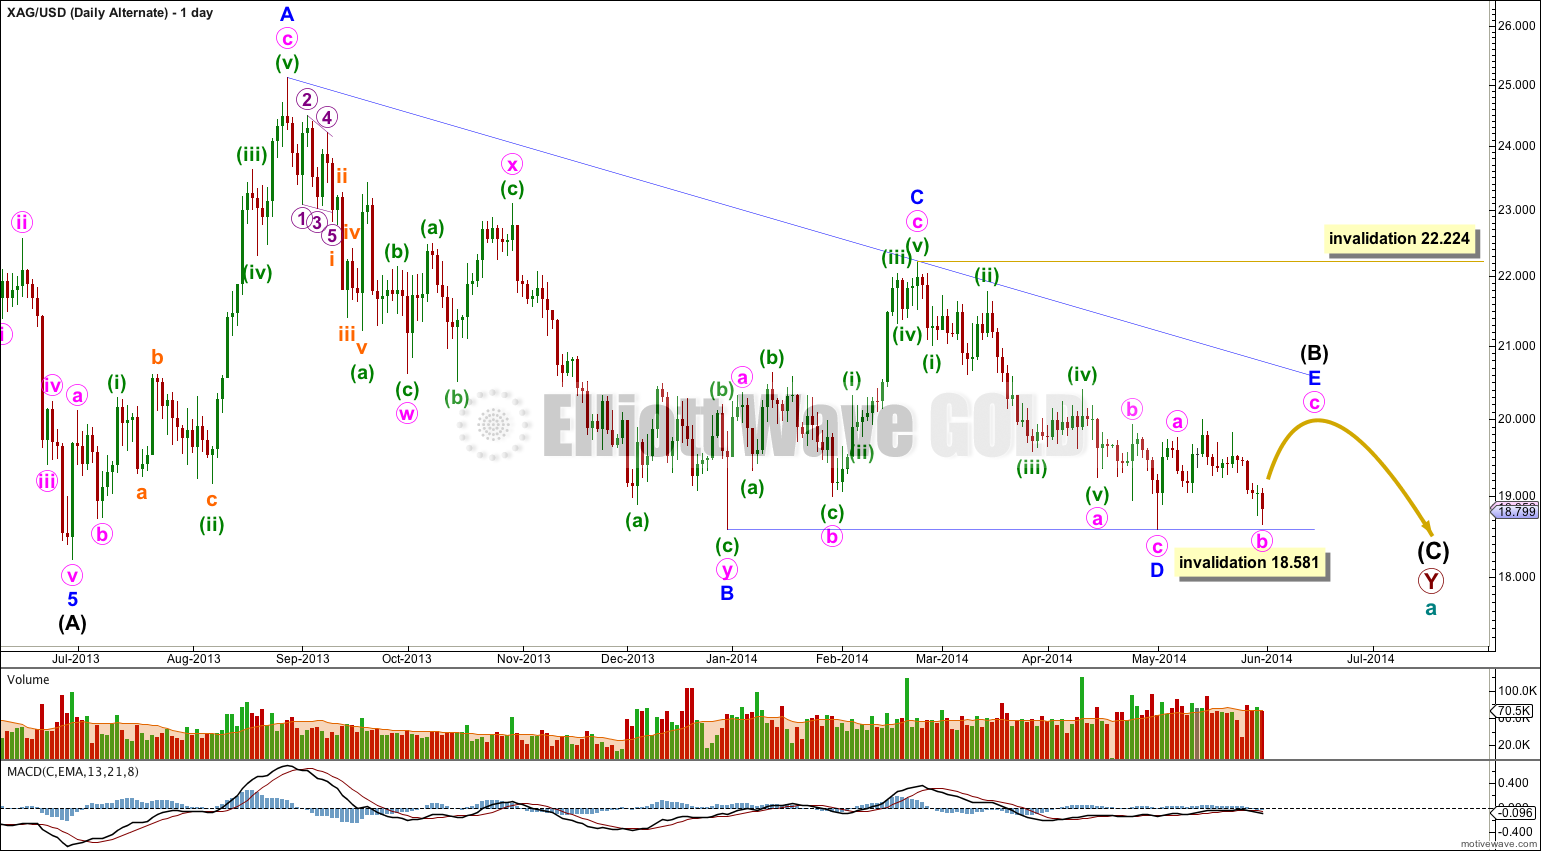
A triangle may be forming at the daily chart level. The triangle fits best as a barrier triangle for intermediate wave (B). The B-D trend line is almost perfectly flat.
This wave count expects more choppy overlapping sideways movement with a decrease in volume, and momentum remaining close to zero, for about another two or three weeks.
Within the barrier triangle minor wave D may not move substantially below the end of minor wave B. As long as the B-D trend line remains flat this wave count will remain valid.
Minor wave E should subdivide as a single zigzag and may not move above the end of minor wave C at 22.224.
This alternate wave count expects price to break out to the downside once the sideways structure is complete. This breakout may yet be weeks away. Minor wave E is incomplete, and it has not taken enough time nor moved high enough at this stage to look right.


“This alternate wave count expects price to break out to the downside once the sideways structure is complete. This breakout may yet be weeks away. ”
Lara, could you give an estimate on the downside target? I see downside target for primary daily chart is 15.691, can you give an estimate for alternate downside target?
It may be met in several days to about three weeks.
Lara, sorry if my question was not clear–what is the price target? Price target for primary daily is 15.691, what is price target for alternate daily ?