
To see a monthly chart see one analysis prior.
Click charts to enlarge.
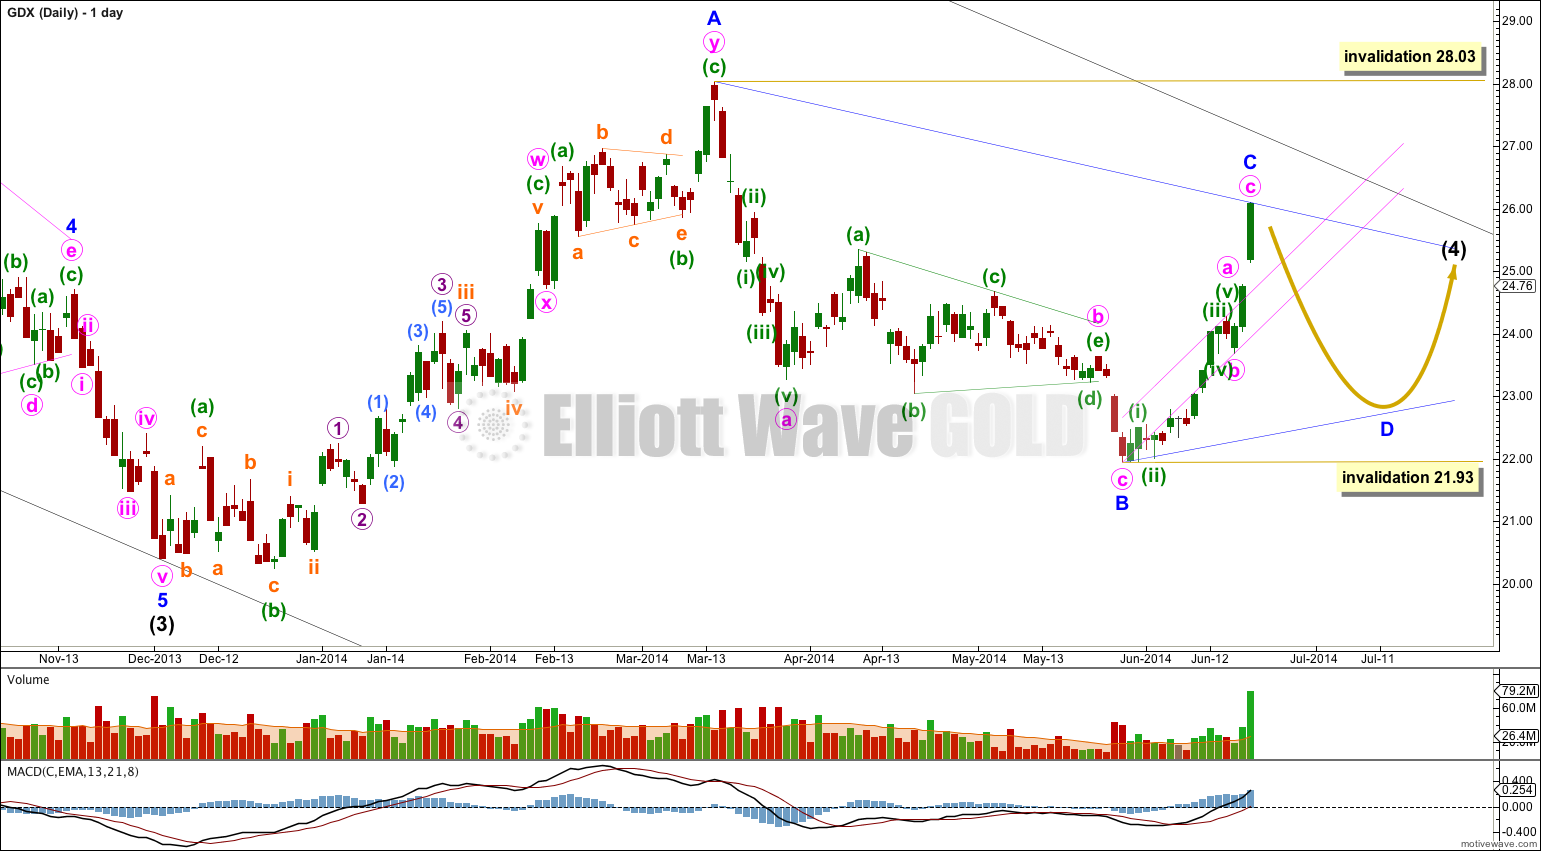
Within this triangle structure for intermediate wave (4) minor wave C may now be complete. Within minor wave C minute wave c is $8 short of equality in length with minute wave a. Minute wave c could move higher, and if it does by about $8 then this ratio would be improved. If the next candlestick is red I would have some confidence that minor wave C is over.
When the narrow pink channel about minor wave C is breached to the downside I would have full confidence that minor wave C is over.
Minor wave D downwards may not move beyond the start of minor wave B at 21.93. However, for a barrier triangle minor wave D may end about the same level as minor wave B, as long as the B-D trend line is essentially flat. In practice this means that minor wave D may end slightly below 21.93 and so this lower invalidation point is not black and white.
Minor wave D may last about three weeks, and it could be more time consuming than this. It depends on how long the B wave within it lasts.
Minor wave E would most likely fall short of the A-C trend line.
The whole triangle for intermediate wave (4) may find resistance, and may end, at the upper edge of the black channel which is here copied over from the monthly chart.
In summary I am expecting several more weeks of choppy overlapping range bound movement from GDX. When that is done price should break out to the downside for intermediate wave (5).
“Within minor wave C minute wave c is $8 short of equality in length with minute wave a. Minute wave c could move higher, and if it does by about $8 then this ratio would be improved. ”
Lara is $8 correct? That seems a huge move in price.
I’m so sorry!
No.
I’m forgetting to move my decimal place. Motive Wave displays the wave length as 250 when it is $2.50.
Do the difference is actually 8 cents, not 8 dollars.
It’s ok, was just wondering if I had gone off track. Thanks
“Within minor wave C minute wave c is $8 short of equality in length with minute wave a. Minute wave c could move higher, and if it does by about $8 then this ratio would be improved.”
Lara, is this $8 figure correct? That would put gdx at about 33.