Yesterday’s analysis expected more downwards movement to complete a correction, and I had expected it to end within 24 hours. This is not what happened. The correction is continuing and is longer in duration than expected.
Summary: The correction is incomplete. I expect choppy overlapping movement for another one or two days, and one more downwards wave of about $27 in length to complete the correction.
Click on charts to enlarge.
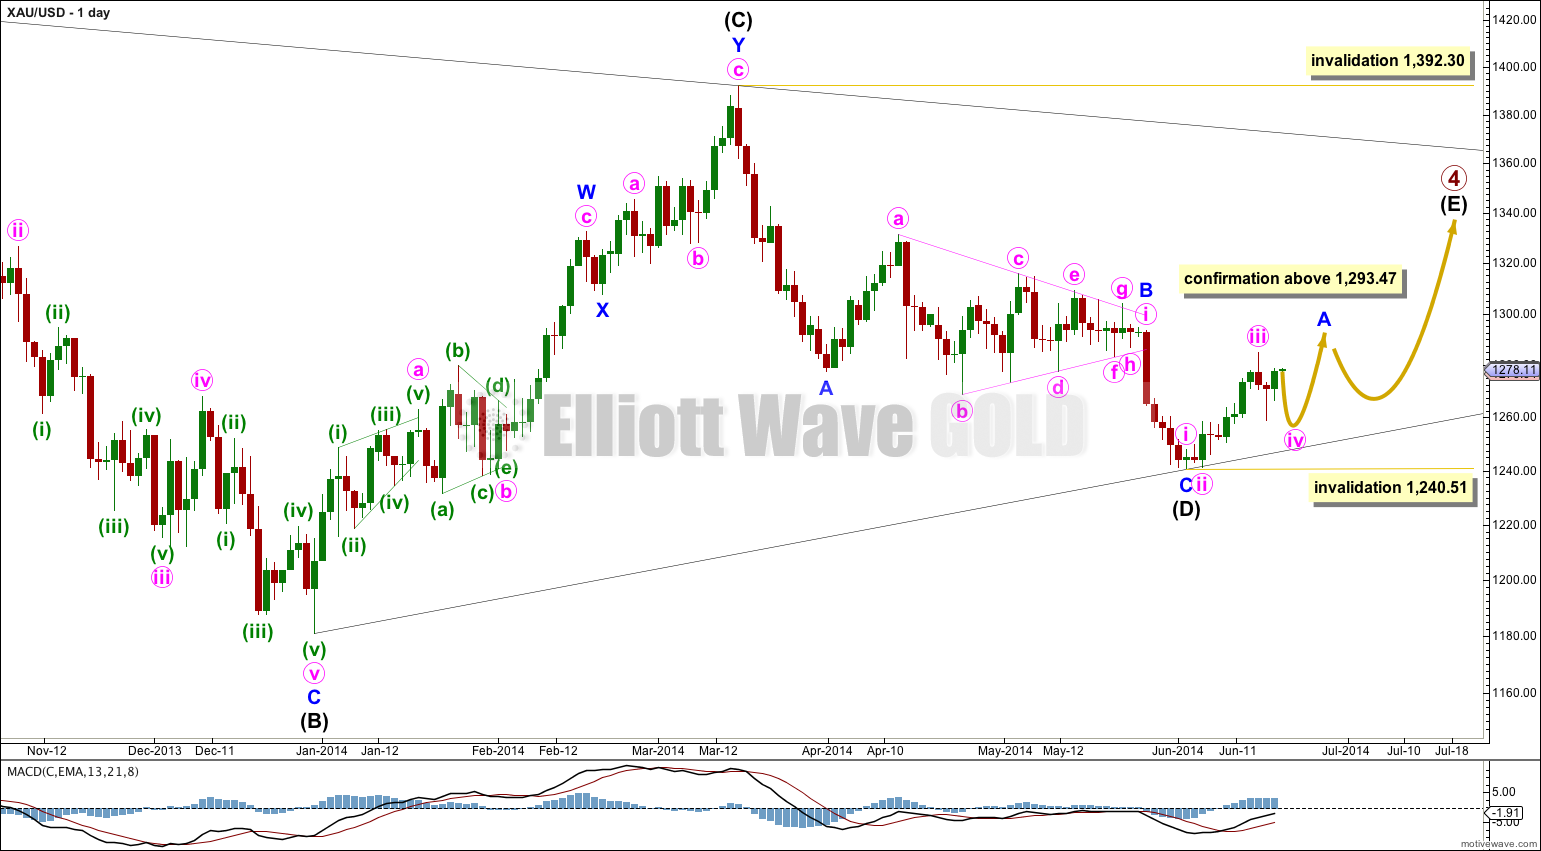
Gold is still within a large fourth wave correction at primary wave degree which is incomplete.
Primary wave 2 was a rare running flat. Primary wave 4 is unlikely to be a flat correction because it is likely to show structural alternation with primary wave 2.
This wave count expects primary wave 4 is a huge triangle. The triangle is now within the final wave of intermediate wave (E) which should subdivide as a zigzag.
Intermediate wave (E) is most likely to be time consuming and fall short of the (A) – (C) trend line. It may also overshoot this trend line, but that is less common.
Within the zigzag of intermediate wave (E) minor wave B may not move beyond the start of minor wave A at 1,240.51.
So far within primary wave 4 intermediate wave (A) lasted 43 days, intermediate wave (B) lasted 88 days, intermediate wave (C) lasted 53 days and intermediate wave (D) lasted 56 days. Intermediate wave (E) may last a total of about 43 to 56 days. So far it has only lasted 10 days.
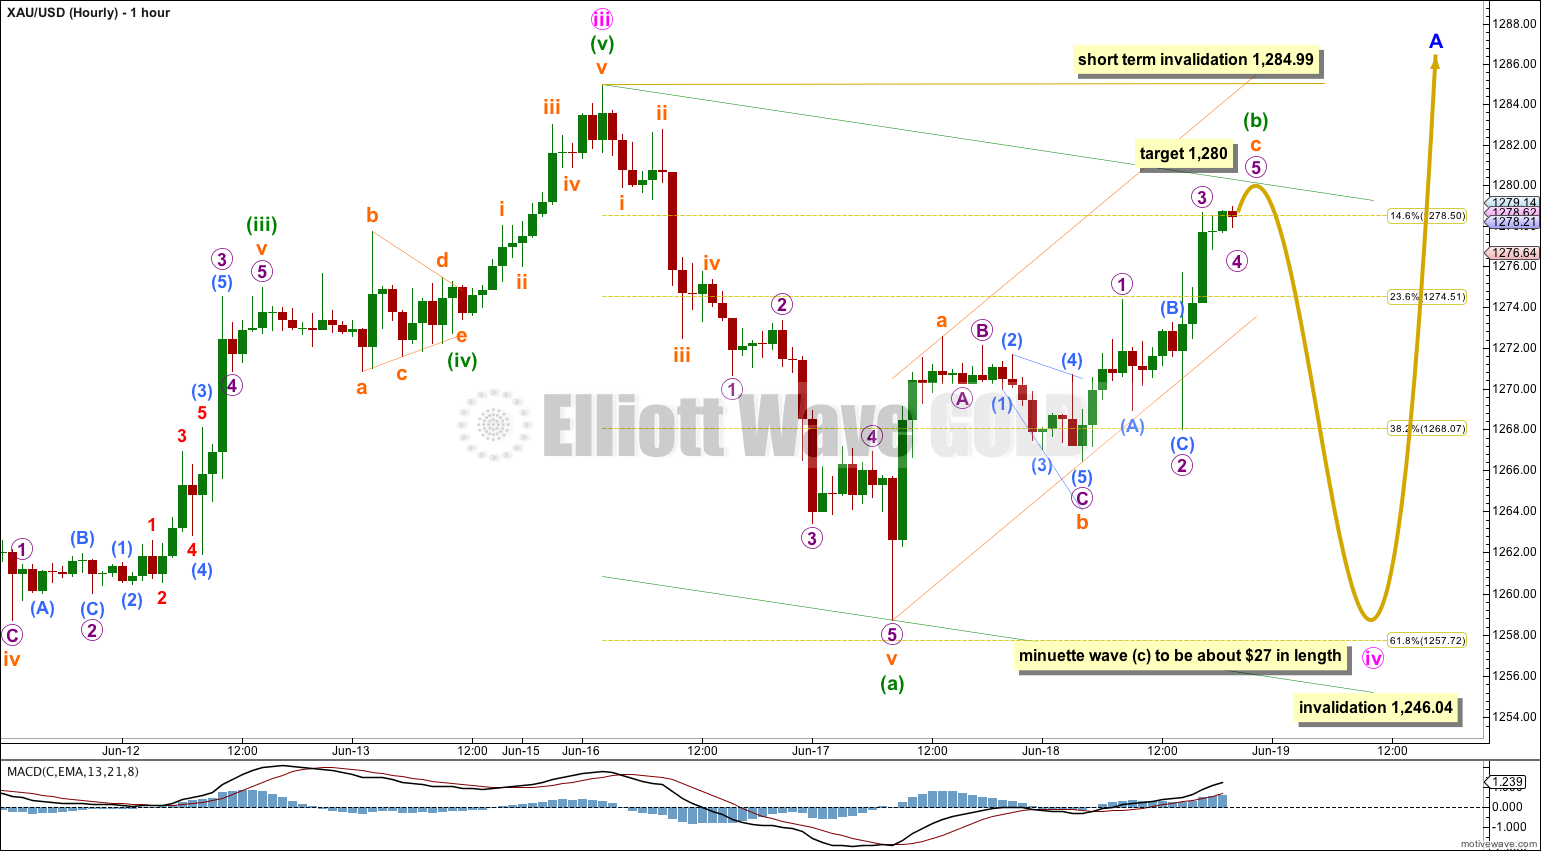
Minute wave iv is still incomplete. Minuette wave (b) within it moved higher. Because minuette wave (a) subdivides as a five minuette wave (b) may not move beyond its start above 1,284.99.
Minuette wave (b) is subdividing as a zigzag, and it is incomplete. At 1,280 subminuette wave c would reach equality in length with subminuette wave a.
I have drawn a small channel about minuette wave (b) (upwards sloping orange channel). When this channel is breached by at least one full hourly candlestick below it and not touching the lower trend line then I would have confidence that minuette wave (b) is over and minuette wave (c) downwards has begun.
Minuette wave (c) downwards must subdivide as a five wave structure and would most likely be equal in length with minuette wave (a) at $27. When we know where minuette wave (b) has ended then we may calculate a target for minuette wave (c) to end based upon the length of minuette wave (a). If this target calculation gives a price point close to the 0.618 Fibonacci ratio at 1,257.72 it would have an increased probability.
Minute wave ii on the daily chart lasted two days and so far minute wave iv is into its third day. If it ends in a total of three or four days it will still be reasonably in proportion to minute wave ii.
Minute wave iv may not move into minute wave i price territory below 1,246.04. If this invalidation point is breached (even by the smallest fraction) I would use the alternate below.
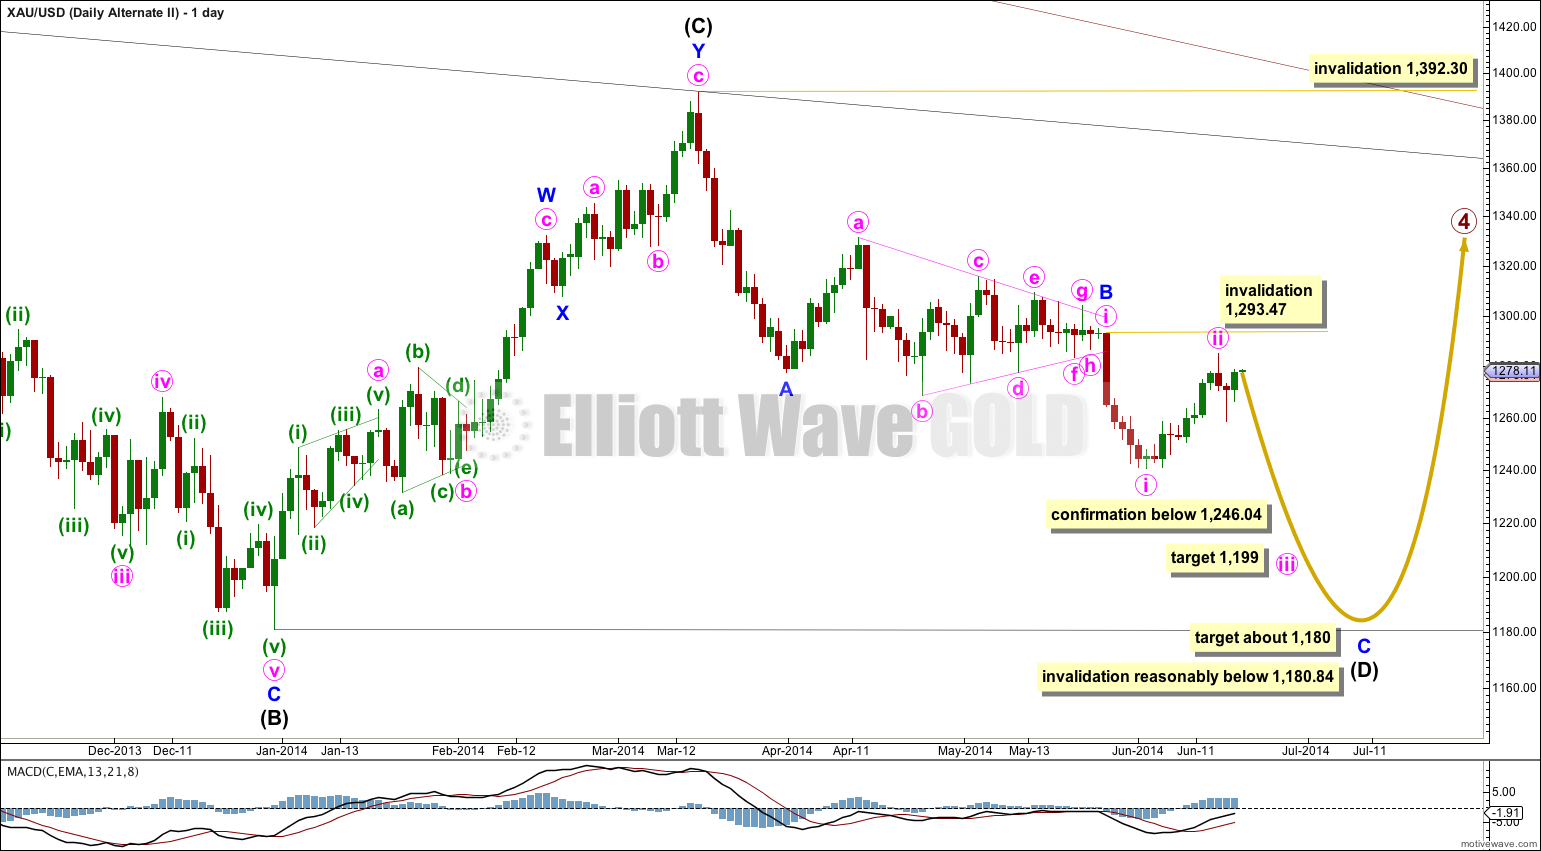
Alternate Daily Wave Count.
It remains possible that primary wave 4 is a barrier triangle and that within it intermediate wave (D) is incomplete and would take price lower.
This wave count has a low probability. I am only publishing it today in response to a member’s question.
Elliott wave structures on Gold charts almost always have a very typical look, this is more true for Gold than for any other market I have ever analysed, and is probably the result of the huge global volume of this market. However, while Golds structures almost always have a very typical look they do not always have a typical look. For example, within minor wave A downwards the second wave correction for minute wave ii did not show up on the daily chart and was too brief. This is quite unusual for Gold and gives minor wave A downwards a three wave look on the daily chart, where I think on the hourly chart it fits best as a five with almost perfect Fibonacci ratios.
Looking back at Gold for the last couple of years its second and fourth wave corrections at minute and minuette wave degrees almost always show on the daily chart and are almost always shorter in duration than its actionary waves (waves 1, 3, 5).
Here minute wave ii is typically deep, but it is comfortably longer in duration at nine days compared to minute wave i at five days. This gives this piece of the wave count an atypical look and in my judgement gives this idea a very low probability. I would only use this wave count if it was confirmed with movement below 1,246.04.
If this wave count is confirmed then a third wave down would be unfolding. At 1,199 minute wave iii would reach 1.618 the length of minute wave i.
If intermediate wave (D) ends about 1,180.84 and the (B) – (D) trend line is essentially flat then primary wave 4 would be a huge barrier triangle. Only movement far enough below 1,180.84 to cause the (B) – (D) trend line to clearly slope downwards would invalidate the triangle. If that happened then it would also be possible that primary wave 4 is not a triangle but is a combination, which was a prior wave count.
This analysis is published about 09:02 p.m. EST.


I think all these scenarious are incorrect. We’re in a motive wave that started at the beginning of January. On your all time historical chart for Gold, you assumed that wave 5 was over. It may not be over. On the monthly chart, Sept 2011 may be the top of only the 3rd wave, and in January this year, wave 5 began as wave 4 ended.
Okay, I know I’ve had a horrible week and been wrong too many times. But I’m not going to consider that idea because there are just way too many problems with it in terms of subdivisions.
One day of strong upwards movement is not enough to change the wave count at super cycle degree.
With the main count invalidated to the upside, may we now expect minute wave (ii) of the alternate count?
No, the alternate wave count was invalidated firmly and fully with movement above 1,293.47.
The main wave count triangle for primary wave 4 looks very typical.