
Sideways movement and a small green candlestick for Tuesday’s session fits yesterday’s alternate wave count nicely. This will now be my only wave count and I can calculate a target for you.
The mid and long term pictures remain exactly the same.
Summary: In the short term I expect some upwards movement to end about 1,258 to 1,261. This may produce another green candlestick on the daily chart for Wednesday. Thereafter, I am expecting a resumption of the downwards trend with an increase in momentum as a third wave unfolds.
This analysis is published about 08:24 p.m. EST. Click on charts to enlarge.
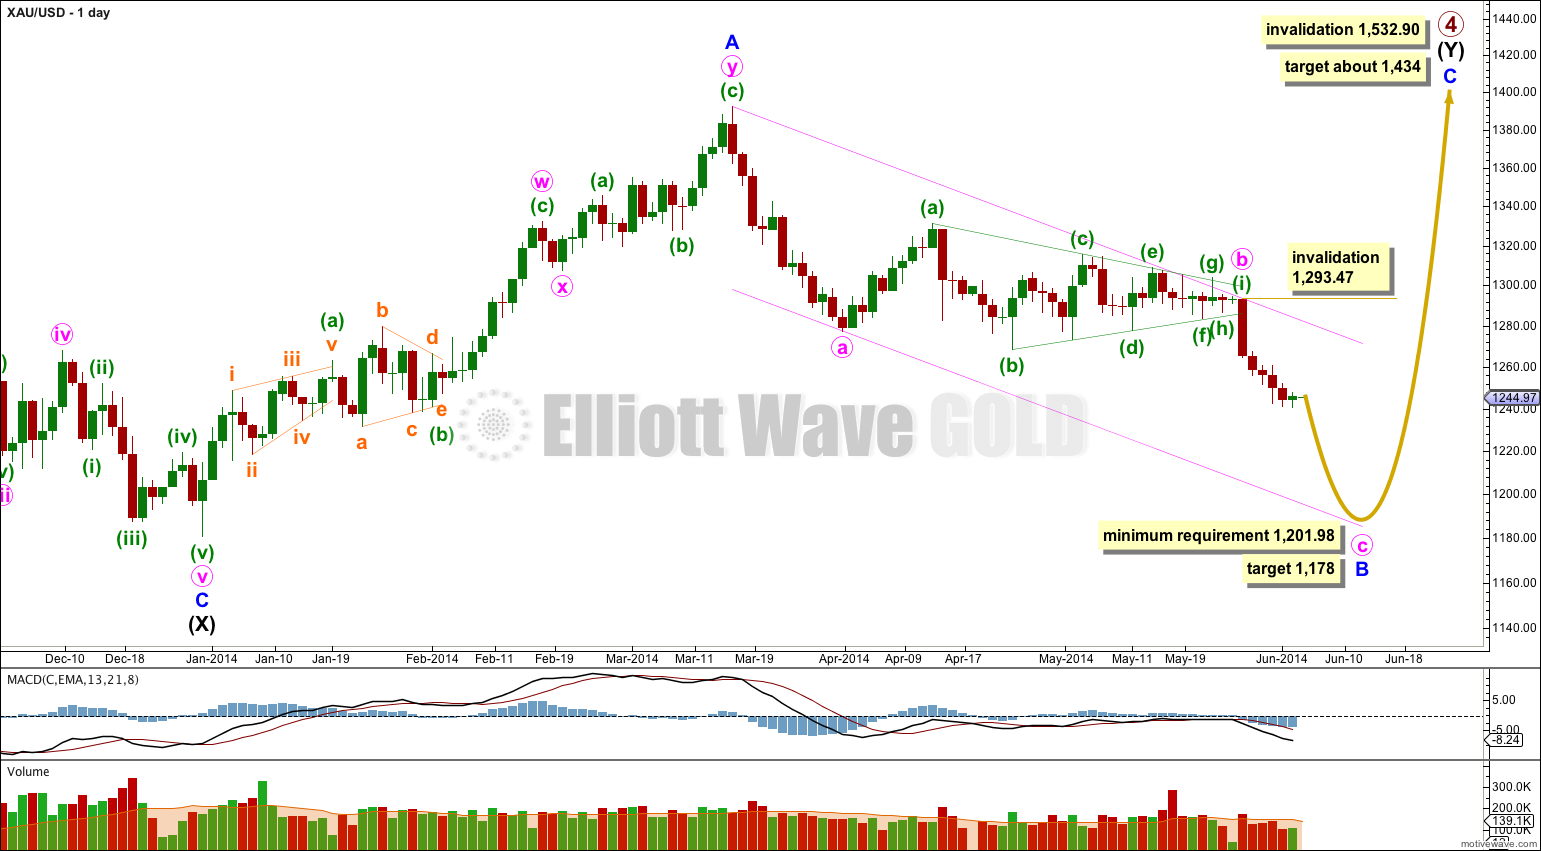
Gold is still within a large fourth wave correction at primary wave degree which is incomplete.
Primary wave 2 was a rare running flat. Primary wave 4 is unlikely to be a flat correction because it is likely to show structural alternation with primary wave 2.
Primary wave 4 is most likely to be completing as a double combination: zigzag – X – second structure. The second structure labeled intermediate wave (Y) is most likely to be a flat correction. Within the flat correction minor wave B must reach a minimum 90% the length of minor wave A at 1,201.98.
If downwards movement does not reach 1,201.98 or below then intermediate wave (Y) may not be a flat correction and may be a contracting triangle. I will keep this alternate possibility in mind as this next wave down unfolds. If it looks like a triangle may be forming I will again chart that possibility for you.
It remains possible that primary wave 4 in its entirety is a huge contracting triangle. I will again publish this idea daily for you.
Overall a double combination for primary wave 4 should take up time and move price sideways, and the second structure should end about the same level as the first at 1,434. Primary wave 4 may not move into primary wave 1 price territory. This wave count is invalidated with movement above 1,532.90.
Within intermediate wave (Y) minor wave B downwards is an incomplete corrective structure, and at this stage the structure is most likely to be a single zigzag with a nine wave triangle for minute wave b. At 1,178 minute wave c would reach equality in length with minute wave a. This would see minor wave B 101% the length of minor wave A and so intermediate wave (Y) would be a regular flat correction. If minute wave c also shows equality with minute wave a in duration they both may last 11 days. So far minute wave c has lasted only seven days.
I have drawn a channel about minor wave B downwards: draw the first trend line from the start of minute wave a to the end of minute wave b, then place a parallel copy upon the end of minute wave a. I will expect downward movement to find support at the lower end of this channel due to this being the most common place for minute wave c to end.
Within minute wave c no second wave correction may move beyond the start of its first wave above 1,293.47.
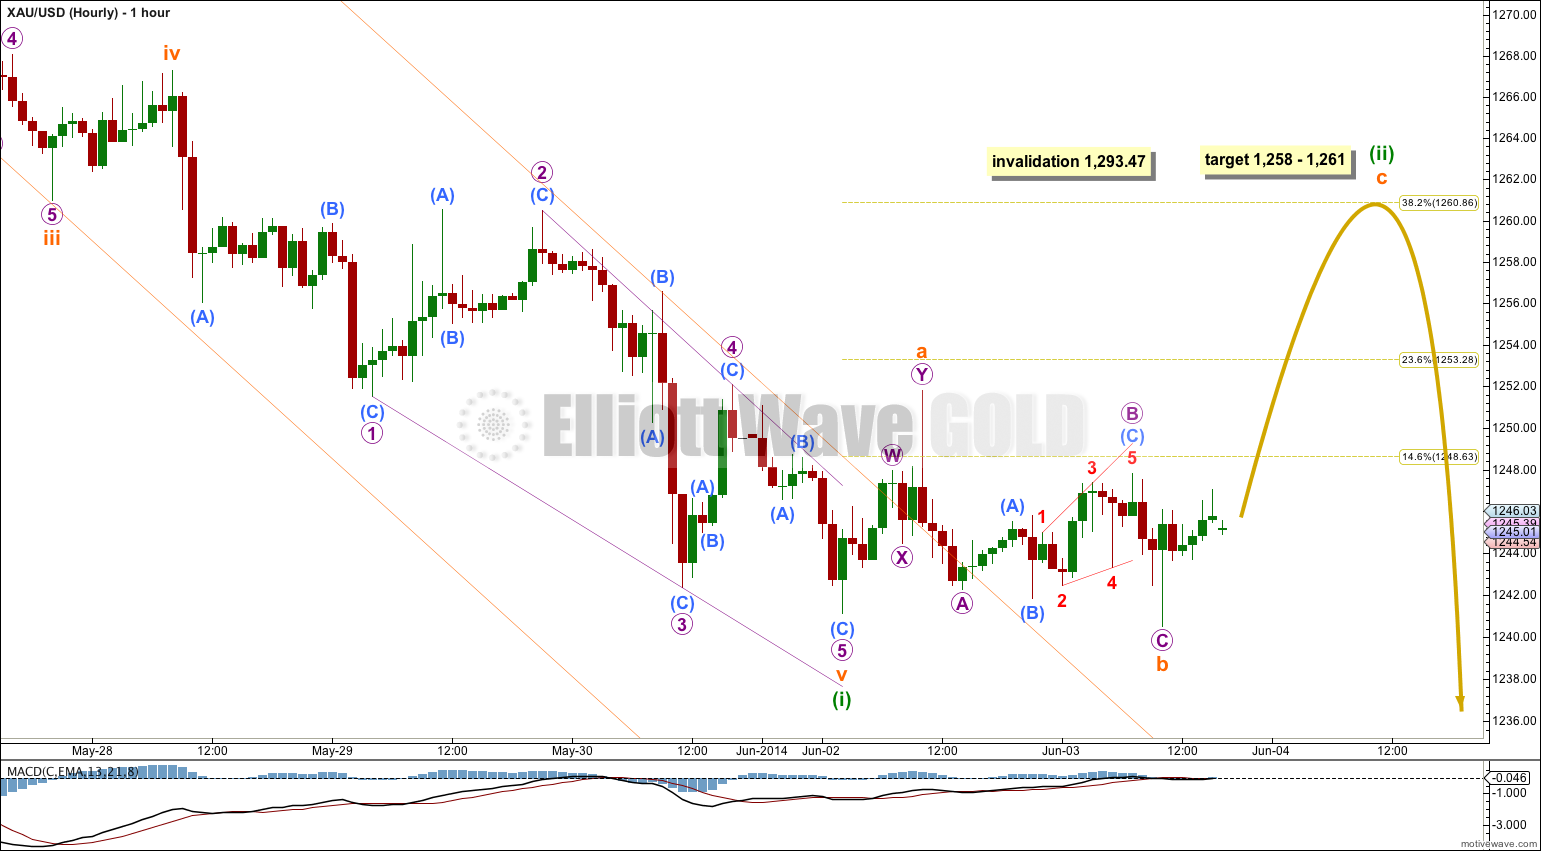
Although sideways movement did not break above 1,251.82 I am discarding yesterday’s main hourly wave count in favour of this wave count. This sideways movement is extremely unlikely to be a continuing series of first and second waves and is most likely to be the second wave correction which I had expected last week.
Minuette wave (ii) may be unfolding as an expanded flat correction. Within it subminuette wave b is just over 105% the length of subminuette wave a, the minimum requirement for an expanded flat. Expanded flat corrections often have C waves which are 1.618 the length of their A waves. At 1,258 subminuette wave c would reach 1.618 the length of subminuette wave a. This is just below the 0.382 Fibonacci ratio of minuette wave (i) at 1,261.
Subminuette wave c upwards may last about one day, and may complete a green candlestick on the daily chart.
When minuette wave (ii) is complete then I can calculate a target for minuette wave (iii) downwards for you. It should show a strong increase in downwards momentum.
Minuette wave (ii) may not move beyond the start of minuette wave (i) above 1,293.47.
Daily – Triangle.
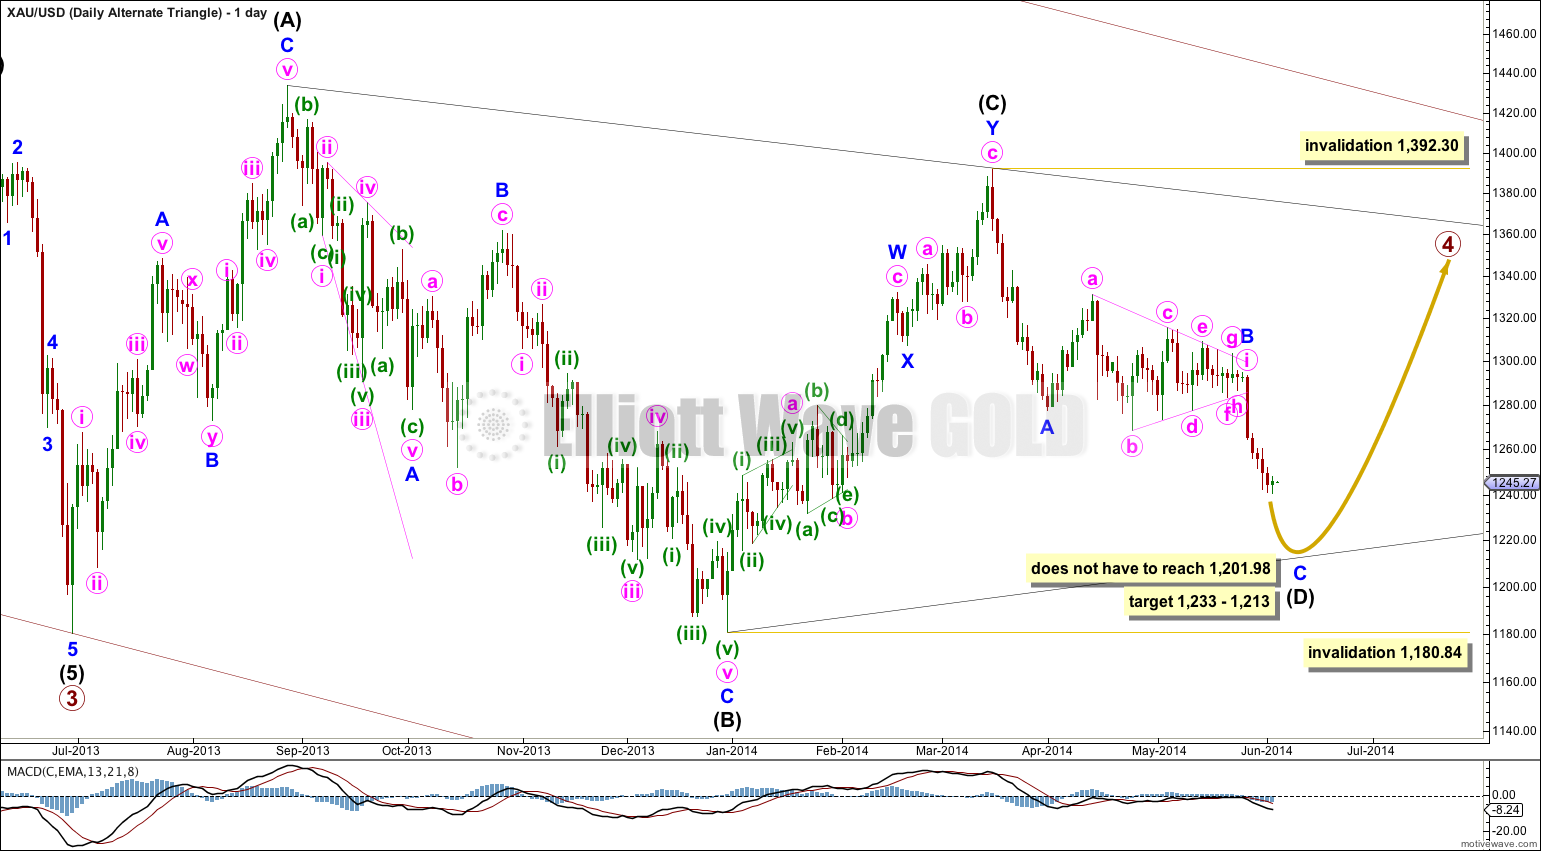
It remains possible that primary wave 4 in its entirety is a huge regular contracting triangle.
So far one of the five subwaves of the triangle subdivides into a double zigzag. All the other four subwaves must then be simple corrections, and three of them must be single zigzags. The fourth may be another type of simple A-B-C correction, and most commonly it would also be a zigzag.
Intermediate wave (D) would most likely be incomplete for the triangle to have a typical look. Intermediate wave (D) may end between 1,233 and 1,213, 75% to 85% the length of intermediate wave (C), which in my experience is a typical wave length for a triangle subwave.
Intermediate wave (D) may not move beyond the end of intermediate wave (B) for a contracting triangle. For a barrier triangle intermediate wave (D) may end about the same level as intermediate wave (B) as long as the B-D trend line remains essentially flat. In practice this means that intermediate wave (D) may end very slightly below the end of intermediate wave (B). This lower invalidation point is not black and white. This is the only Elliott wave rule which is not black and white.
Intermediate wave (E) may not move beyond the end of intermediate wave (C) for either a contracting or barrier triangle.
Hi Lara-
Have you considered the possibility we are in a 4th wave sideways correction of c and one more lower low near 1230-1236 could complete the structure and validate the Primary 4 triangle?
This sideways movement looks more like a 4th wave correction and would be in proportion to the 2nd wave if you disregard the nine wave triangle and make it a 5 wave triangle.
Kind of. I am considering the nature of this correction as it unfolds. It looks like it may be a triangle.
But it does not fit as a fourth wave. Where would the counterpart second wave be? They should be somewhat in proportion to have the “right look”.
I am considering this current correction as a B wave today and will have a new alternate for you for that. Published very soon 🙂