
I had expected upwards movement to a short term target at 1,258 to 1,261. Price has moved sideways and the target is not met. I have a new alternate for you today.
Summary: In the short term I expect more sideways movement for another one or two sessions.
This analysis is published about 05:54 p.m. EST. Click on charts to enlarge.
Main Wave Count.
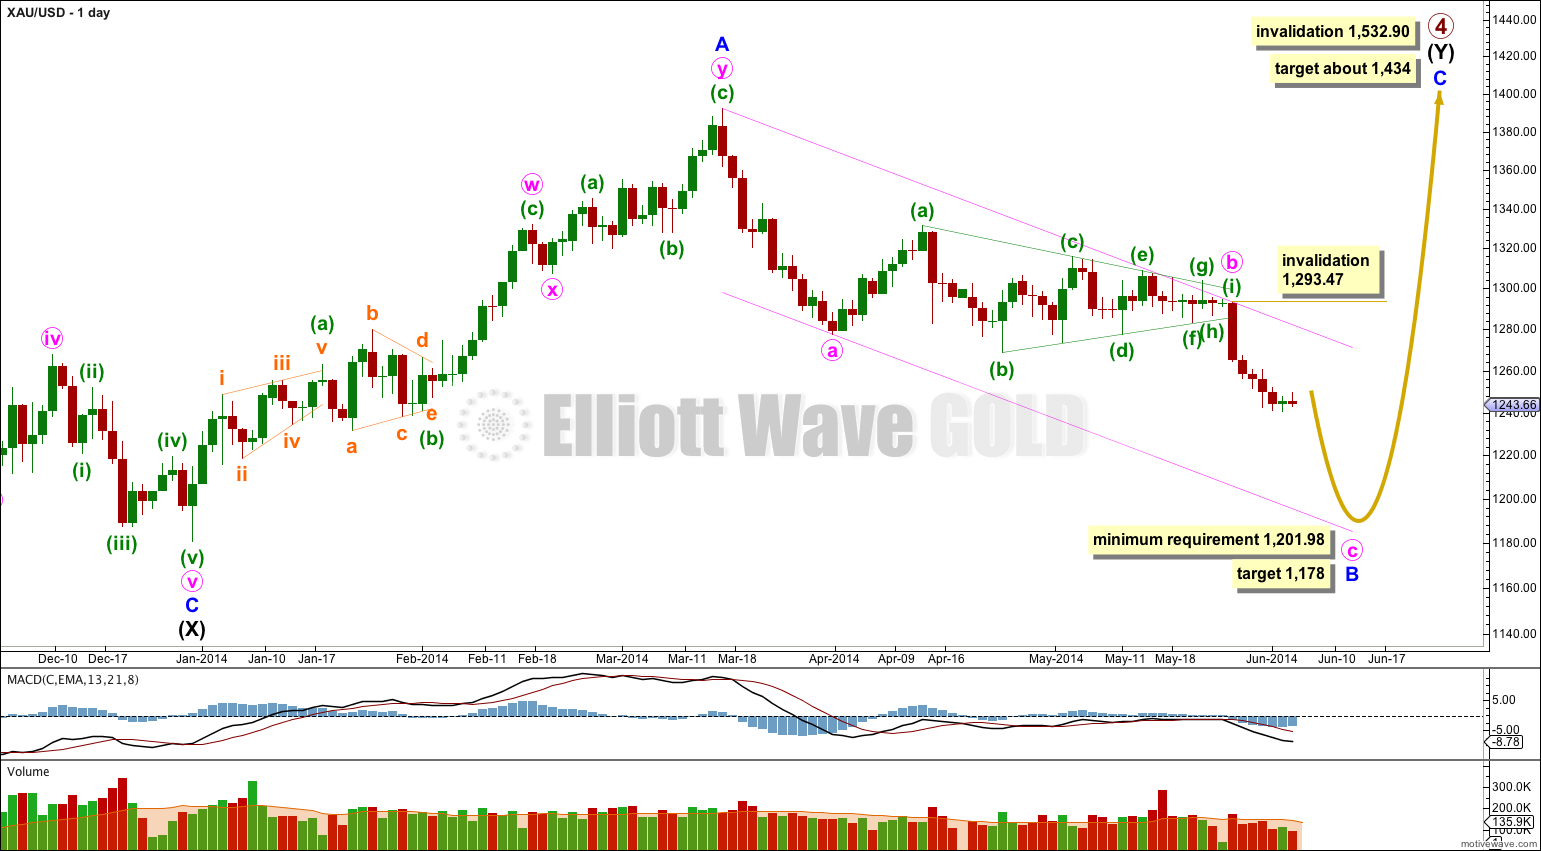
Gold is still within a large fourth wave correction at primary wave degree which is incomplete.
Primary wave 2 was a rare running flat. Primary wave 4 is unlikely to be a flat correction because it is likely to show structural alternation with primary wave 2.
Primary wave 4 is most likely to be completing as a double combination: zigzag – X – second structure. The second structure labeled intermediate wave (Y) is most likely to be a flat correction. Within the flat correction minor wave B must reach a minimum 90% the length of minor wave A at 1,201.98.
If downwards movement does not reach 1,201.98 or below then intermediate wave (Y) may not be a flat correction and may be a contracting triangle. I will keep this alternate possibility in mind as this next wave down unfolds. If it looks like a triangle may be forming I will again chart that possibility for you.
It remains possible that primary wave 4 in its entirety is a huge contracting triangle. This alternate idea is published at the end of this analysis daily.
Overall a double combination for primary wave 4 should take up time and move price sideways, and the second structure should end about the same level as the first at 1,434. Primary wave 4 may not move into primary wave 1 price territory. This wave count is invalidated with movement above 1,532.90.
Within intermediate wave (Y) minor wave B downwards is incomplete. It may be a single zigzag as labeled here, or it may be a double zigzag as per the alternate below. If it is a single zigzag then minute wave c is unfolding as a five wave impulse. Within the impulse minuette wave (ii) may not move beyond the start of minuette wave (i) at 1,293.47. At 1,178 minute wave c would reach equality in length with minute wave a.
I have drawn a channel about minor wave B downwards: draw the first trend line from the start of minute wave a to the end of minute wave b, then place a parallel copy upon the end of minute wave a. I will expect downward movement to find support at the lower end of this channel due to this being the most common place for minute wave c to end.
Within minor wave B downwards if the triangle trend lines for minute wave b are extended outwards they would cross over in about two days. Often this is an indication of when to expect a trend change. This may be where the current sideways movement comes to end.
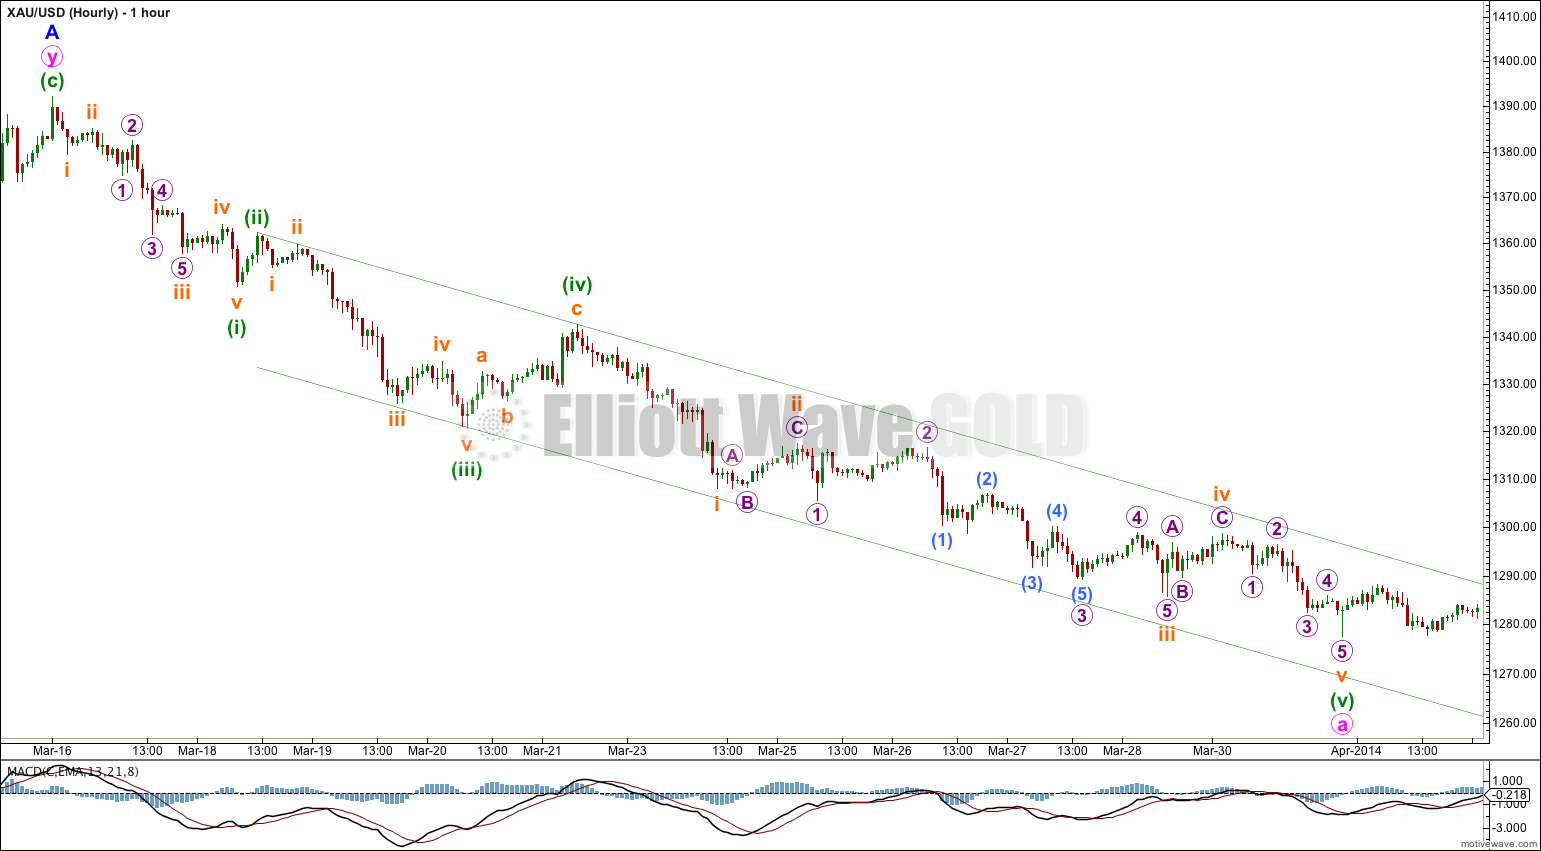
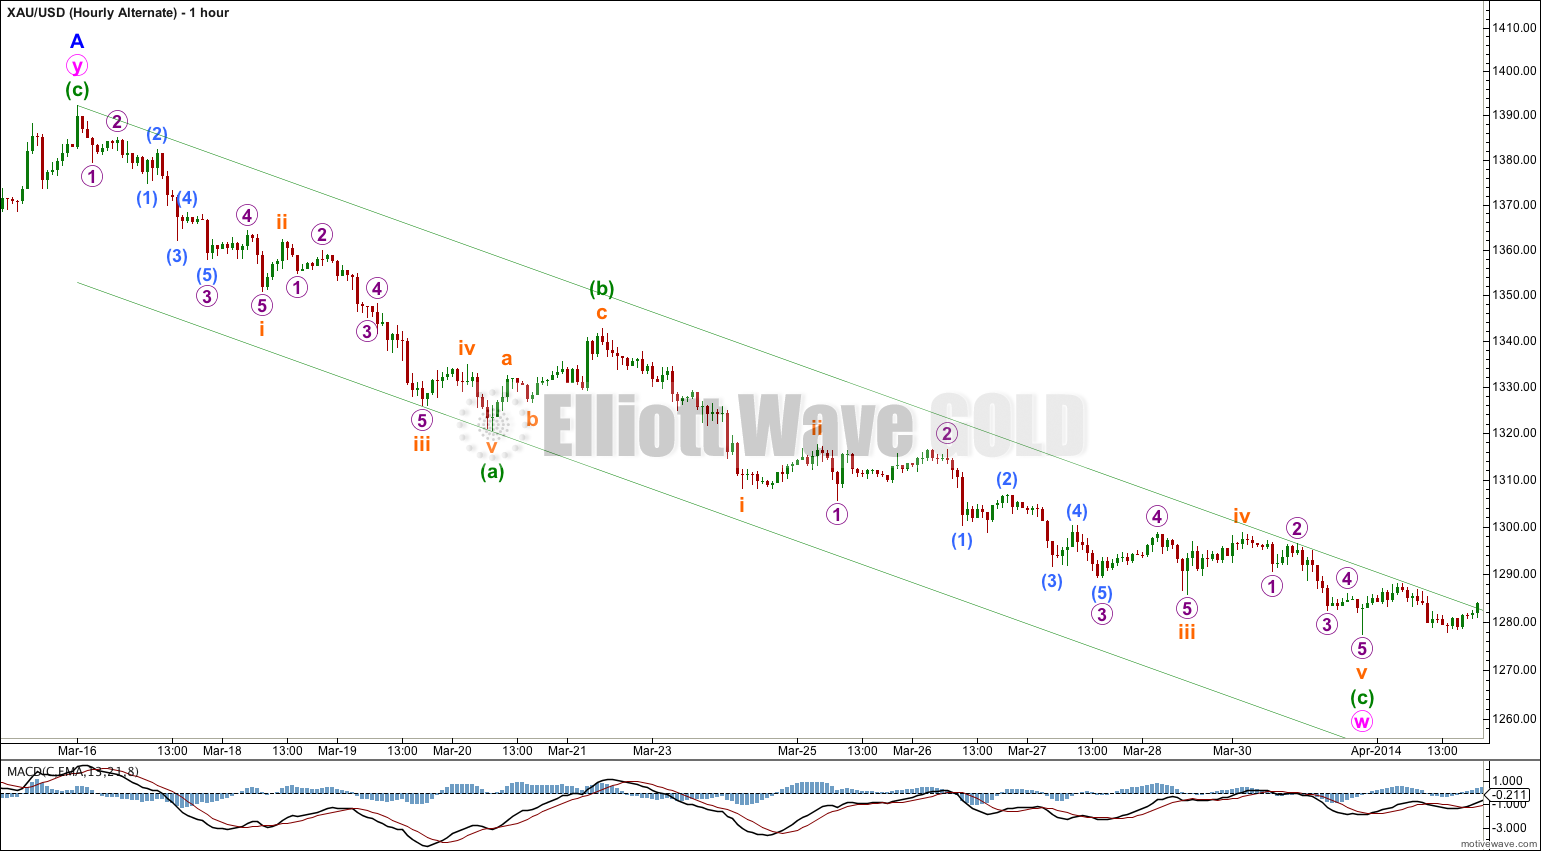
This portion of the hourly chart looks at the structure of minute wave a within minor wave B downwards. Because this main wave count differs from the alternate in how this portion of movement is seen I thought members may like to know the difference.
If minute wave a is a five wave impulse then it fits best with an extended fifth wave. This wave count sees the strongest momentum within minuette wave (iii).
Ratios within minute wave a are: minuette wave (iii) is just 0.21 longer than equality with minuette wave (i), and minuette wave (v) is 2.38 short of 1.618 the length of minuette wave (iii). These excellent Fibonacci ratios are typical for Gold.
Minute wave a fits perfectly within its channel drawn using Elliott’s second technique.
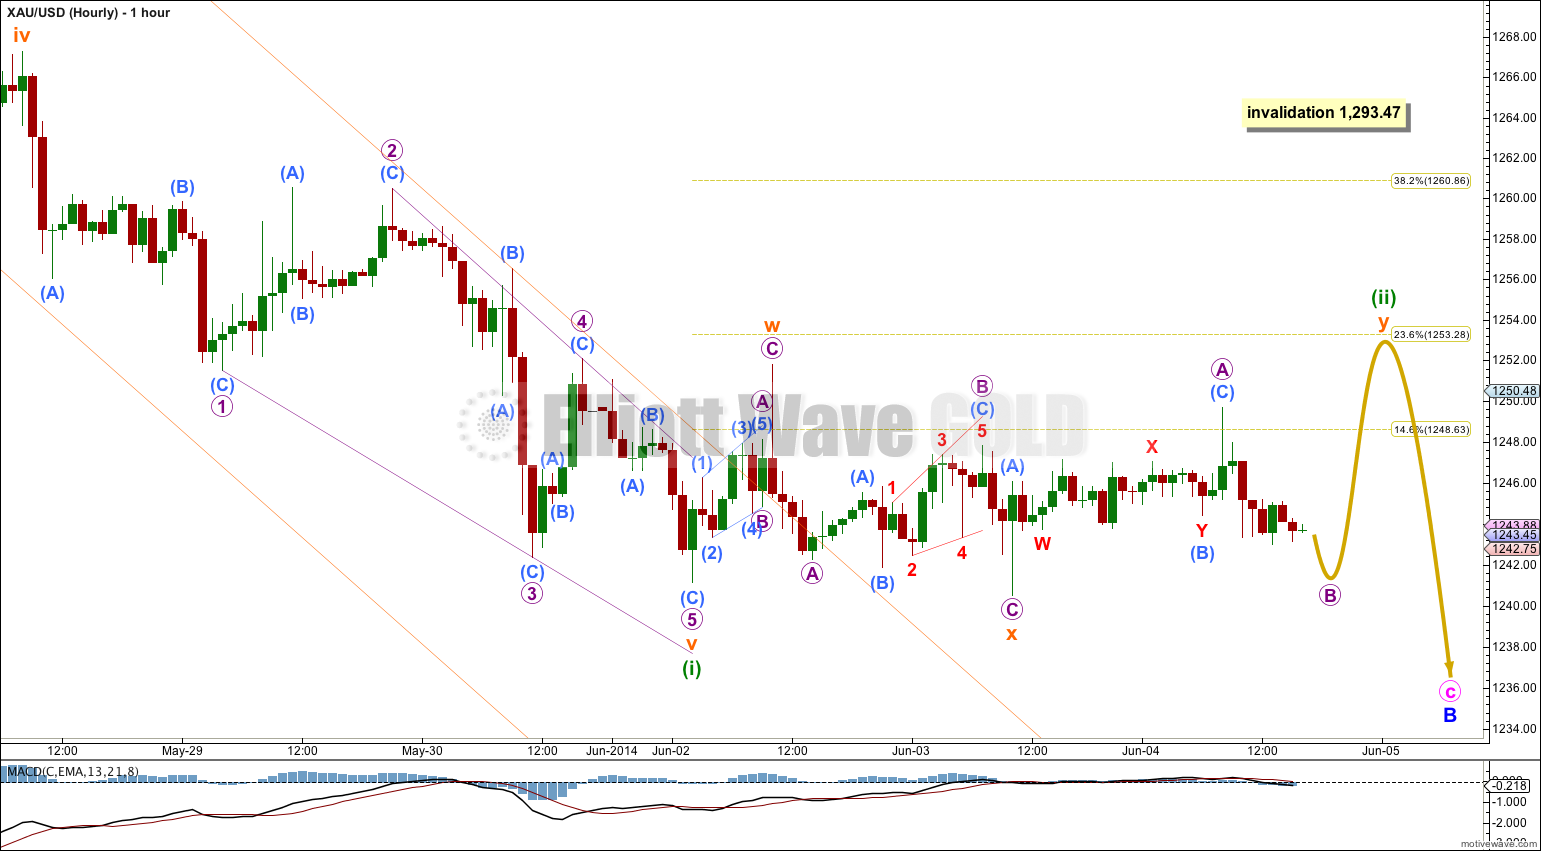
Sideways movement failed to make a new high above 1,251.82 and so I have adjusted the wave count within minuette wave (ii). I have gone back on the five minute chart to look at the structure within subminuette wave w. Initially I saw it only as a double zigzag, but if micro wave A is a leading expanding diagonal then subminuette wave w fits as a single zigzag.
Minuette wave (ii) may be unfolding as a very common double combination: zigzag – X – flat or triangle for subminuette wave y.
Subminuette wave y as the second structure in this double combination would be incomplete. It is unlikely to be a zigzag because subminuette wave x was so deep and X waves within double zigzags are normally more shallow.
If subminuette wave y is a flat correction then within it micro wave B should move lower to reach 90% or more of micro wave A at 1,241.43 or below. Thereafter, micro wave C should move higher to most likely make at least a slight new high above micro wave A at 1,249.70 to avoid a truncation, and it may end about 1,251.82, the same level as subminuette wave w, because combinations move price sideways.
Overall this main wave count expects to see more sideways movement for another one or two sessions before this correction is over. When it is complete then a downwards breakout should be swift and strong.
Alternate Wave Count.
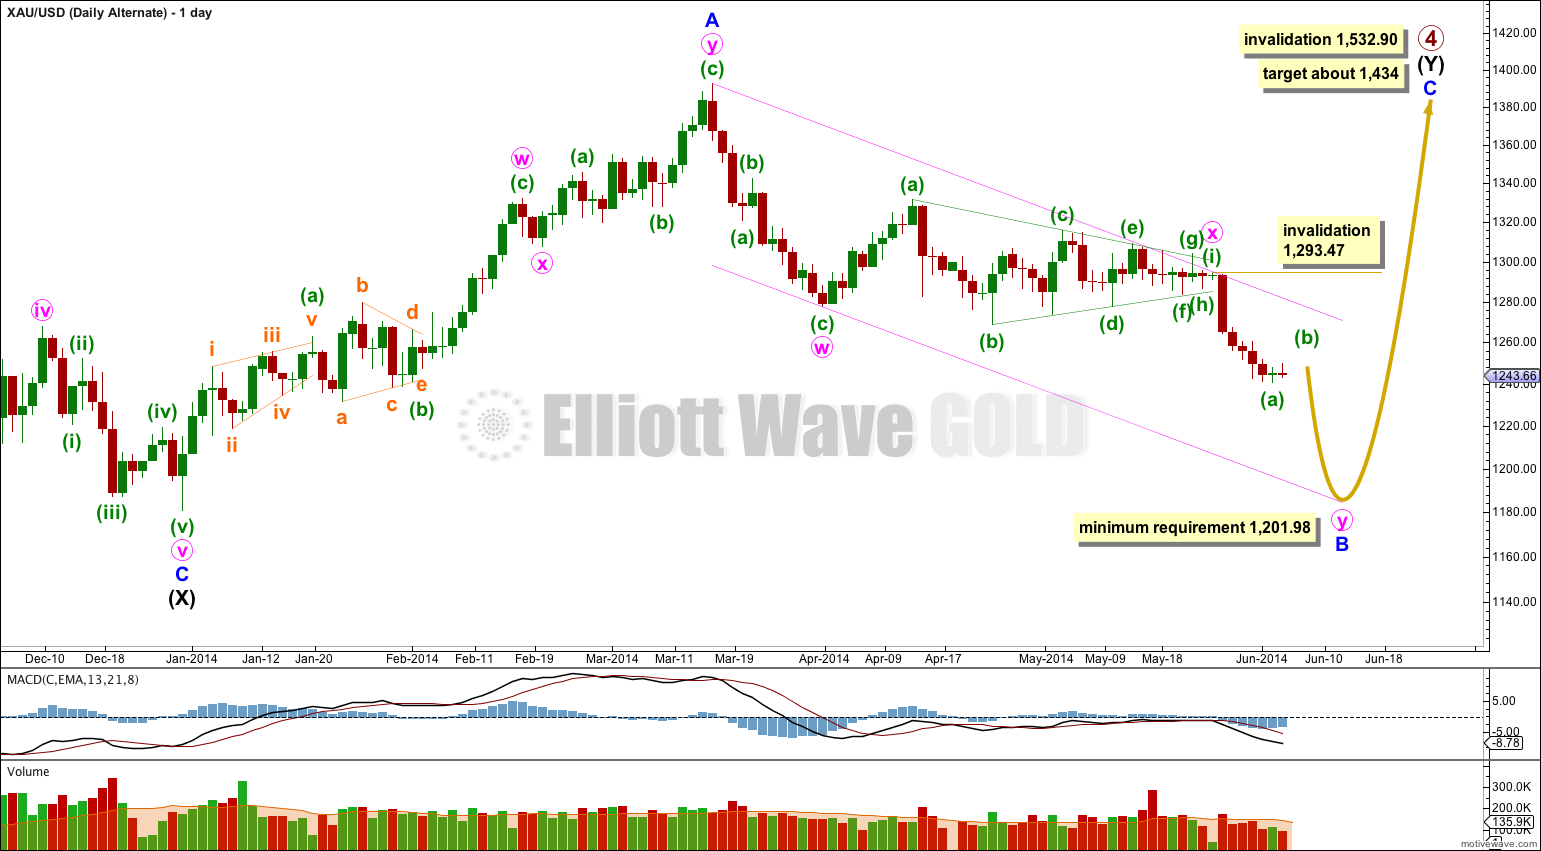
The bigger picture for this alternate is identical to the main wave count. The difference is in the structure of minor wave B. This alternate sees minor wave B as a double zigzag.
Within the downwards wave of minute wave w this movement is seen as a three, a zigzag.
If minute wave w is a single zigzag then minuette waves (a) and (c) do not have an adequate Fibonacci ratio to each other.
Within minuette wave (a) the strongest momentum is within the third wave.
This zigaag does not fit nicely into a parallel channel drawn using Elliott’s technique. The channel is drawn here as a best fit.
At the daily chart level this movement does look more likely to be a three than a five.
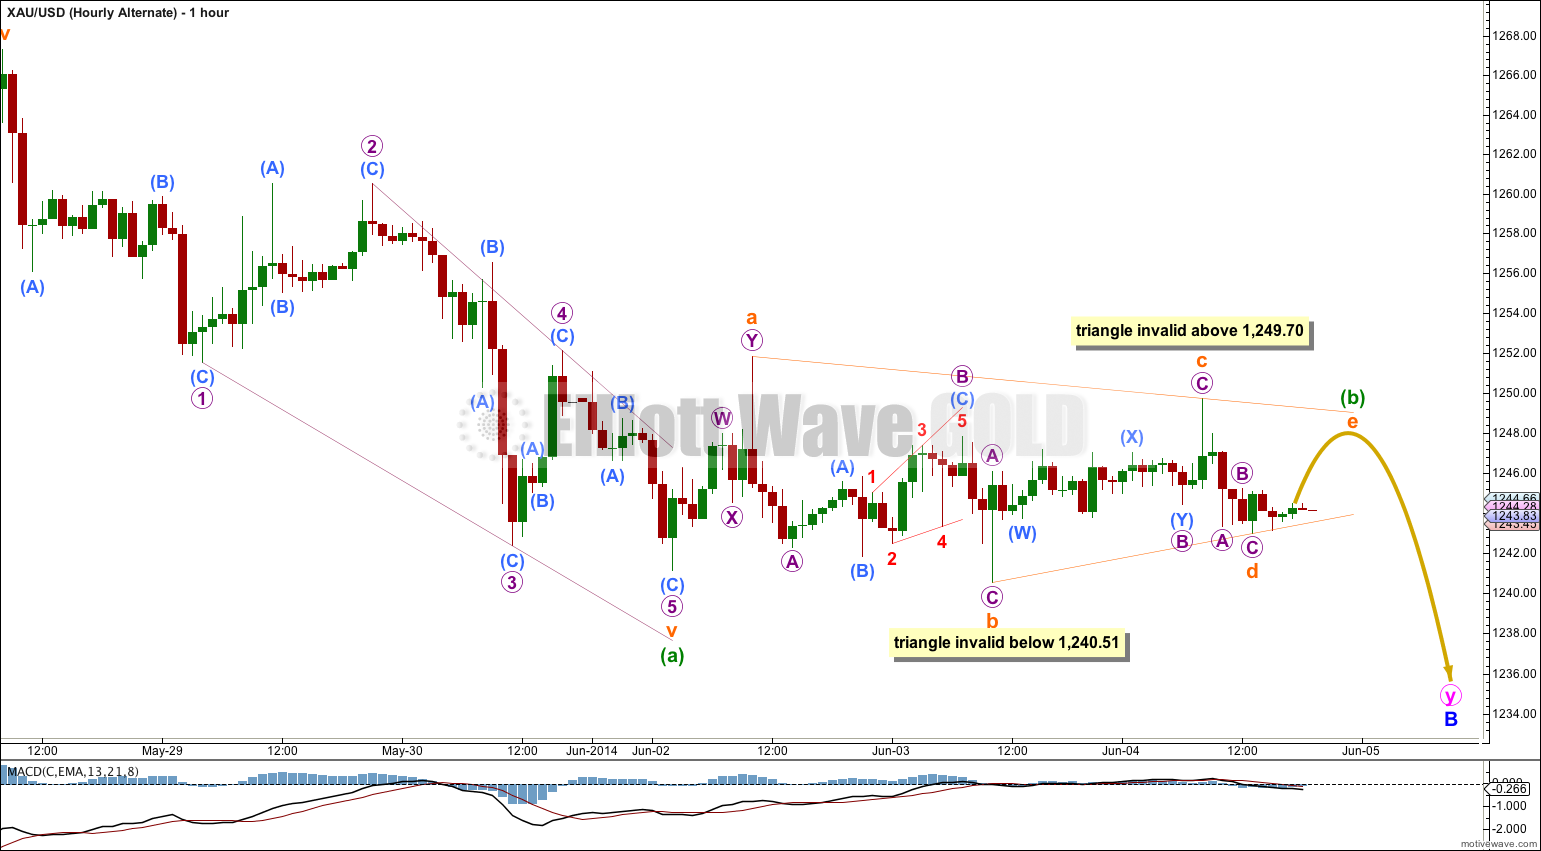
My main reason for considering this alternate idea is the look of the current correction; so far it subdivides nicely as a contracting running triangle. If the triangle continues to be valid and this is how the structure ends, then this must be the correct wave count. This makes a difference to target calculation and so it is important.
Within the triangle subminuette wave a may be either a single or double zigzag. I have labeled it here as a double.
Within a contracting or barrier triangle subminuette wave e may not move beyond the end of subminuette wave c at 1,245.19. This invalidation point is black and white; even a tiny fraction above this point would invalidate the triangle.
Within a contracting triangle any further movement of subminuette wave d (which could move lower yet, as labeled here it is rather brief) may not move beyond the end of subminuette wave b at 1,240.51.
Within a barrier triangle subminuette wave d should end about the same level as subminuette wave b at 1,240.51 so that the b-d trend line is essentially flat. In practice this means subminuette wave d can move very slightly below 1,240.51 and the triangle would still remain valid. This invalidation point is unfortunately not black and white. This is the only Elliott wave rule with any grey area.
If the triangle remains valid then I would expect it to end with more sideways movement in another one or two days. The breakout should be to the downside and would likely be swift and sharp.
Daily – Triangle.
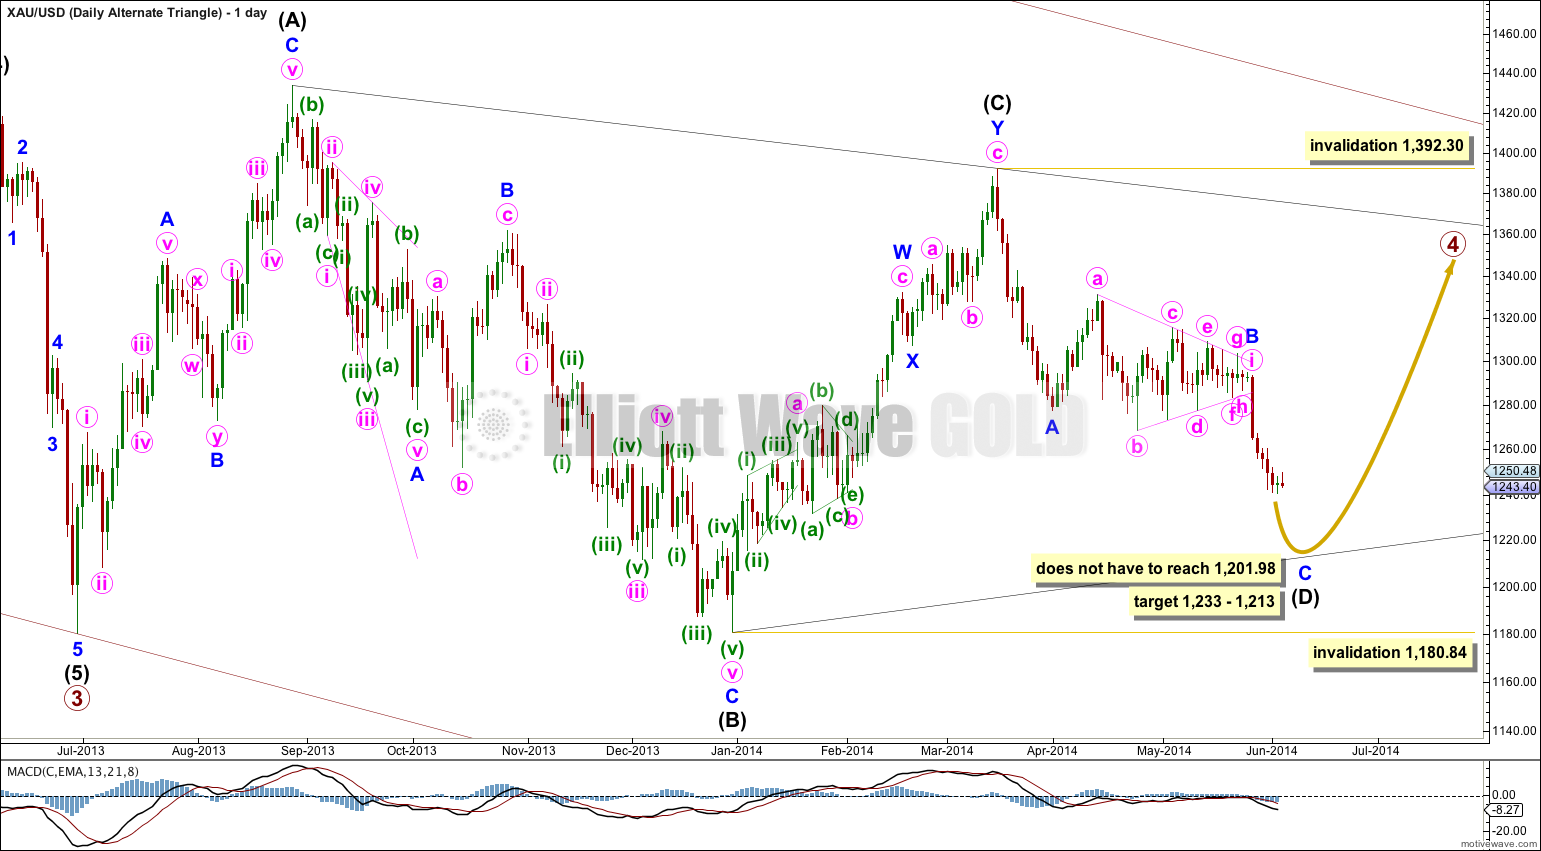
It remains possible that primary wave 4 in its entirety is a huge regular contracting triangle.
So far one of the five subwaves of the triangle subdivides into a double zigzag. All the other four subwaves must then be simple corrections, and three of them must be single zigzags. The fourth may be another type of simple A-B-C correction, and most commonly it would also be a zigzag.
Intermediate wave (D) would most likely be incomplete for the triangle to have a typical look. Intermediate wave (D) may end between 1,233 and 1,213, 75% to 85% the length of intermediate wave (C), which in my experience is a typical wave length for a triangle subwave.
Intermediate wave (D) may not move beyond the end of intermediate wave (B) for a contracting triangle. For a barrier triangle intermediate wave (D) may end about the same level as intermediate wave (B) as long as the B-D trend line remains essentially flat. In practice this means that intermediate wave (D) may end very slightly below the end of intermediate wave (B). This lower invalidation point is not black and white. This is the only Elliott wave rule which is not black and white.
Intermediate wave (E) may not move beyond the end of intermediate wave (C) for either a contracting or barrier triangle.
Yes, for both the main and alternate wave counts today I am showing how I see that downwards wave from 17th March to 31st March.
On the main wave count I see this as a five, on the alternate I see it as a three.
I thought members would like to see the difference.
I’ve also supplied hourly charts for most recent movement for both wave counts.
Lara I do like the alternate better, but I think you have the wrong invalidation point (subminuette c) for the triangle. You have $1245.19 written, but it looks like it should be $1249 going by the chart.
You’re right. Sorry. It is 1,249.70 and I’ll fix the chart.
The hourly charts seem to date back to April?