
This wave count expects Gold is within a grand super cycle correction.
Historic Analysis.
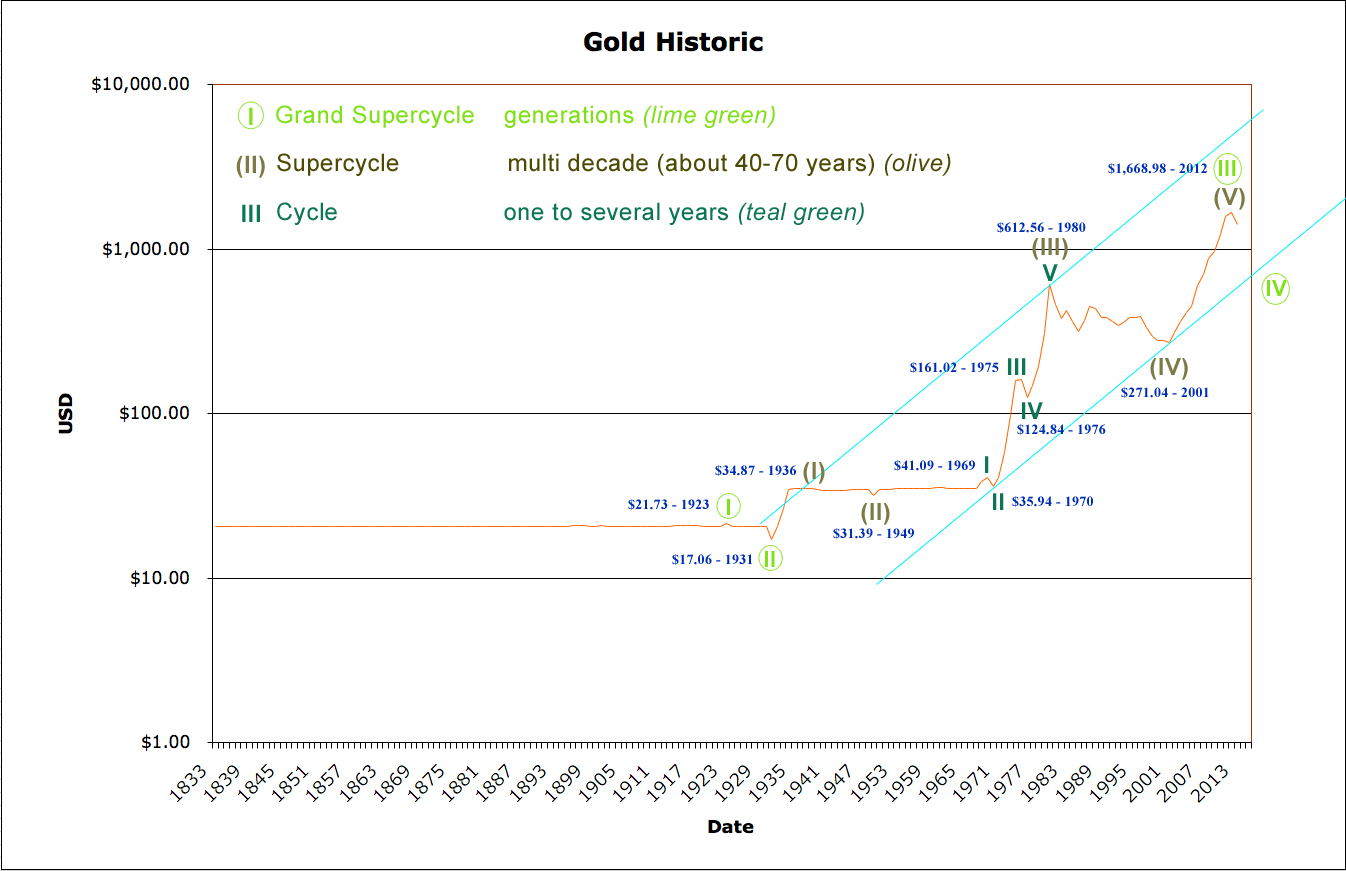
Data used for the chart above is averages for the year. It does not include high / low. Note the chart scale is a logarithmic scale.
This wave count expects Gold is within a grand super cycle fourth wave correction. Super cycle wave IV may not move into grand super cycle wave I price territory below 21.73.
Grand super cycle wave III lasted from 1931 to 2012, 81 years.
Ratios within grand super cycle wave III are: super cycle wave (I) (17.81 in length) has no Fibonacci ratio to super cycle wave (III) (581.17 in length), and super cycle wave (V) (1,397.94 in length) is 123.56 short of 2.618 the length of super cycle wave (III) (this is an 8.8% variation, I consider less than 10% an acceptable ratio).
Within grand super cycle wave III super cycle wave (I) lasted a Fibonacci 5 years, super cycle wave (II) lasted a Fibonacci 13 years, super cycle wave (III) lasted 31 years, super cycle wave (IV) lasted a Fibonacci 21 years, and super cycle wave (V) lasted 11 years.
Ratios within super cycle wave (III) are: cycle wave III (125.05 in length) has no adequate Fibonacci ratio cycle wave I (9.70 in length), and cycle wave V (487.72 in length) is 41.99 short of 4.236 the length of cycle wave III (an 8.6% variation and so acceptable).
Within super cycle wave (III) cycle wave I lasted twenty years (just one short of a Fibonacci twenty-one), cycle wave II lasted a Fibonacci one year, cycle wave III lasted a Fibonacci five years, cycle wave IV lasted a Fibonacci one year, and cycle wave V lasted four years.
The lower aqua blue trend line is drawn using a classic technical analysis approach because an Elliott channel does not fit this data on a log scale. The trend line is drawn from the first two lows within the upwards trend. A parallel copy on the high of super cycle wave (III) gives a nice best fit channel.
I would expect to see grand super cycle wave IV to initially find support at this lower trend line, before breaking thorough this trend line to end below it.
If grand super cycle wave IV ends within the price territory of the fourth wave of one lesser degree then it would reach down as low as 612.56 to 271.04. It would be most likely to end close to (a bit above) the end of the fourth wave of one lesser degree so just above 271.04. This is most typical of fourth waves.
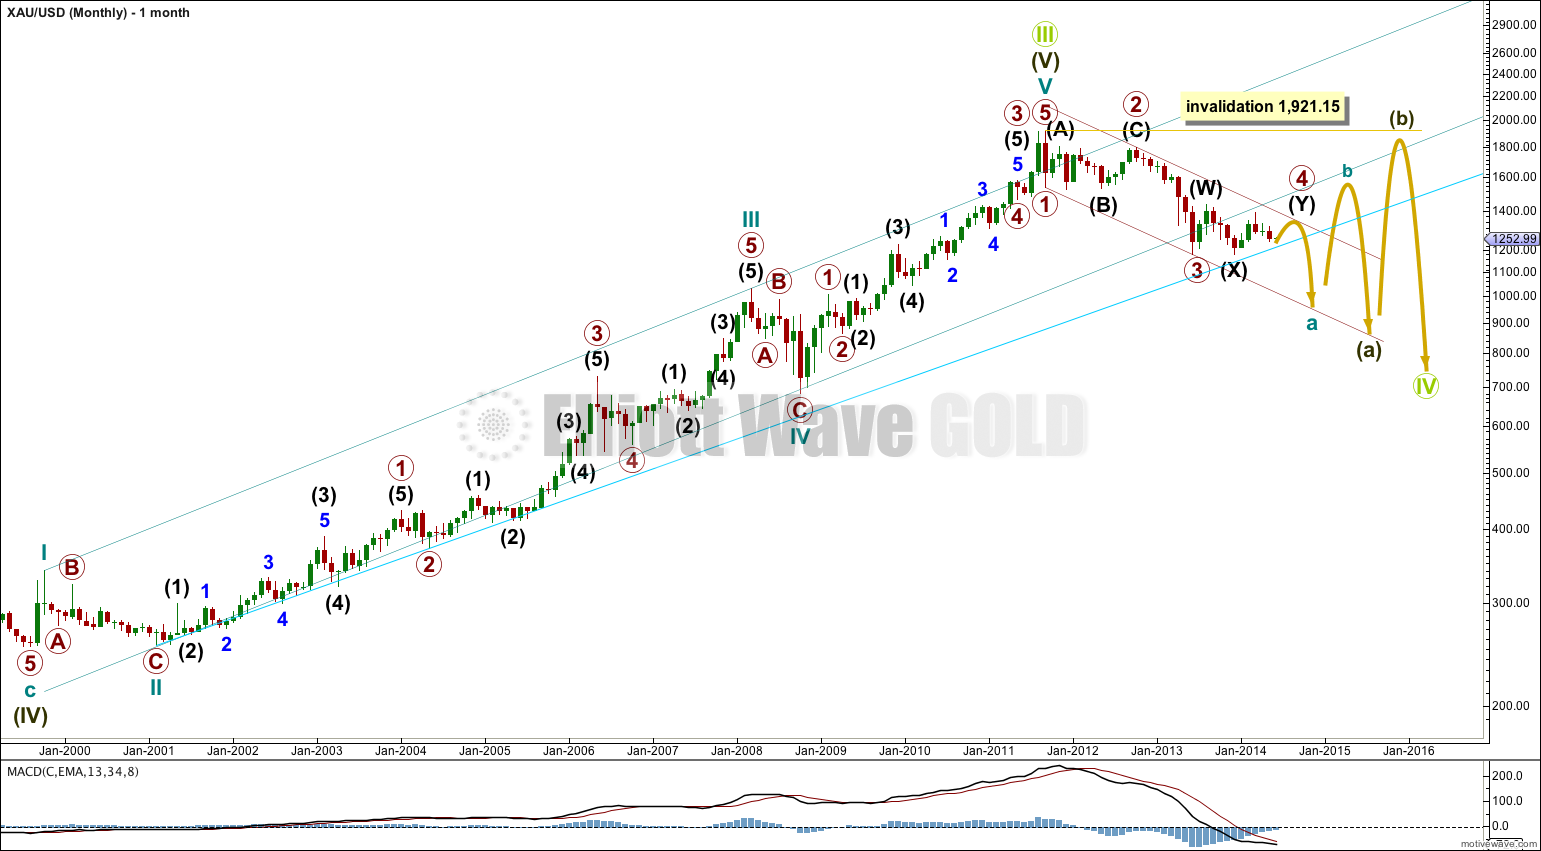
At the monthly chart level I had previously seen the correction as a grand super cycle degree correction, but I had seen it as a second wave. The bigger picture from 1833 has caused me to consider it may more likely be a grand super cycle fourth wave correction.
Within the grand super cycle wave IV super cycle wave (a) is most likely incomplete, and is most likely subdividing as a zigzag. Within it cycle wave a looks like it is unfolding as a five wave impulse.
The daily chart currently focusses each day on the structure of primary wave 4 within the five wave impulse of cycle wave a downwards.
Within the zigzag of super cycle wave (a) cycle wave b may not move beyond the start of cycle wave a above 1,921.15.
Educational question.
Regarding duration of corrective Grand super cycle wave IV ( lime green) you compared the fib duration with Grand super cycle impulse wave III.
But in EW of oil and other gold wave counts corrective waves durations are always fib ratio of prior corrective wave not impulse wave.
For example the recent Oil post u wrote:” I expect intermediate wave (4) to last about the same duration as
intermediate wave (2) which was 28 weeks. It may be a little longer,
lasting a Fibonacci 34 weeks.”
Just asking. If you have a free time you may respond.
Thanks. Great and excellent work.
Feb 13 2015
Lara -Weekend question?
I was reviewing the Grand Super Cycle of gold .Currently gold is in wave IV after wave V completed at 1668?
Super cycle Wave II lasted 8 years. Do you think wave IV will last Fib 1 or fib .618 of wave ii? Wave IV is in 4th year.
Response from EWG:
I have Gold in a Grand Super Cycle wave IV (lime green circle).
I have Grand Super Cycle wave III lasting 79 years. I would expect Grand
Super Cycle wave IV to be more brief, so maybe a Fibonacci 55 years.
So far I have this movement as within super cycle wave (A) (olive green),
and within that cycle wave a (teal). But this could also be cycle wave 1
within super cycle wave A, if super cycle wave A is unfolding as an
impulse.
Somewhat, yes it does.
At this stage I have not done the same to Silver as I have for Gold – I do not have data for Silver which goes back to 1833 as I have for Gold.
When I find such data and reanalyse the grand super cycle wave count I may very well change my wave count for Silver to be in line with Gold.
I’m not in a hurry to do that though. At this stage I expect they’re both in a super cycle correction which will continue for years yet. There’s no rush.
Lara when I see and think deeply about these two long-term charts I can’t help but think of incredible amount of profits coming my way over the next 3+ years from trading them using your Einstein like mastery, interpretation, expression and videos of Elliott Waves. They are very beautiful, exciting and inspirational. Thanks a lot for them. They truly are one of the highlights of my day.
Silver’s supercycle contradicts this.
Thanks for this fascinating long term outlook for gold. I am sure this is not what hyperinflation outlook goldbugs like to hear but they must heed – for their own good.