
Last analysis expected downwards movement with an increase in momentum. This is not what happened. Upwards movement above 105.21 invalidated the daily wave count.
Summary: An important trend line has been touched. I expect downwards movement from this point. The long term target at 74.53 is at least three months away, probably longer.
Click on charts to enlarge.
Main Wave Count.
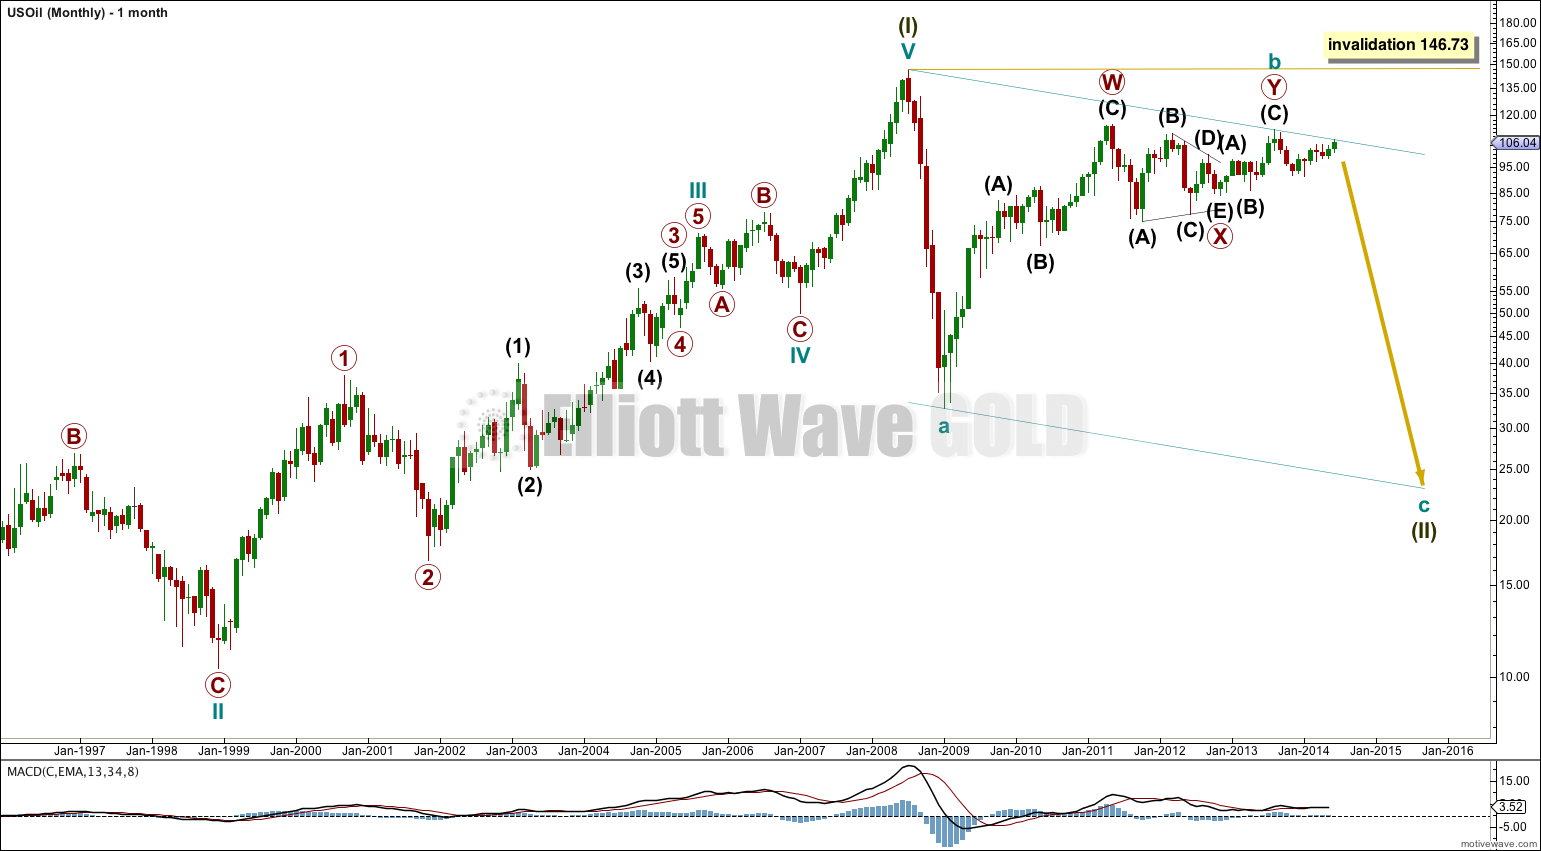
I am swapping over my main and alternate wave counts for US Oil at the monthly chart level. I am doing this because upwards movement has hit the upper teal trend line. The confirmation / invalidation points are reasonably close together. We may have clarity between these two wave counts quite soon. In the meantime I would judge this main wave count to have the better overall look and so a higher probability.
The one thing which looks most certain in this wave count is cycle wave a downwards is a five wave impulse. This means cycle wave b may not move beyond the start of cycle wave a above 146.73. Cycle wave b should subdivide as a three wave structure. It looks like a double zigzag which may be complete.
Within the double zigzag this wave count sees primary wave X as a regular contracting triangle, ending at 84.07 where intermediate wave (E) typically undershot the B-D trend line. The alternate analysis sees primary wave X triangle ending later at 85.64, and this is the key difference between the two wave counts.
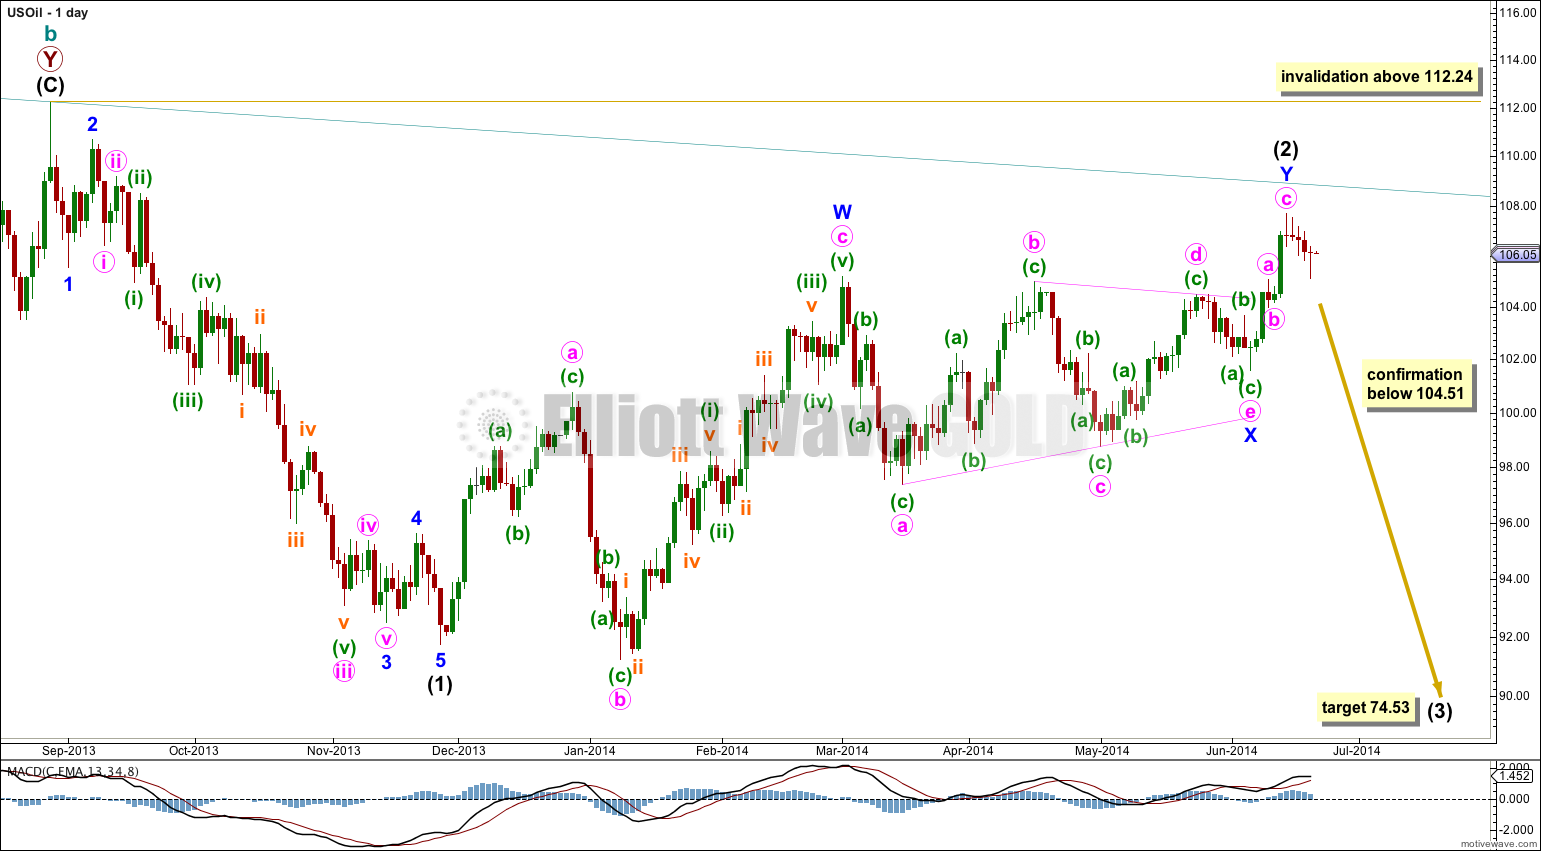
Within cycle wave c intermediate waves (1) and now (2) may also be complete. Intermediate wave (2) subdivides as a combination: expanded flat – triangle for X – zigzag.
At 74.53 intermediate wave (3) would reach 1.618 the length of intermediate wave (1). It should last at least the same duration as intermediate wave (1) which was three months, but most likely it would be substantially longer. It may last about six months or so.
Divergence between price and MACD during the end of intermediate wave (2) supports this wave count.
Movement below 104.51 at this stage would invalidate the alternate wave count below and confirm this main wave count.
Alternate Wave Count.
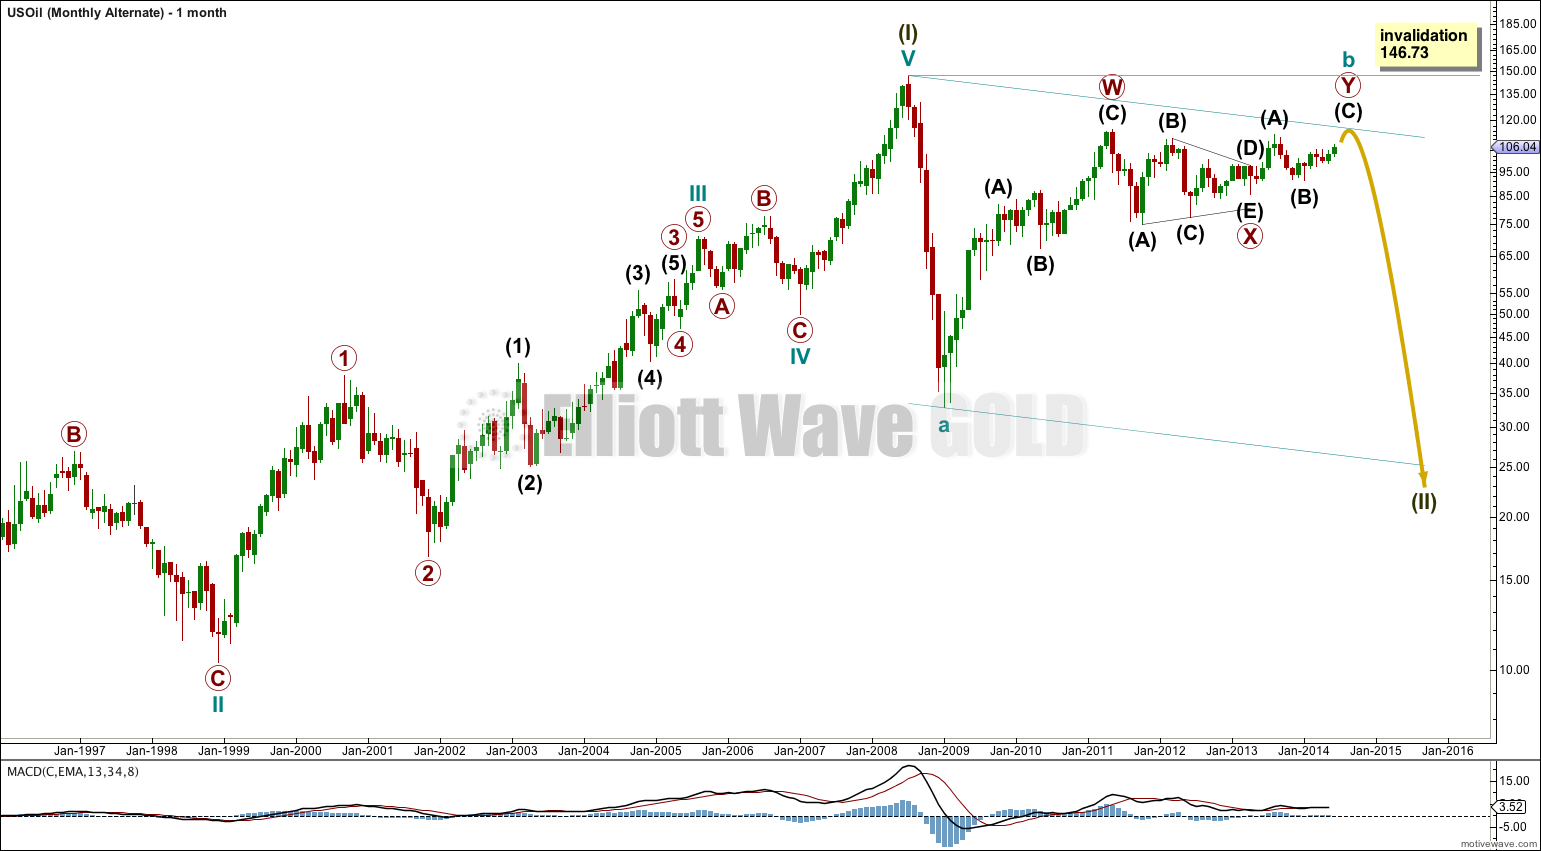
This alternate wave count sees the triangle for primary wave X ending later, and at that point the structure for the triangle actually has a much better look than the main wave count.
This wave count expects some more upwards movement before cycle wave b is complete.
Cycle wave b is still seen as a double zigzag, and the second zigzag for primary wave Y is incomplete. Only intermediate wave (C) needs to complete.
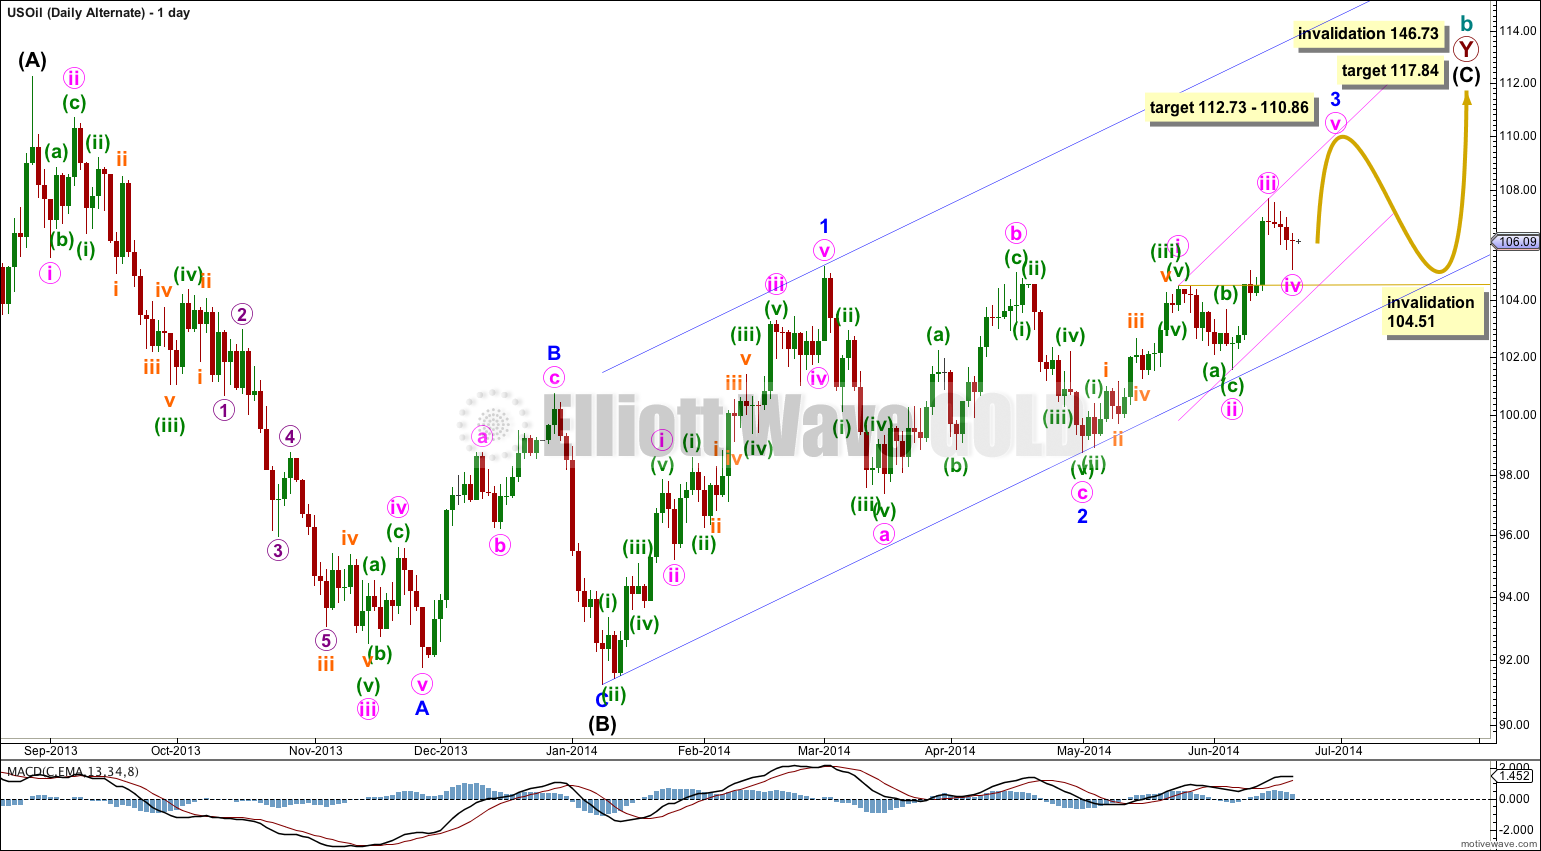
Within intermediate wave (C) minor waves 1 and now 2 are complete. Minor wave 2 ended with a truncated C wave.
At 112.73 minor wave 3 would reach equality in length with minor wave 1.
At 110.86 minute wave v would reach equality in length with minute wave i.
Minor wave 3 has not shown an increase in upwards momentum beyond that seen for minor wave 1. This reduces the probability of this wave count to an alternate.
Within minor wave 3 minute wave iv may not move into minute wave i price territory below 104.51.
At 117.84 intermediate wave (C) would reach equality in length with intermediate wave (A).
Dear Lara,
We now have confirmation of your main count for oil and it appears to be breaking down. I am looking for an entry point for a trade. But I would appreciate seeing your current count before doing so. So, whenever you have a change to do an update on the crude oil market, I would appreciate it. I am guessing we are in the middle of the beginning of wave c down.
Take care,
Rodney
Hi Lara. Confirmation of the main hourly happened today. Can I just check that you are still feeling the same as the above analysis?
Yes.