
Downwards movement was expected for the main Elliott wave count, which was judged to have a 90% probability. The first target was at 1,305 and has now been slightly exceeded.
I still have an alternate wave count for you.
Summary: In the short term, if price remains below 1,314.44, I expect one more wave down to 1,296 to 1,297. Thereafter, another sideways correction should remain below 1,335.23, but would most likely only reach as high as 1,309.54. However, if we see a new high above 1,314.44 in the short term (before a new low) then a second wave correction may be unfolding. At that stage I would expect a second wave to end about 1,328.52.
Click on charts to enlarge.
Main Wave Count.
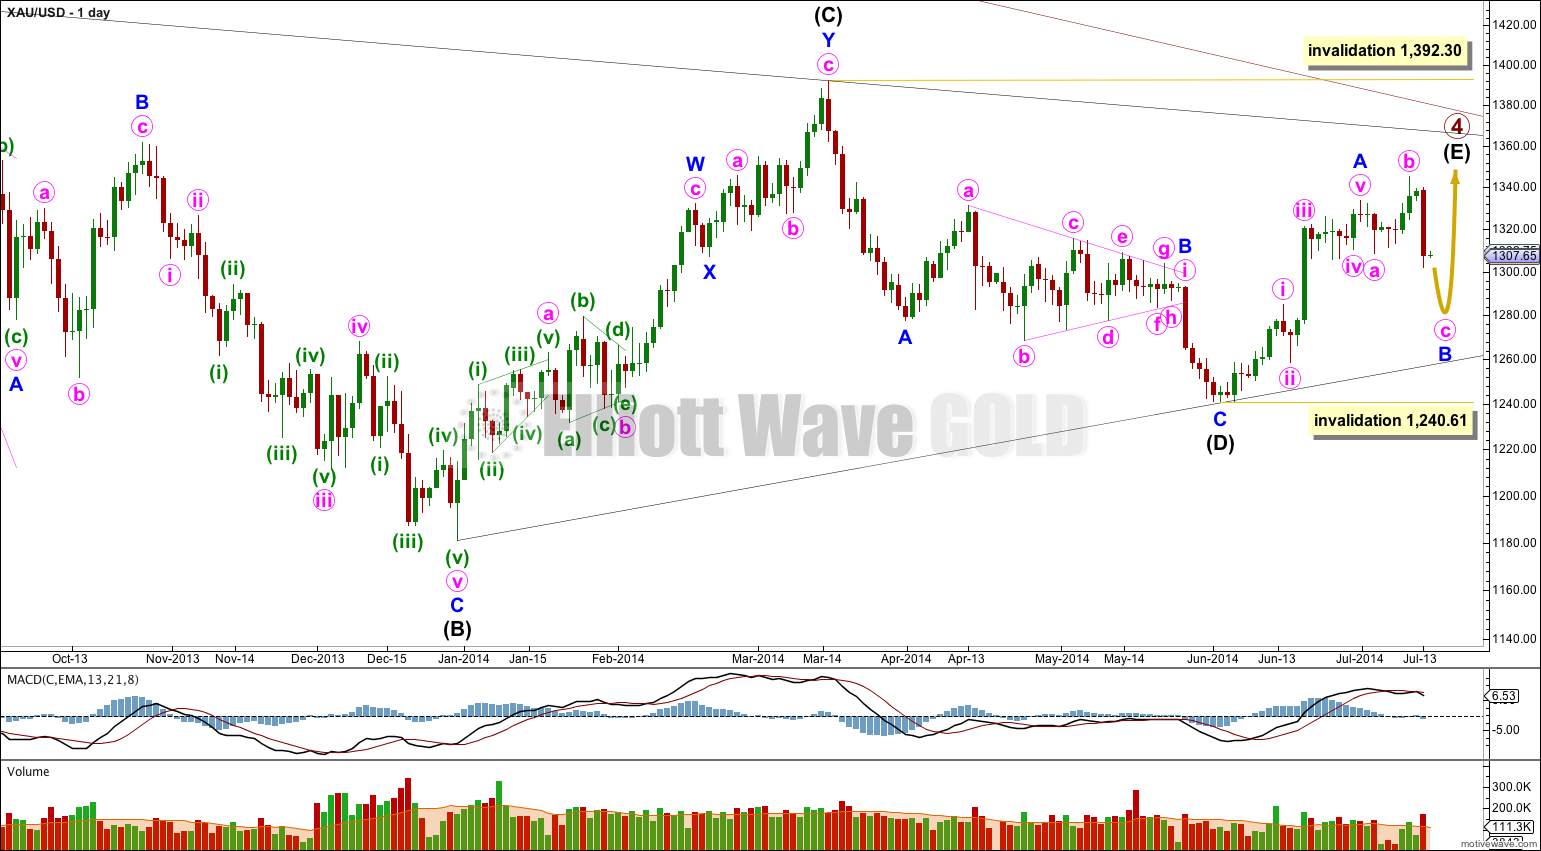
It is likely that only minor wave A is complete and sideways movement is an incomplete minor wave B. This wave count could see primary wave 4 last another two weeks to complete in 56 weeks, just one week longer than a Fibonacci 55. It could also end very quickly this week, but I don’t think that would allow enough time for the structure to unfold.
Minor wave B may not move beyond the start of minor wave A below 1,240.61. Invalidation of this wave count at the daily chart level would provide full confidence in the alternate wave count.
If minor wave B moved substantially lower it should find very strong resistance at the (B)-(D) trend line. A breach of this trend line would look very atypical and at that stage this main wave count would significantly reduce in probability, so much so I would discard it.
B waves exhibit the greatest variety in form and structure of all waves. At this stage it looks like minor wave B is an expanded flat, which when it is done should have a similar look as minor wave B within intermediate wave (B) (at the left hand side of the chart).
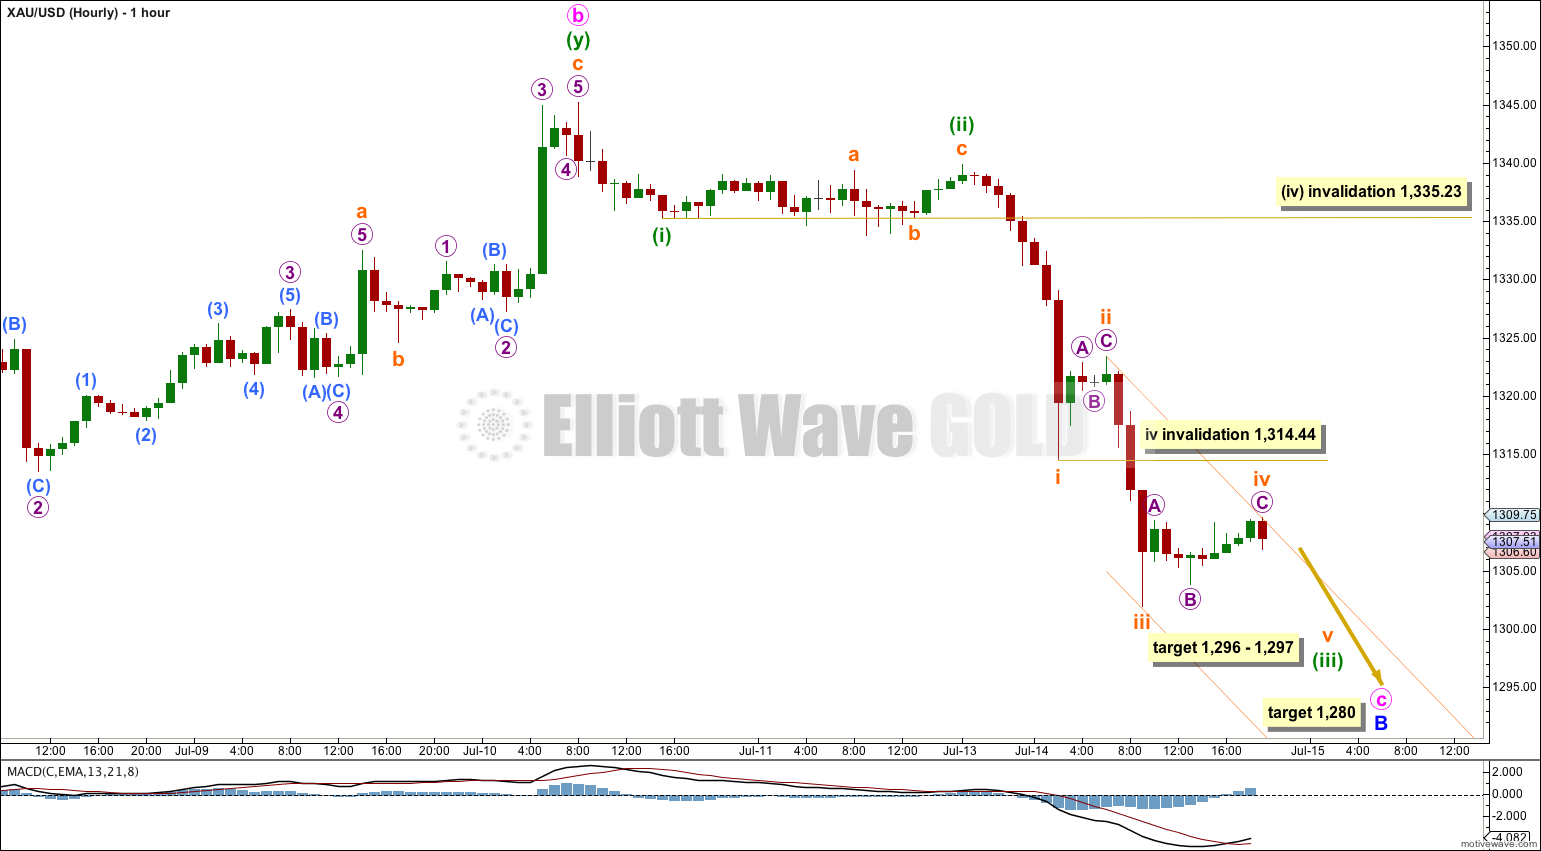
There is more than one way to see the downwards structure within minute wave c so far. On this main hourly wave count I am labeling the movement as an incomplete five down, which has the best fit as I see it. This labeling sees the middle of a third wave for subminuette wave iii just completed, and this movement has the strongest downwards momentum.
The alternate wave count below has different labeling on the hourly chart, and that labeling would also work for this main wave count (for the downwards portion of this movement only). If price moves above 1,314.44 before a new low is made then the alternate hourly labeling would be correct, with the labeling of a second wave correction underway.
For this labeling above, at 1,296 subminuette wave v would reach 0.618 the length of subminuette wave iii. Here subminuette wave iii is shorter than subminuette wave i, and so subminuette wave v is limited to no longer than equality with subminuette wave iii at 1,288.07.
At 1,297 minuette wave (iii) would reach 4.236 the length of minuette wave (i). This gives us a $1 target zone calculated at two wave degrees, which has a good probability.
Subminuette wave iv, if it moves any higher, may not move into subminuette wave i price territory above 1,314.44.
When subminuette wave v downwards completes minuette wave (iii) then minuette wave (iv) should unfold as a shallow sideways moving correction to show alternation with minuette wave (ii). Minuette wave (iv) would most likely end about the same level as the end of the fourth wave of one lesser degree, close to the end of subminuette wave iv at 1,309.54.
The target for minute wave c to end is now only at 1,280 where minute wave c would reach 2.618 the length of minute wave a. This target may be met by the end of this week.
When minuette waves (iii) and (iv) are completed I can then calcualte the end target at a second wave degree. At that point the target of 1,280 may widen to a small zone or it may change.
Alternate Wave Count.
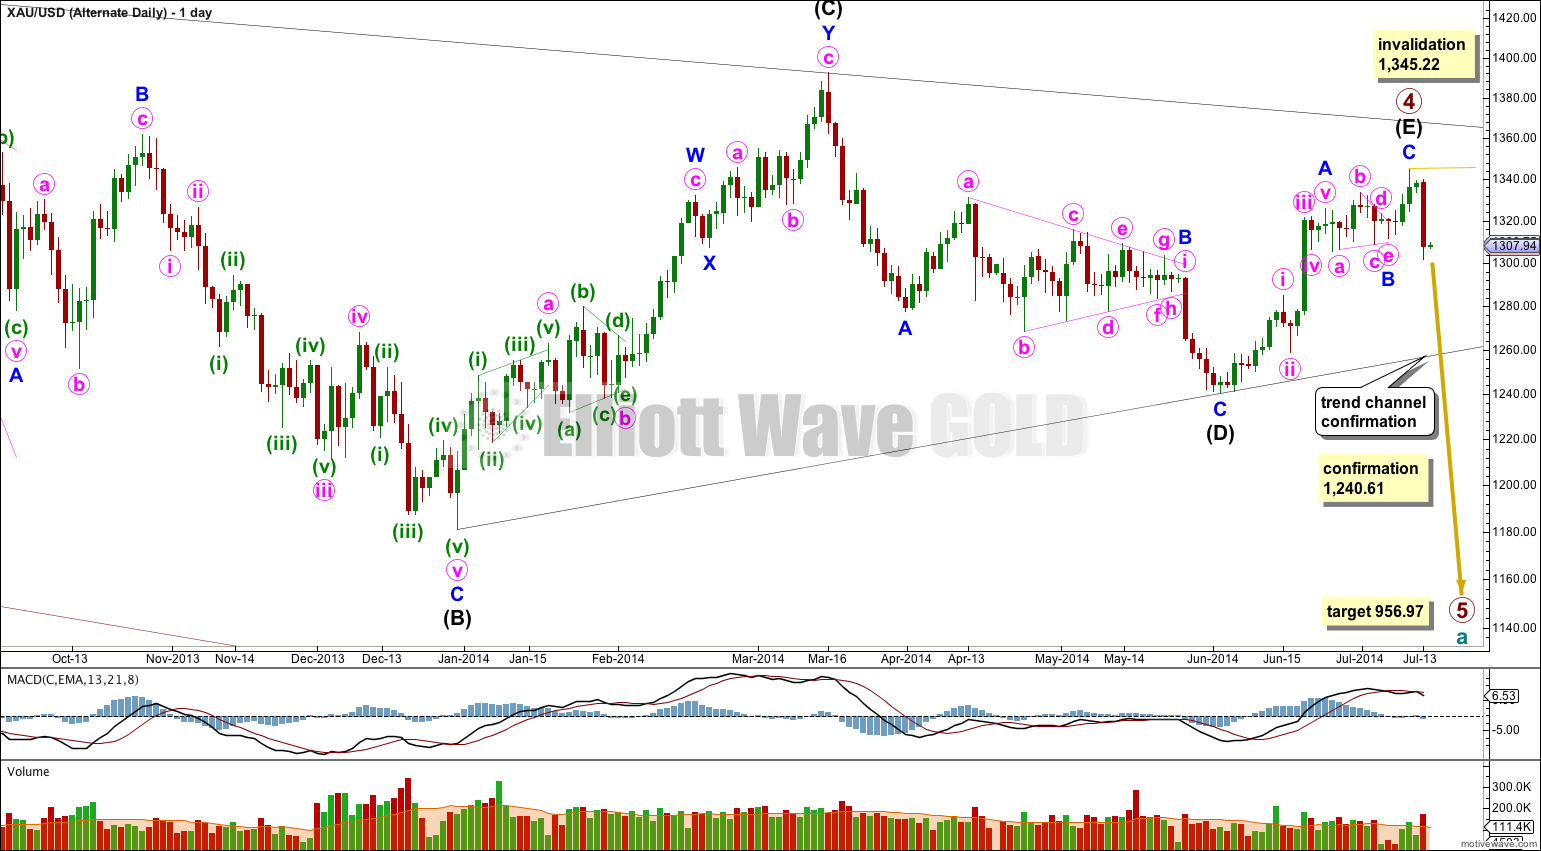
It is possible that primary wave 4 is complete in a total 54 weeks, just one short of a Fibonacci 55 and just one week longer than primary wave 2 which was 53 weeks in duration.
The subdivisions for this alternate do not have as neat a fit as the main wave count:
– The triangle for minor wave B has an overshoot of the b-d trend line within minute wave c which looks significant on the hourly chart.
– At the end of minor wave A minute wave v does not subdivide well as a five wave structure on the hourly chart. This movement fits better as a three.
– Minor wave C subdivides here as a five wave structure, but it has a much better fit as a zigzag (which is how the main wave count sees it).
For the three reasons above this alternate has a lower probability. I would judge it at this stage to have a 20 – 30% probability.
In the short term both wave counts expect more downwards movement, so there is no divergence in expectations. The differentiating point is the lower (B)-(D) trend line here on the daily chart. If this trend line is breached by a full daily candlestick below it and not touching it then I would discard the main wave count and this alternate would be my only wave count.
Final price confirmation would come with movement below 1,240.61. At that stage the main wave count would be fully invalidated.
At 956.97 primary wave 5 would reach equality in length with primary wave 1. Primary wave 1 was a remarkably brief three weeks in duration. Primary wave 5 could also be as brief, but it is more likely to show a little alternation and be longer lasting.
I have again adjusted the analysis within minor wave C. If minor wave C is over here then it was just 1.49 longer than 0.382 the length of minor wave A.
Ratios within minor wave C are: there is no Fibonacci ratio between minute waves iii and i, and minute wave v is 1.69 longer than minute wave iii. Minute wave v has the strongest upwards momentum, which is often seen for fifth waves within commodities.
It is this fifth wave tendency to strength which makes me consider the labeling of downwards movement as a possibly complete five wave impulse.
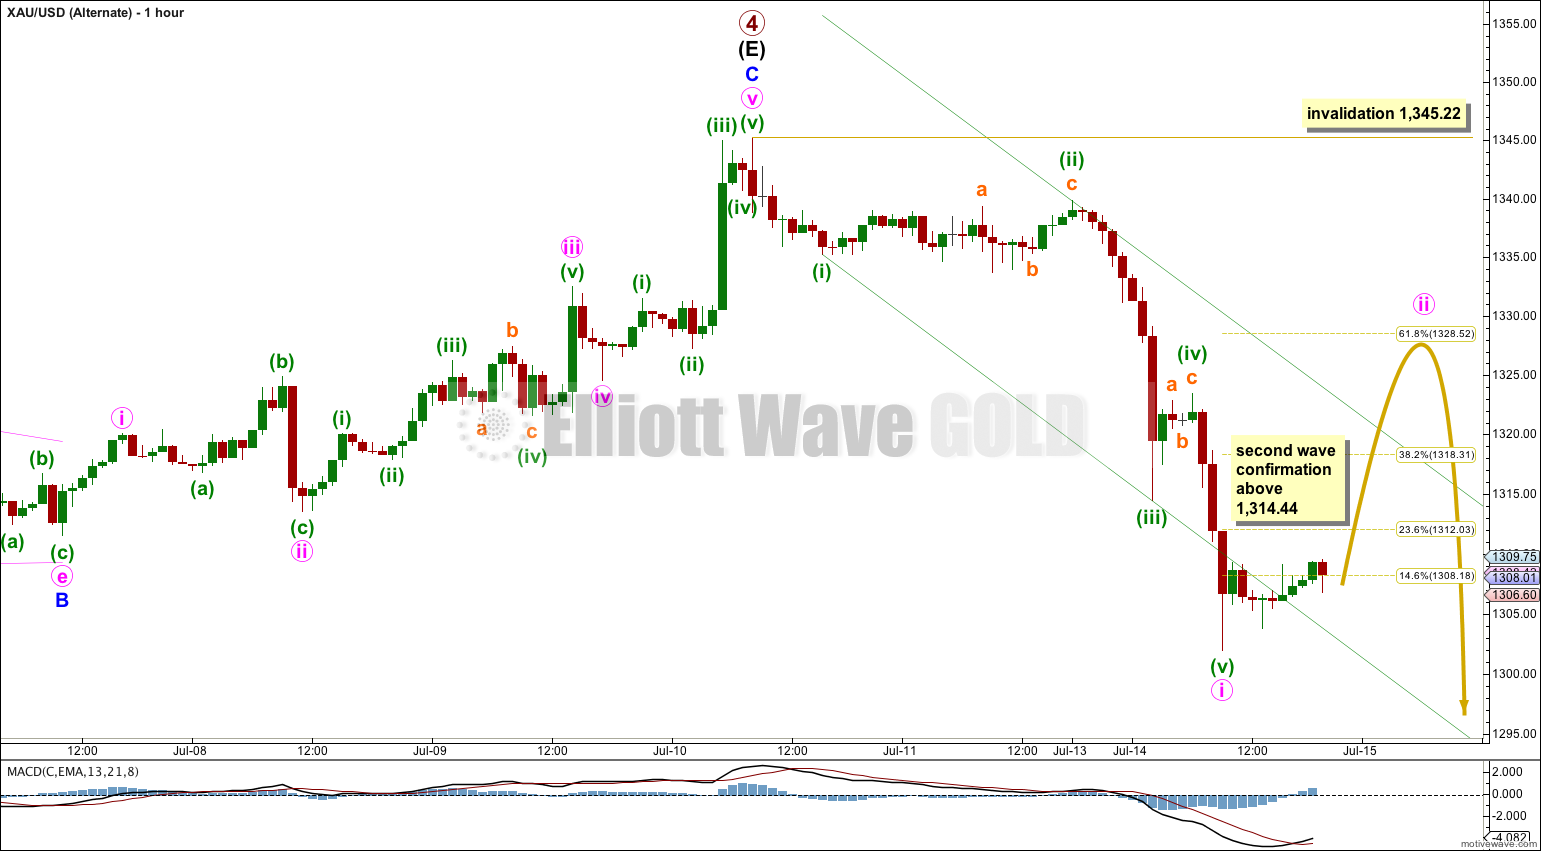
Ratios within minute wave i are: minuette wave (iii) is 0.74 short of 2.618 the length of minuette wave (i), and minuette wave (v) has no Fibonacci ratio to either of minuette waves (iii) or (i). Minuette wave (v) shows the strongest momentum and has overshot the trend channel about minute wave i. This looks like a typical fifth wave for a commodity market.
I would judge this labeling of downwards movement to be less likely than labeling on the main hourly chart. Here minuette waves (iv) and (ii) are highly disproportionate: minuette wave (ii) was a flat correction lasting 25 hours and showing up on the daily chart as a small green candlestick, while minuette wave (iv) is a quick zigzag lasting only 4 hours and not showing up on the daily chart. For this reason this labeling has a lower probability.
If minute wave ii is underway (and this works for both wave counts at the hourly chart level) we would have confirmation above 1,314.44. At that stage I would expect minute wave ii to most likely end about the 0.618 Fibonacci ratio of minute wave i at 1,328.52.
If minute wave ii is an expanded flat or a combination including an expanded flat or running triangle then it may include a new low below its start at 1,301.95. For this reason there is no lower invalidation point for this wave count. If a new low below 1,301.95 is seen then only a careful analysis of the last wave down (is it a three or a five?) will tell us if this is part of a second wave correction or if it is part of a fifth wave down.
Minute wave ii may not move beyond the start of minute wave i above 1,345.22.
This analysis is published about 09:57 p.m. EST.
#Lola
The main has NOT been invalidated as overnight session highs topped out at 1313.75. We have yet to see what NY action brings us today before we can call for invalidation. I can go either way in my trade, however I am biased toward a move to the 1297-1280 area, therefore staying under 1344.44 is in my best interest. We shall see what today’s action brings!
Hi,
The main was invalidated as per your data @ 1314.44, not in my graph @1316.75.
My data shows only a high at 1,313.86 for 15th July, 2014.
However, I am aware that different data feeds show differences in their data.
I’m using an FXCM data feed.