
The first five wave structure upwards is now complete. The structure and behaviour which follows it gives us information as to whether this upwards trend should continue towards the target, or if it could be over there.
Summary: The most likely target for minor wave C to end is still 1,343 at this stage. When this current sideways correction is over I am expecting a sharp upwards thrust for a third wave.
Click on charts to enlarge.
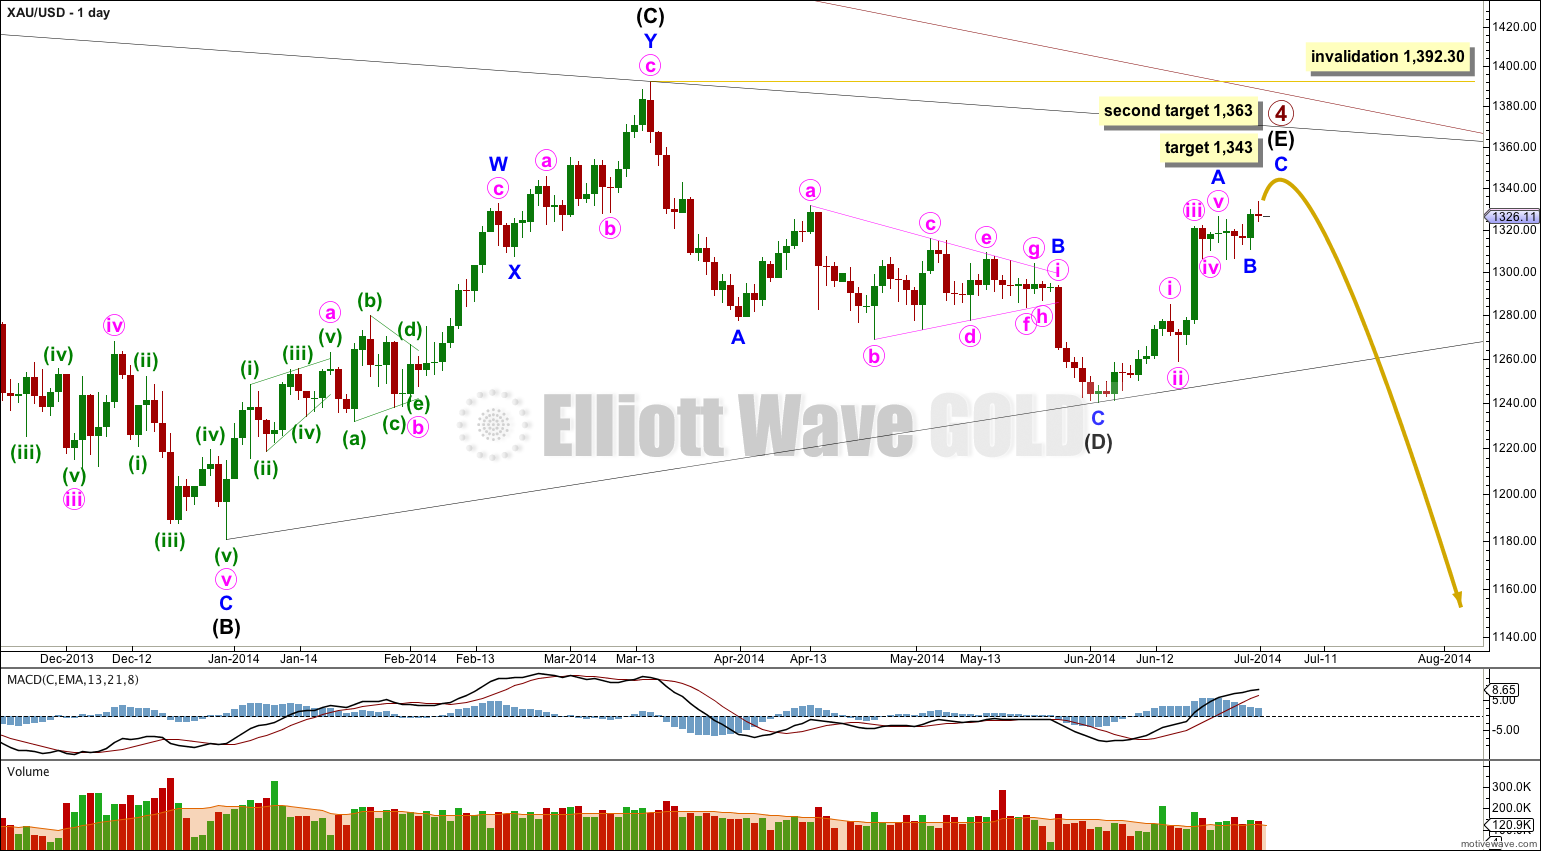
Primary wave 4 is very close to completion as a regular contracting triangle.
Intermediate wave (E) is most likely to fall short of the (A)-(C) trend line. It may also overshoot this trend line, but that is less common. If it does overshoot this trend line then it may find resistance, and end, at the upper edge of the bigger maroon channel on the weekly chart.
Within the zigzag of intermediate wave (E) at 1,343 minor wave C would reach 0.382 the length of minor wave A and intermediate wave (E) would end before the (A)-(C) trend line. The next likely place for minor wave C to end would be at 1,363 where it would reach 0.618 the length of minor wave A. Minor wave C cannot reach equality with minor wave A because that would take price above the invalidation point.
When there is more structure within minor wave C to analyse I will be able to calculate a target for it to end at minute degree. At that stage I will be able to determine which of the two targets is more likely. At this stage I favour the lower target because it would see intermediate wave (E) end comfortably short of the (A)-(C) trend line which is more typical.
So far within primary wave 4 intermediate wave (A) lasted 43 days (no Fibonacci relationship), intermediate wave (B) lasted 88 days (just one day short of a Fibonacci 89), intermediate wave (C) lasted 53 days (just two days short of a Fibonacci 55) and intermediate wave (D) lasted 56 days (just one day more than a Fibonacci 55). So far intermediate wave (E) has lasted 20 days and is incomplete. It may complete in a total Fibonacci 34 days (give or take one day either side of this) or it may not exhibit a Fibonacci duration.
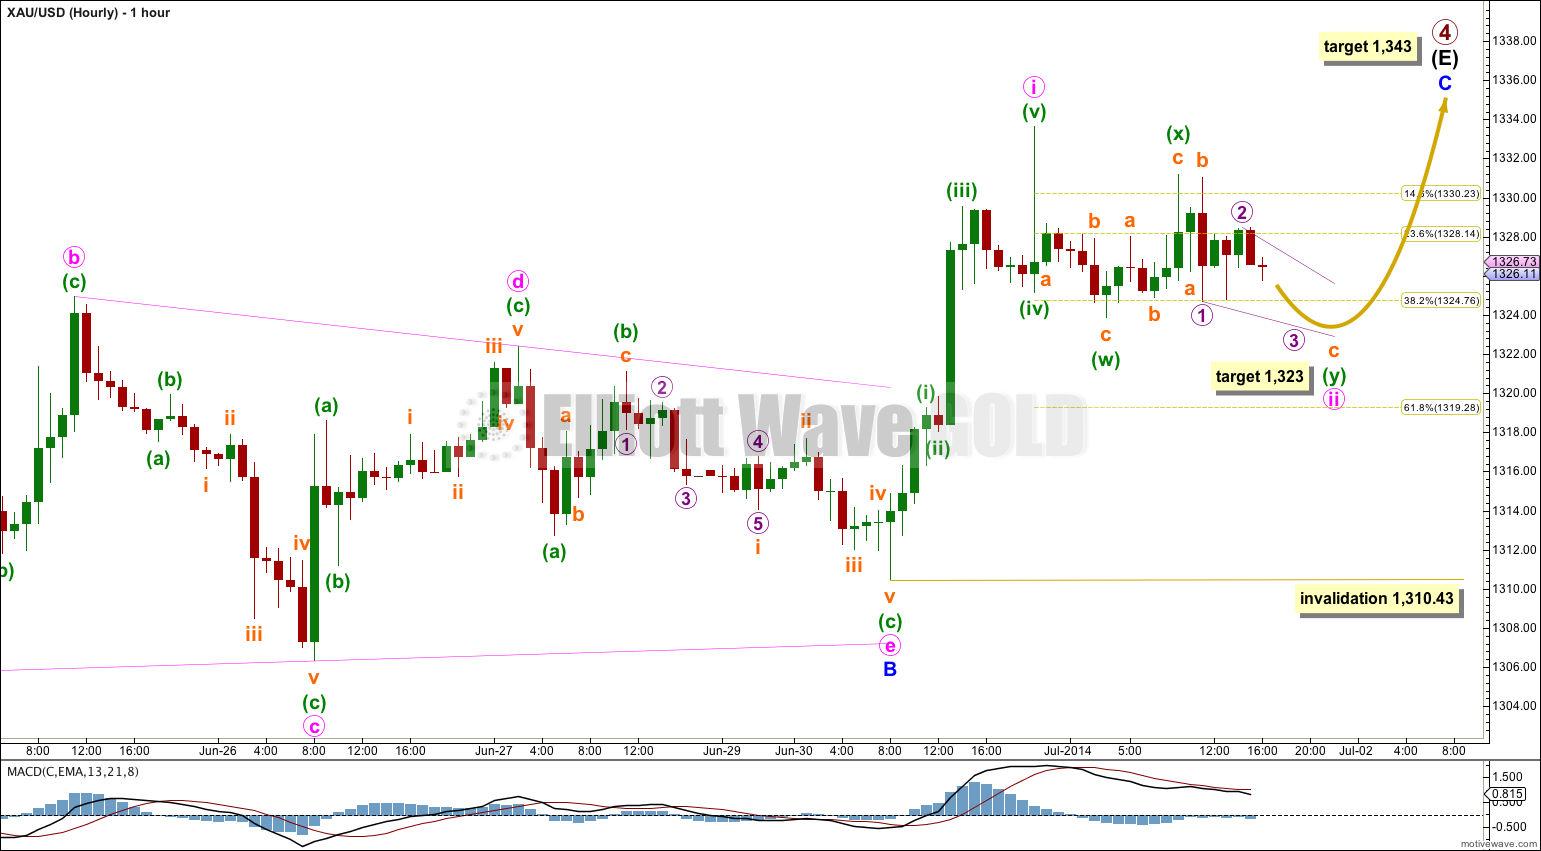
A sharp upwards spike completed a five wave structure upwards. This is followed by choppy overlapping movement which is very likely to be a second wave correction, and unlikely to be the start of a new impulse downwards.
Minute wave ii looks like it is unfolding as a shallow sideways moving double combination: zigzag – X – incomplete flat correction. At 1,323 subminuette wave c would reach 1.618 the length of subminuette wave a, and minuette wave (y) would end very slightly below the end of minuette wave (w). This would see minute wave ii move sideways, which is how combinations should move. I do not expect minute wave ii to move substantially lower at this point.
When minute wave ii is complete then I could calculate a target for you for minute wave iii upwards. I cannot do that yet. I would expect minute wave iii to most likely be about 14.33 in length, 0.618 the length of minute wave i.
Minute wave ii may not move beyond the start of minute wave i below 1,310.43.
If this wave count is invalidated with movement below 1,310.43 then my analysis of sideways movement labeled minute wave ii is wrong. Primary wave 4 would be over and primary wave 5 downwards would have begun.
This analysis is published about 05:52 p.m. EST.
Posted the same question under the post of 27th June but in other words. I would like to know this as well
The recent five wave up ( pink i wave ) may be the fifth wave to finish the blue A wave up. If so, we can have B wave down and C wave up still to come. Then we can have have Fibonacci 34 days for the E wave to complete the triangle 4th wave.
Can this be a viable alternative wave count???
I’m looking into it. You’re right. On the daily chart it looks like a five is complete. But the subdivisions have to fit.