
Again, more sideways movement is not enough to provide us with clarity. The main Elliott wave count still has about a 60% probability.
Summary: Upwards movement towards 1,350 is most likely. This would be confirmed with a break above 1,324.73. A break below 1,292.25 would indicate more downwards movement. While price remains between 1,324.73 and 1,292.25 the situation will remain unclear. In the short term a triangle is completing and the breakout should be downwards, but it may be brief and a “false” breakout.
Click on charts to enlarge.
Main Wave Count.
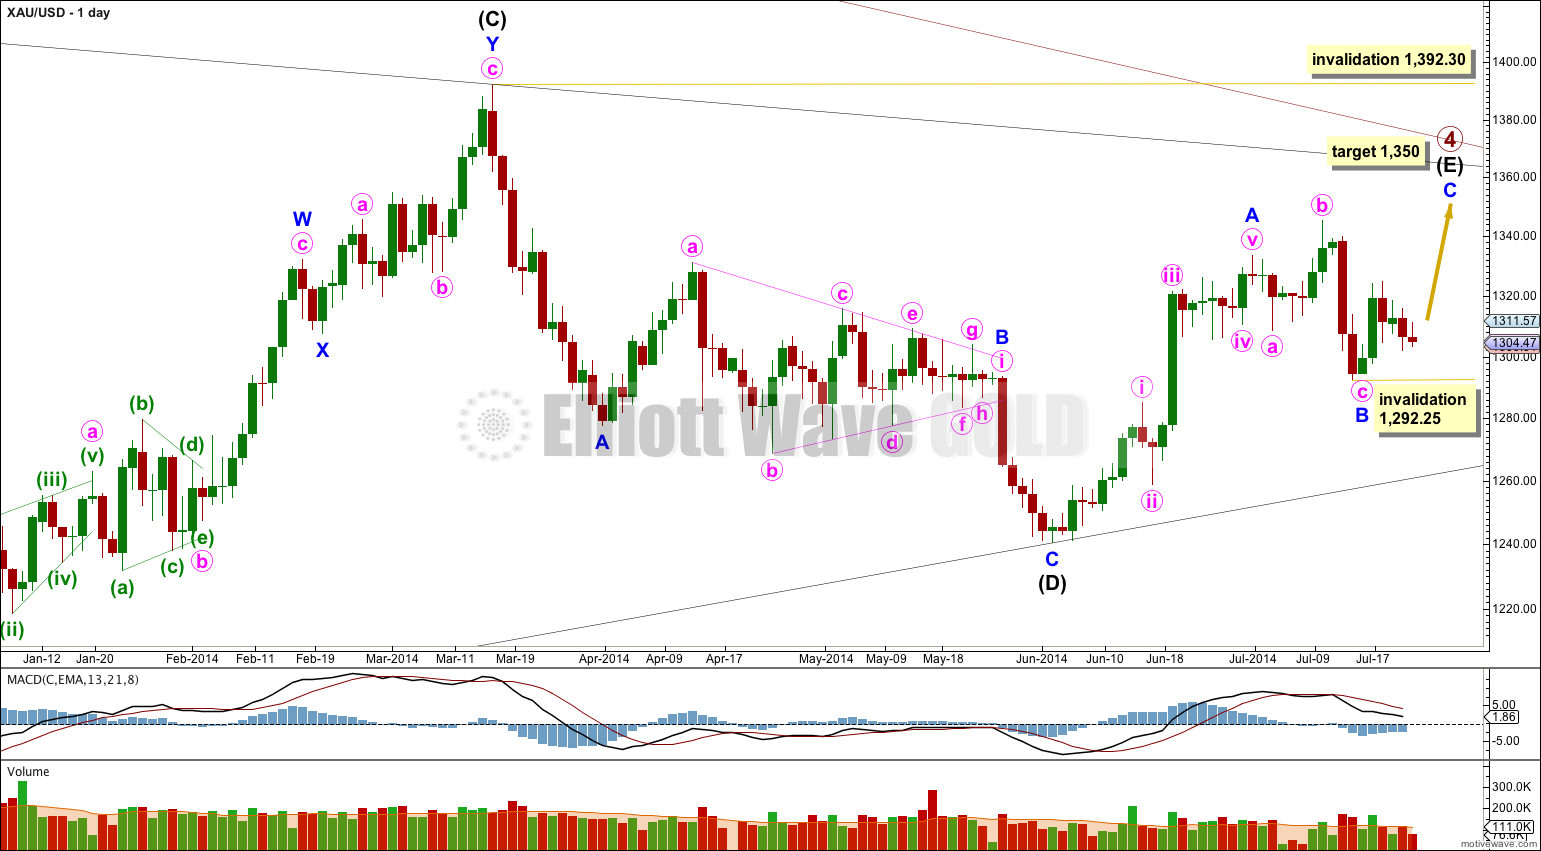
Primary wave 4 is an almost complete regular contracting triangle, now in its 56th week. If it ends within the next few days it will be close enough to a Fibonacci 55 weeks to exhibit a Fibonacci duration.
The final zigzag of intermediate wave (E) is still a few days away from completion. Within it minor wave B can be seen as a complete expanded flat. There is no Fibonacci ratio between minute waves a and c.
At 1,350 minor wave C would reach 0.618 the length of minor wave A. Minor wave C is extremely likely to at least make a new high above the end of minor wave A at 1,333.61 to avoid a truncation.
When minor wave C is a complete five wave structure then I will expect a primary degree trend change. Eventually a clear breach of the lower (B)-(D) trend line of this triangle will provide confirmation that primary wave 4 has ended and primary wave 5 has then begun.
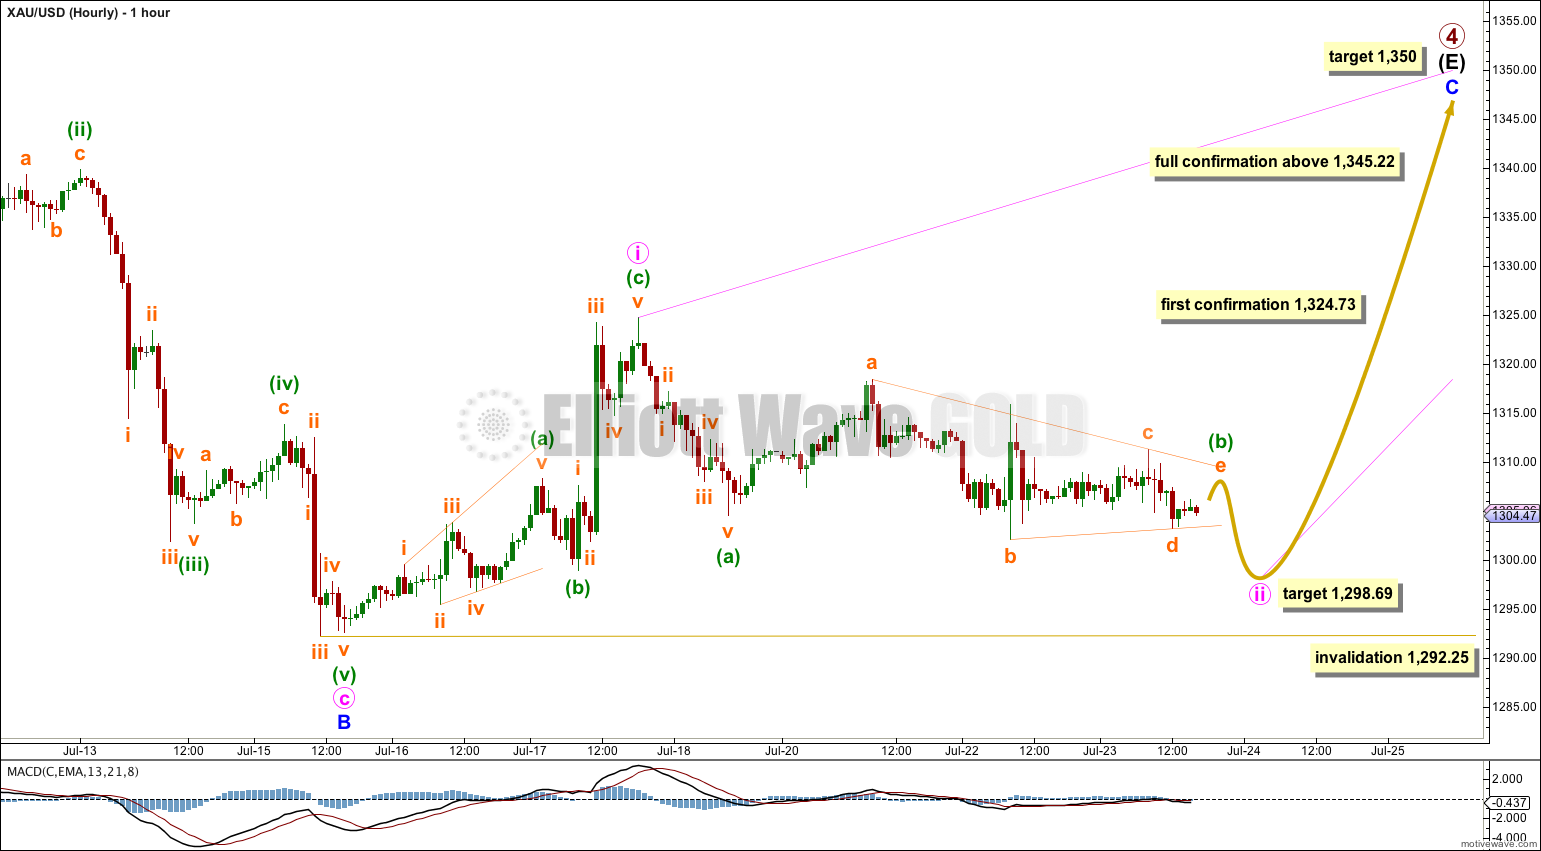
A triangle is unfolding, with MACD hovering nicely about the zero line. I expect this triangle is minuette wave (b) within minute wave ii zigzag.
The triangle only needs the final wave of subminuette wave e to end. If I have labeled the triangle correctly then subminuette wave e may not move beyond the end of subminuette wave c at 1,311.34. When price breaks below the end of subminuette wave d of the triangle at 1,303.21 then I would consider that confirmation the triangle is over and minuette wave (c) downwards is underway. The triangle looks like a barrier triangle because the b-d trend line is close to flat. This may indicate the breakout after the triangle will be sharp and brief.
Second and fourth waves of diagonals most commonly end between 0.66 to 0.81 of the prior wave. Minute wave ii would reach this range between 1,303.51 to 1,298.69. I would expect minute wave ii to most likely end at or above 1,298.69.
When minute wave ii is a completed zigzag then a third wave upwards should follow it. Although minute wave iii is a third wave within a diagonal, it is still a third wave so it should show some increase in upwards momentum. It is a third wave within an ending diagonal though so it must subdivide as a zigzag, and the zigzag should be very obvious.
Minute wave ii may not move beyond the start of minute wave i below 1,292.25.
Movement above 1,324.73 would invalidate the alternate below and provide me with a lot of confidence in the upwards target at 1,350.
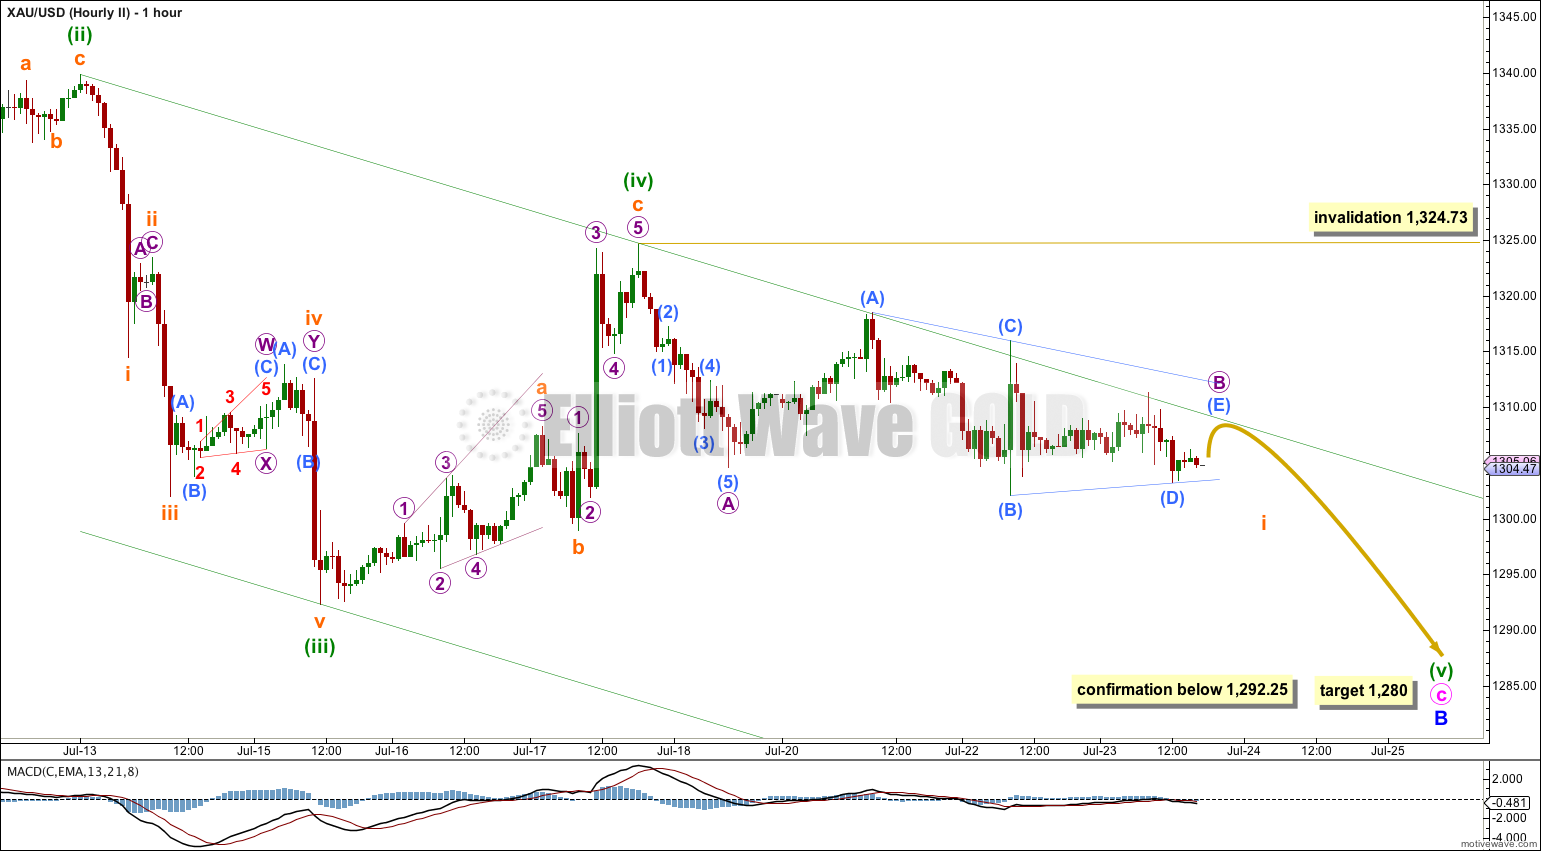
This second hourly chart considers the possibility that minor wave B downwards is incomplete. At this stage this alternate does not have as good a fit as the main wave count and would judge it to have a low probability, about 20%.
Minuette waves (ii) and (iv) are out of proportion: minuette wave (ii) lasted 25 hours and minuette wave (iv) lasted 53 hours. This gives the wave count a strange look and reduces its probability.
Minuette wave (v) may be only one of two structures: an impulse (most common) or an ending diagonal (less common).
So far downwards movement may be subdividing as a zigzag with micro wave B an incomplete triangle. At its end submicro wave (E) must end above 1,304.60 to effect a net retracement of micro wave A, but not above the end of submicro wave (C) at 1,315.94.
This alternate also expects price to break out downwards when the triangle is complete. Movement below 1,292.25 would invalidate the main hourly wave count above and confirm this alternate.
When fifth waves unfold as diagonals they are very rarely truncated. This second wave count would expect to see a new low below 1,292.25 as extremely likely.
If price breaks below 1,292.25 then this idea has a higher probability than the alternate daily wave count below. I would expect downwards movement to end about 1,280 where minute wave c would reach 2.618 the length of minute wave a.
Within minuette wave (v) ending diagonal subminuette wave ii may not move beyond the start of subminuette wave i above 1,324.73.
Alternate Wave Count.
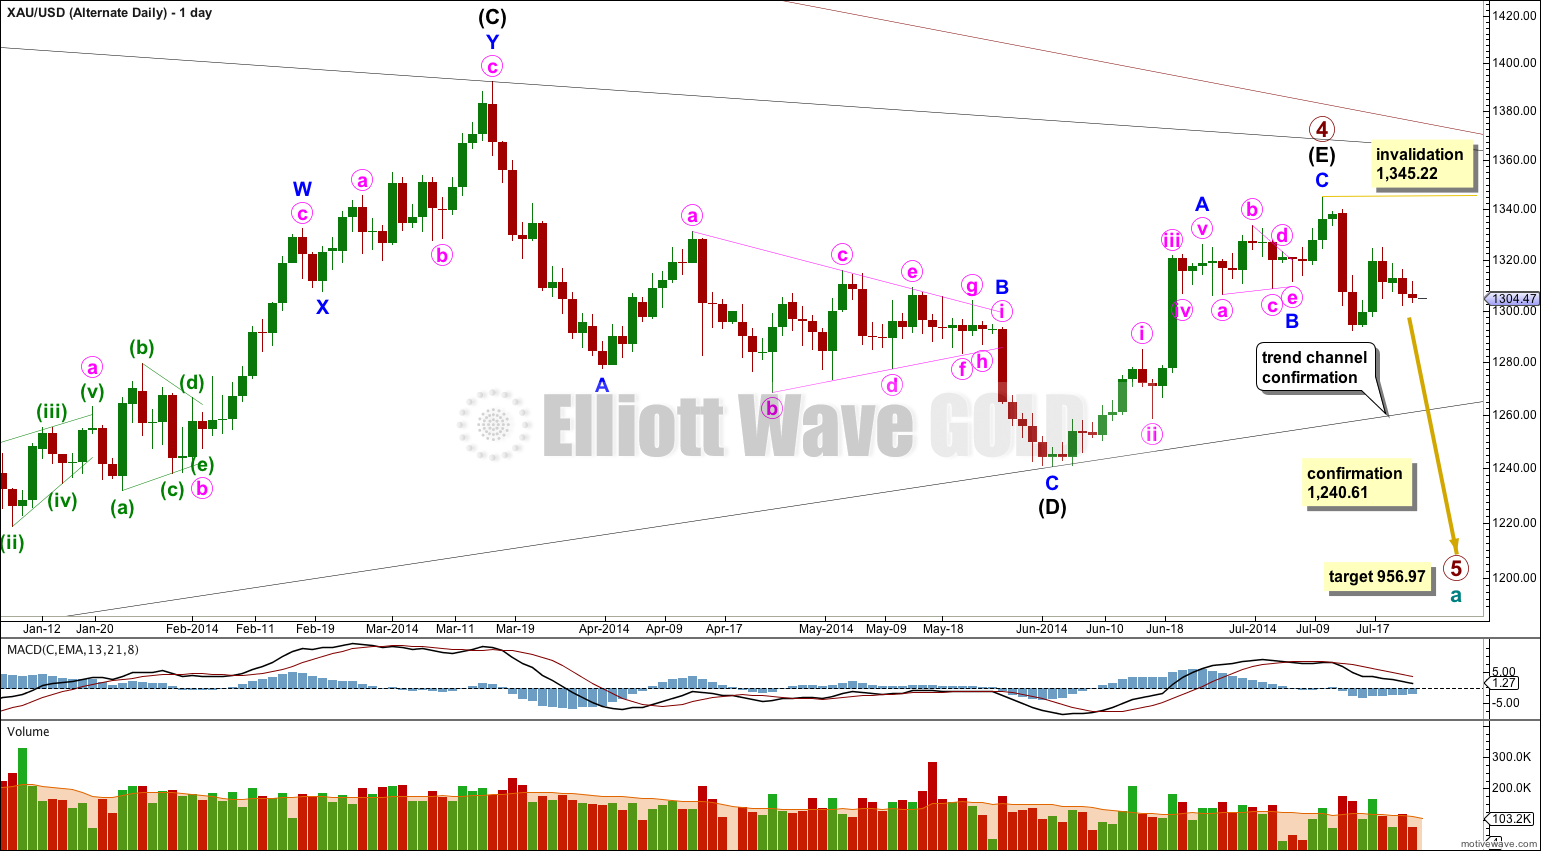
It is possible that primary wave 4 is complete in a total 54 weeks, just one short of a Fibonacci 55 and just one week longer than primary wave 2 which was 53 weeks in duration.
The subdivisions for this alternate do not have as neat a fit as the main wave count:
– The triangle for minor wave B has an overshoot of the b-d trend line within minute wave c which looks significant on the hourly chart.
– At the end of minor wave A minute wave v does not subdivide well as a five wave structure on the hourly chart. This movement fits better as a three.
– Minor wave C subdivides here as a five wave structure, but it has a much better fit as a zigzag (which is how the main wave count sees it).
For the three reasons above this alternate has a lower probability. I would judge it at this stage to have about a 10 – 20% probability.
The differentiating point is the lower (B)-(D) trend line here on the daily chart. If this trend line is breached by a full daily candlestick below it and not touching it then I would discard the main wave count and this alternate would be my only wave count.
At 956.97 primary wave 5 would reach equality in length with primary wave 1. Primary wave 1 was a remarkably brief three weeks in duration. Primary wave 5 could also be as brief, but it is more likely to show a little alternation and be longer lasting.
This analysis is published about 05:33 p.m. EST.
On a different matter, note that if this is a B wave now unfolding, minuette wave 5 should not exceed the length of minuette wave 3 (which from 1341 to 1292.5 is 48.5 points). Therefore, minuette wave 5 and minute wave B cannot go below 1277.5, which is approaching. This is useful as a stop and as an invalidation point.
Sorry, no.
The rule is a third wave may not be the shortest. In this case minuette wave (i) is the shortest at only 9.99. This means that there is actually no limit to the length for minuette wave (v). It may be longer than the third wave, and the rule will be met.
Of course. I realised my mistake later,not thinking it through properly at the time.
The thrust out of GDX …..looks like the completion of a B wave within an expanded flat. So since the high, we have, a leading diagonal for 1, and are in the process of completing B of an expanding flat. C would retrace deeply as leading diagonal corrections usually do.
Any thoughts? Anyone?