
Upwards movement was expected. A new high was made, but thereafter price has moved lower to complete a red candlestick for Tuesday’s session.
Summary: Downwards movement should be a second wave correction. When it is complete the upwards trend should resume with an increase in upwards momentum as a third wave up unfolds. The target remains at 1,340.
Click on charts to enlarge.
Main Wave Count.
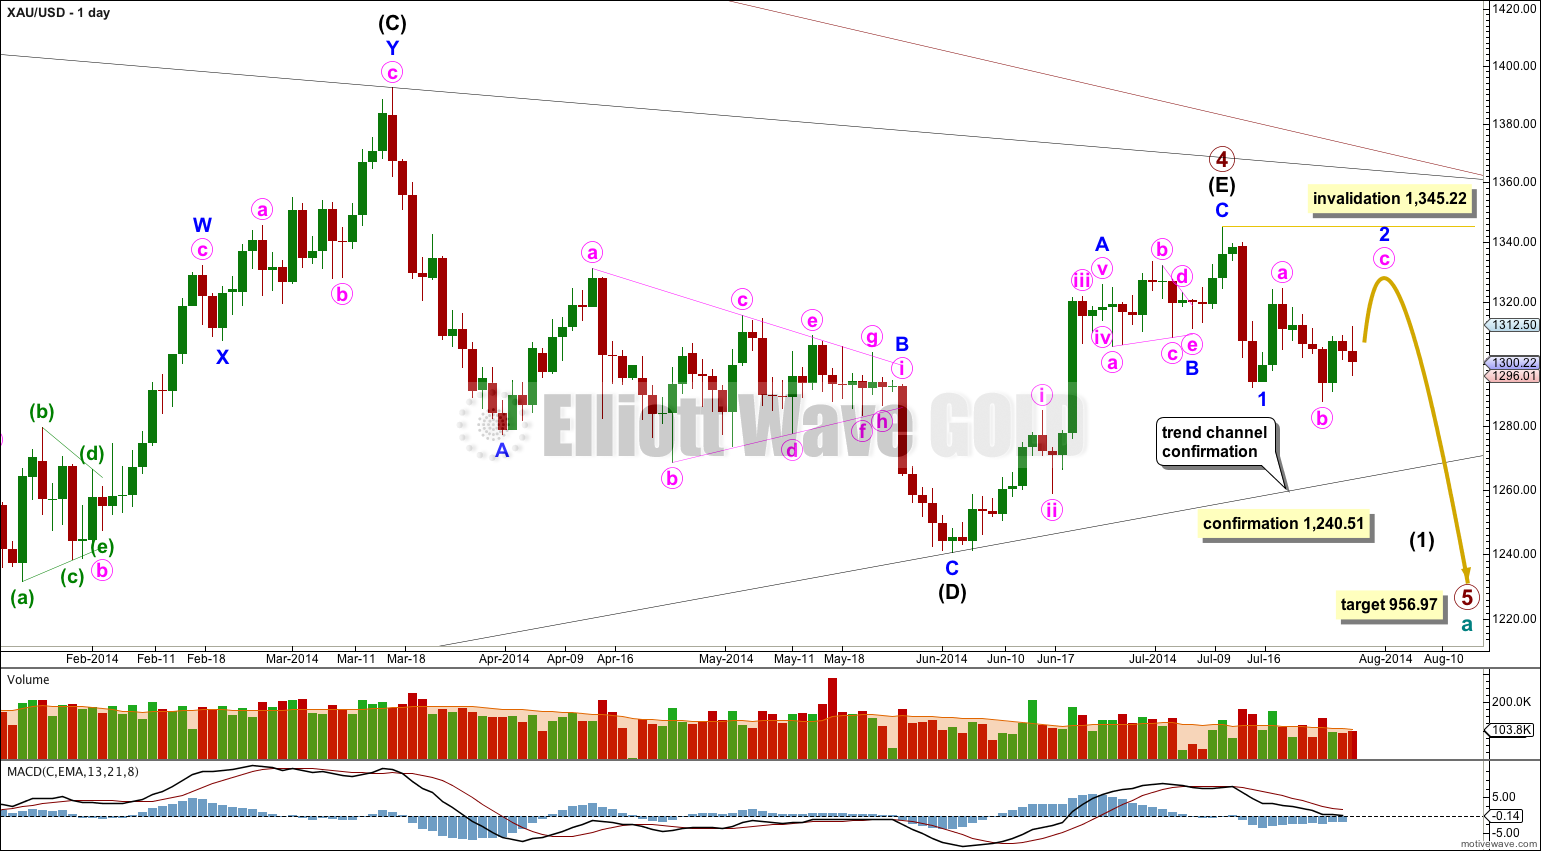
The main wave count sees primary wave 4 a complete regular contracting triangle lasting 54 weeks. Primary wave 2 was a deep 68% running flat correction. Primary wave 4 shows alternation in depth at only 27% and some alternation in structure.
Primary wave 3 is just 12.54 short of 1.618 the length of primary wave 1. At 956.97 primary wave 5 would reach equality in length with primary wave 1. This is the most common ratio for a fifth wave so this target has a good probability.
Primary wave 1 was remarkably brief at only three weeks duration. I would expect primary wave 5 to last longer, maybe five, eight or thirteen weeks.
Within the start of primary wave 5 minor wave 1 is a completed five wave impulse. Minor wave 2 is unfolding as an expanded flat correction. Minor wave 2 may not move beyond the start of minor wave 1 above 1,345.22.
When minor wave 2 is a complete structure then the next movement should be a strong third wave down for minor wave 3. At this stage minor wave 2 is incomplete. Minute wave a lasted two days, and minute wave b lasted four days. Minute wave c is extremely likely to at least make a new high beyond the end of minute wave a above 1,324.73 to avoid a truncation and a very rare running flat. Minute wave c so far has lasted three days and looks like it will be more time consuming than initially expected, to last longer than minute waves a or b. It may end in a total Fibonacci eight days, which is in another five days time.
Eventually a full daily candlestick below the (B)-(D) trend line would increase the probability of this main wave count to over 90%. I would have full confidence in it with a new low below 1,240.51.
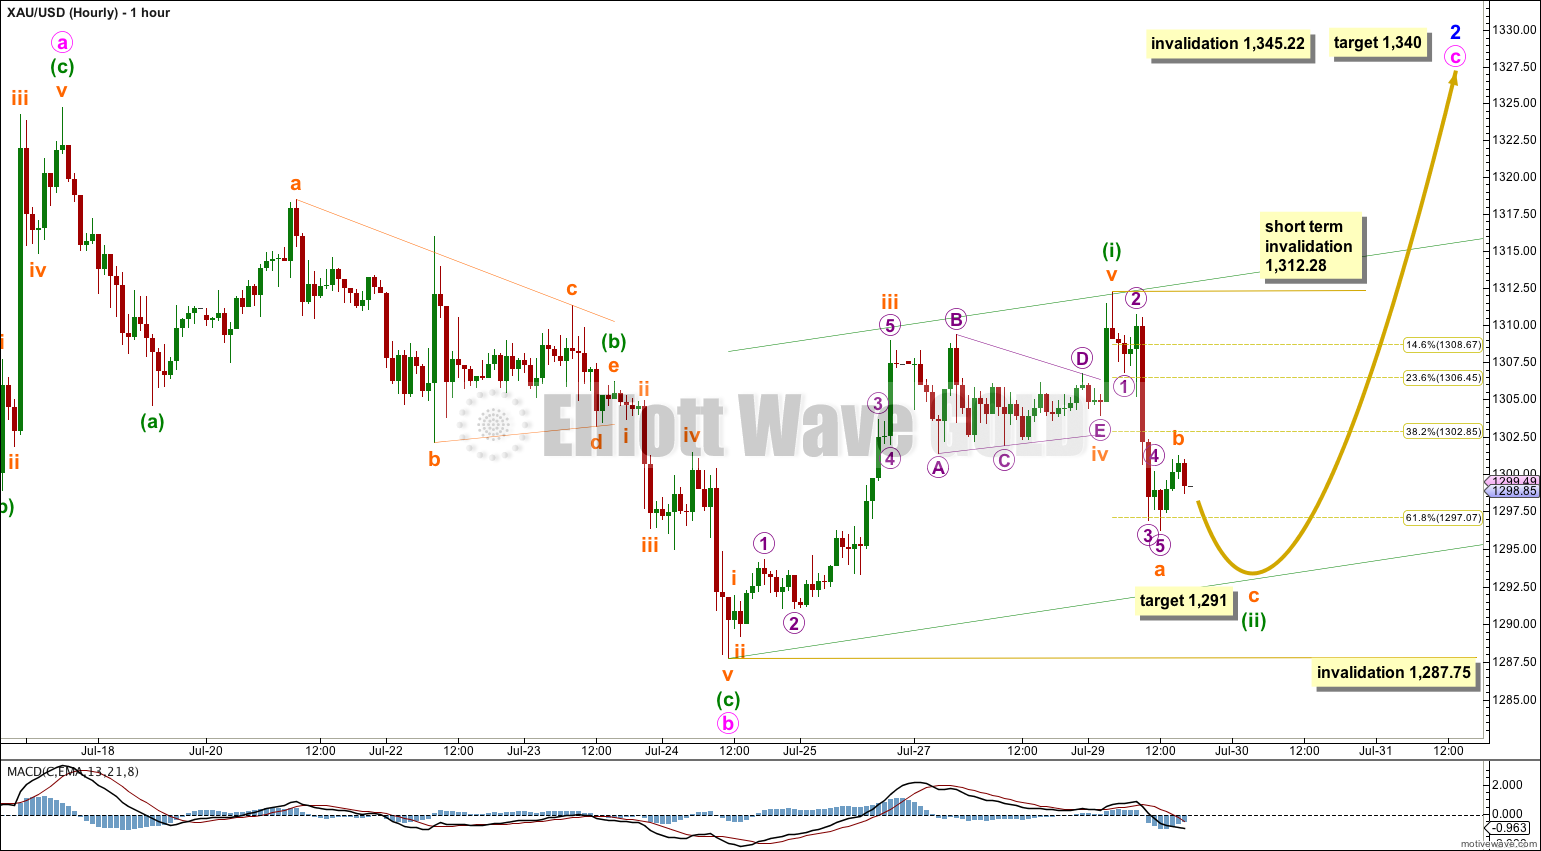
The triangle completed and an upwards thrust followed as expected. However, the upwards movement was expected to be a lot longer, but was remarkably short lasting only two hours. This completed a five wave impulse upwards, but it is not the entirety of minute wave c. I have moved the degree of labeling within this movement down one degree and as labeled this is only minuette wave (i).
Technically, the subdivisions fit for minor wave 2 to be over as a complete running flat, as a few members have suggested. However, the few running flats I have seen over the years have C waves which are only slightly truncated. I have never seen a running flat with a substantially truncated C wave, and I would never accept a wave count with such a structure. The probability is so very low it should not be considered.
Minuette wave (ii) is so far a very deep correction and the structure is incomplete. Within it subminuette wave b may move higher, but because subminuette wave a subdivides as a five subminuette wave b may not move beyond its start above 1,312.28.
If subminuette wave b is complete here, which I think is quite likely, then at 1,291 subminuette wave c would reach 0.618 the length of subminuette wave a. This would complete a three wave zigzag downwards for a deep second wave correction.
When minuette wave (ii) is over then a strong third wave upwards should show a clear increase in upwards momentum. Minuette wave (iii) would most likely be 1.618 the length of minuette wave (i) at $37, and should have the power to break through the upper edge of the base channel drawn about minuette waves (i) and (ii).
When minuette wave (ii) is complete then redraw the base channel: from the start of minuette wave (i) to the end of minuette wave (ii) then place a parallel copy on the end of minuette wave (i).
Minuette wave (ii) may not move beyond the start of minuette wave (i) below 1,287.75. If this price point is breached I will use the second alternate below, which has the lowest probability of the three wave counts today.
At this stage I would judge this main wave count to have about a 60% probability.
Alternate Daily Wave Count.
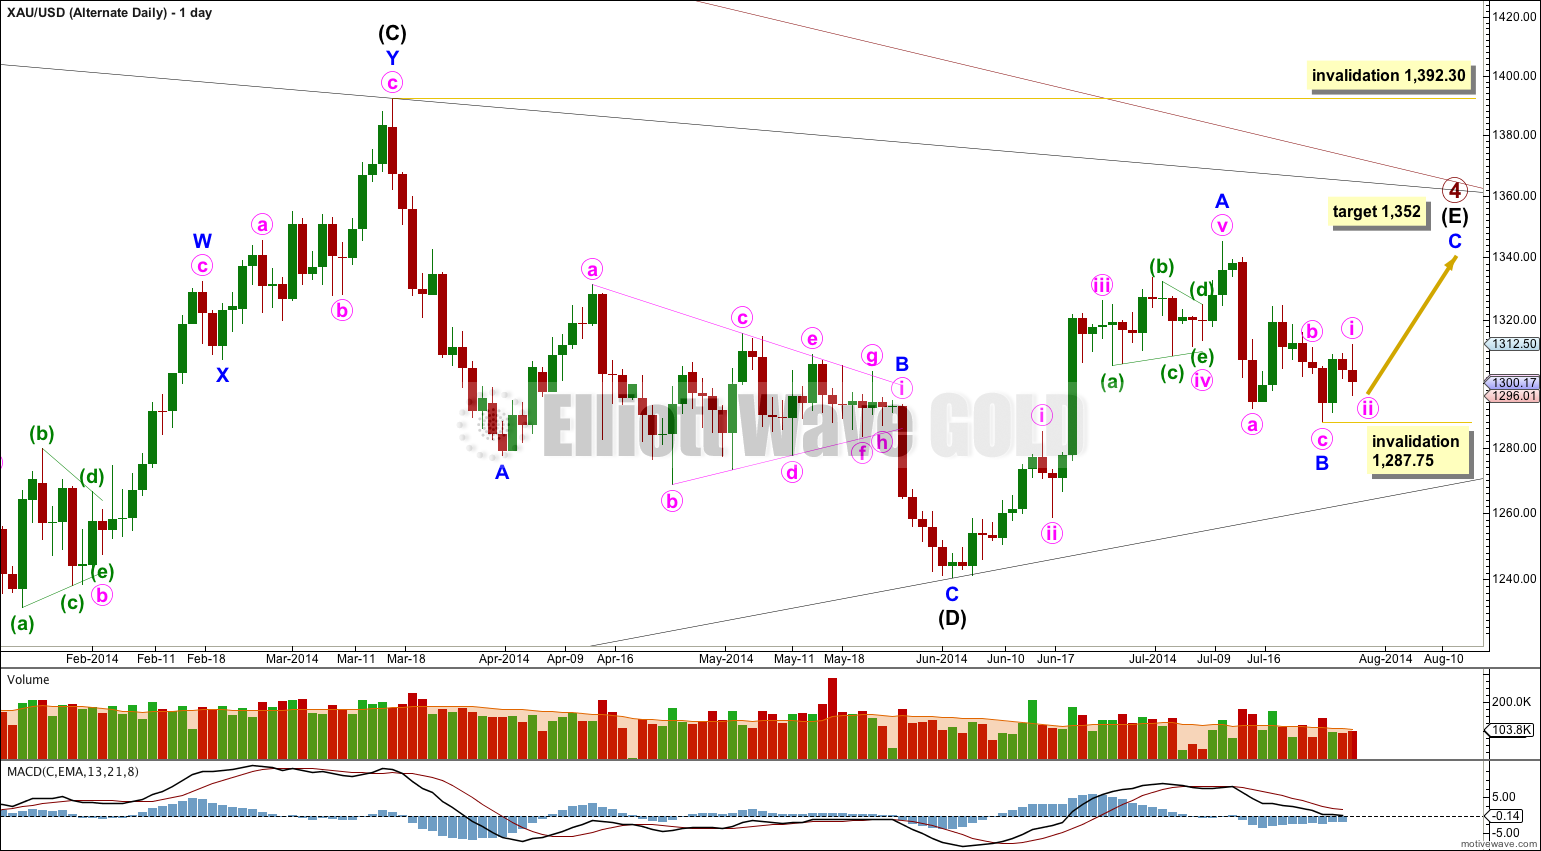
It is still possible that intermediate wave (E) is an incomplete zigzag and so the triangle of primary wave 4 is incomplete.
I have checked the subdivisions within minor waves A and B and this wave count has a good fit. It has a reasonable probability and would judge it to be about 30% at this stage. My only problem with it, and the reason for it still being an alternate, is the lack of proportion between minute waves ii and iv within minor wave A: minute wave ii is a brief zigzag lasting only one day and minute wave iv is a triangle lasting 10 days. Although triangles are more long lasting than zigzags, so some disproportion would be expected, this lack of proportion is high and reduces the probability of this wave count. The main wave count does not have this problem and so has a higher probability.
Minor wave B downwards so far looks like a very clear three wave structure on the daily chart. It subdivides perfectly as a zigzag on the hourly chart.
Minor wave C is extremely likely to make at least a slight new high above the end of minor wave A at 1,345.22 to avoid a truncation and a very rare running flat. At 1,352 minor wave C would reach 0.618 the length of minor wave A.
Within minor wave C minute wave ii may move beyond the start of minute wave i below 1,287.75.
Intermediate wave (E) may not move beyond the end of intermediate wave (C) above 1,392.30.
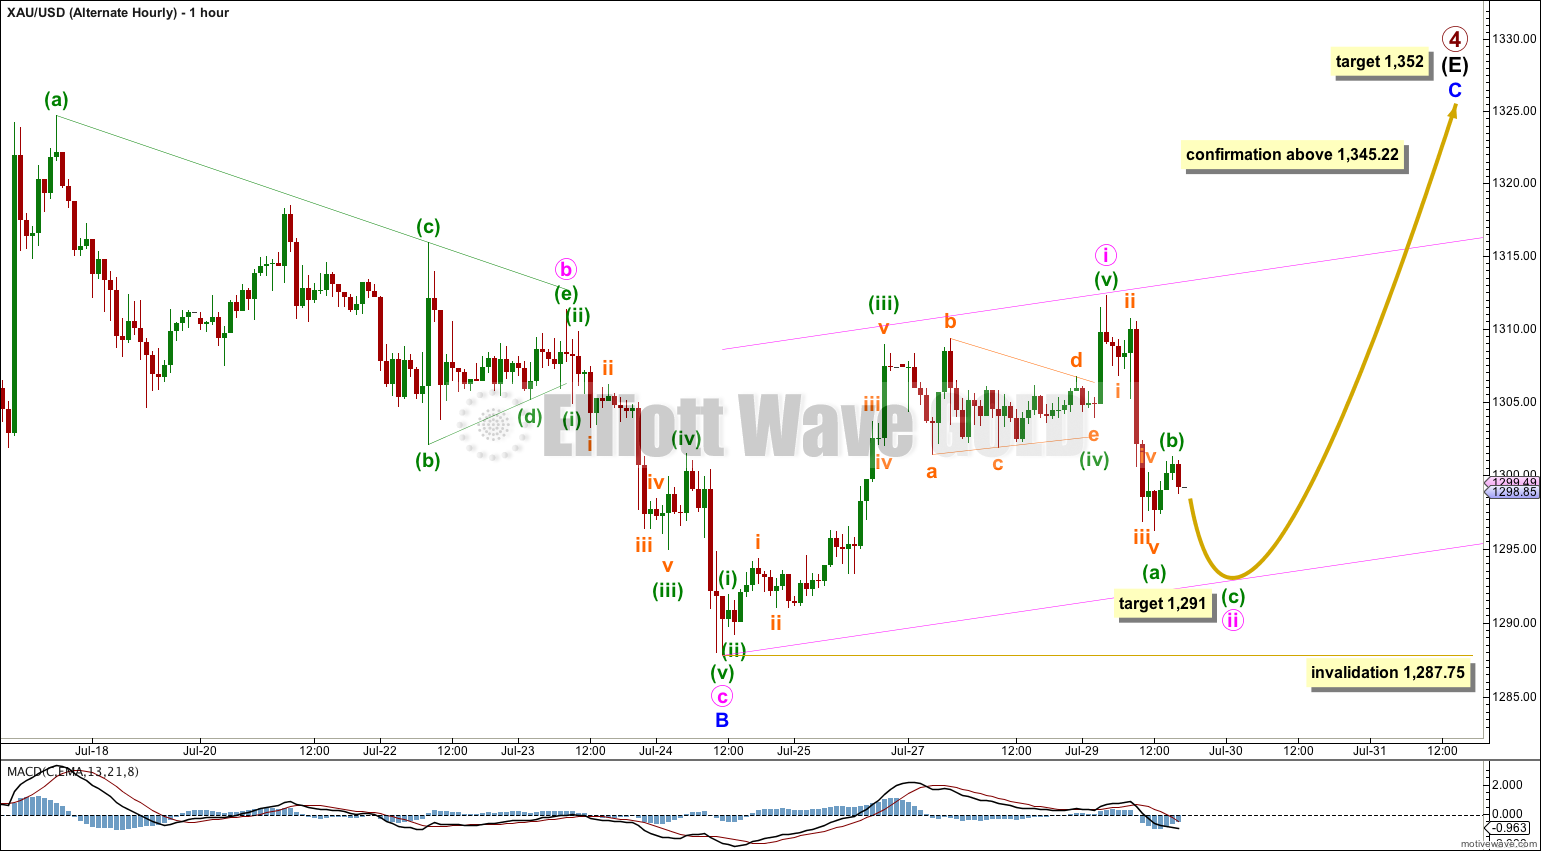
The subdivisions within most recent upwards movement are seen in exactly the same way for this alternate as for the main wave count, so the only divergence between the two today is in the final upwards target.
Movement above 1,345.22 would invalidate the main and second alternate wave counts and provide strong confirmation for this wave count.
Second Alternate Daily Wave Count.
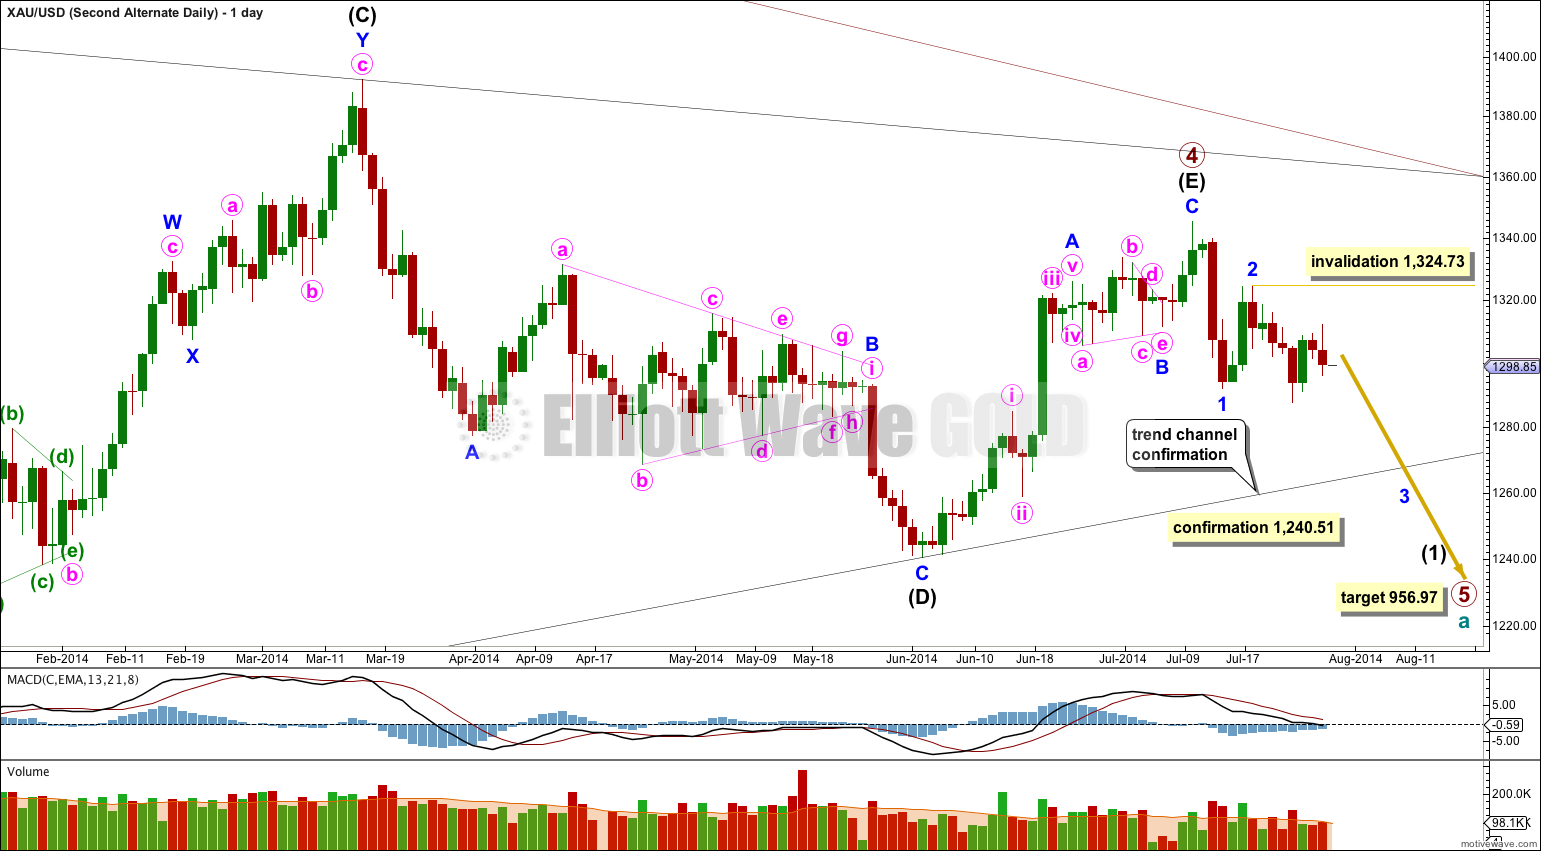
I will consider the possibility that minor wave 2 was over at the high of 1,324.73 as a brief zigzag ending just short of 0.618 the length of minor wave 1. This is possible, and it has a higher probability than seeing minor wave 2 as a rare running flat with a substantially truncated C wave.
If minor wave 3 has begun there then within it minute wave i must be unfolding as a leading diagonal. Leading diagonals in first wave positions are not rare, but they are not exactly common either. This slightly reduces the probability of this second alternate wave count.
This wave count would be confirmed with movement below 1,287.75. At that point both the main and first alternate wave counts would be invalidated.
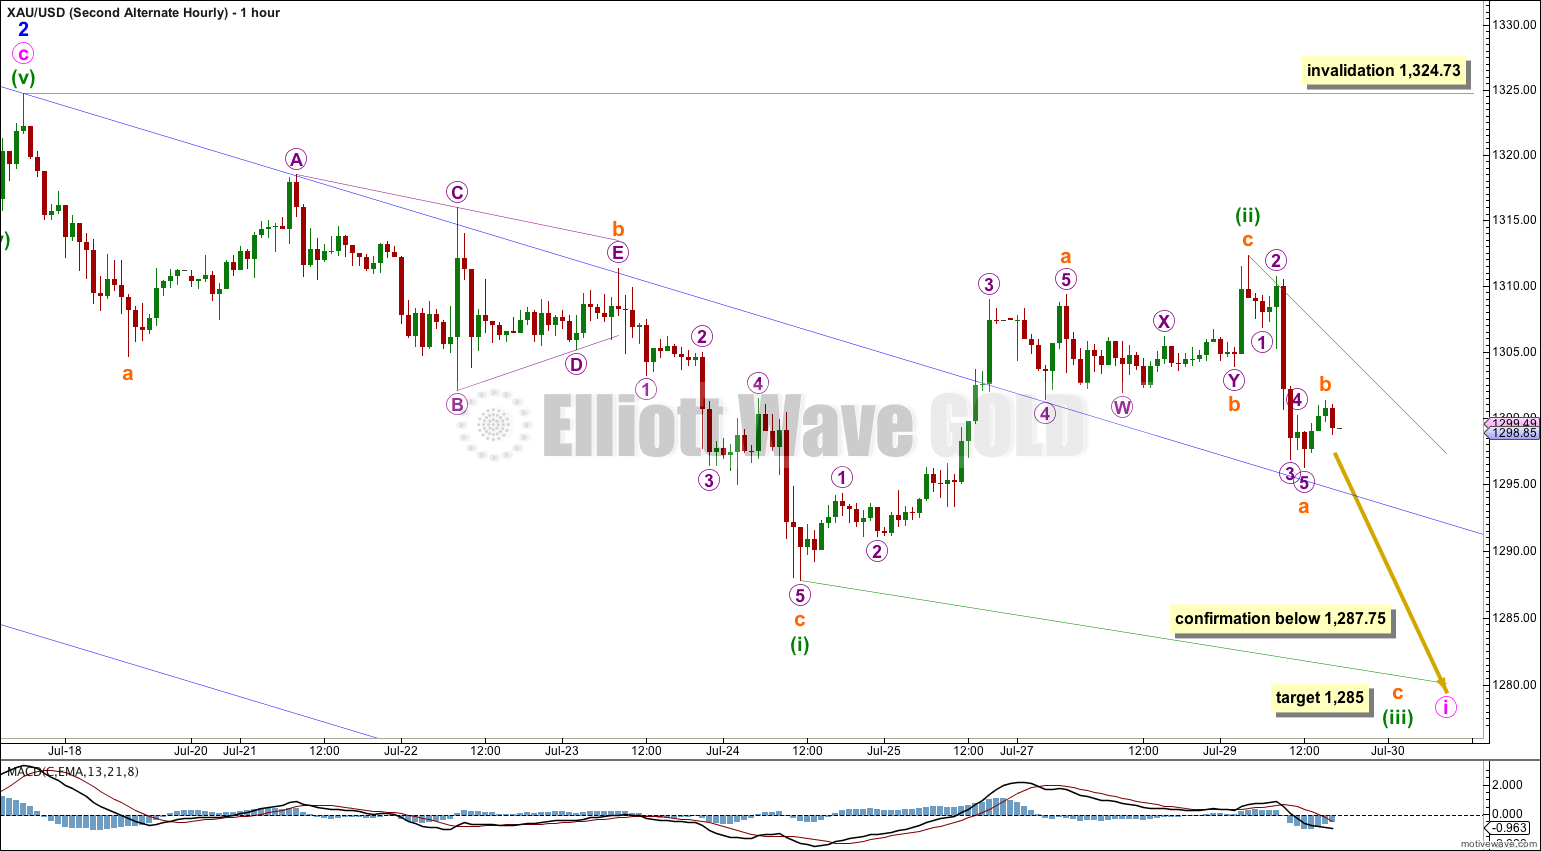
The downwards movement labeled minuette wave (i) can only be seen as a zigzag. This means that minute wave i must be unfolding as a leading diagonal.
Within a leading diagonal subwaves 2 and 4 may only subdivide as single zigzags. Subwaves 1, 3 and 5 (the actionary waves) most commonly subdivide as zigzags but sometimes they may subdivide as impulses.
Minuette wave (ii) must make a new low below the end of minuette wave (i). At 1,285 subminuette wave c would reach equality in length with subminuette wave a.
In trying to see minuette wave (ii) as a zigzag rather than an impulse we encounter problems with the subdivisions. Subminuette wave a subdivides nicely as a five wave impulse, but thereafter subminuette wave b does not subdivide as a triangle. I am confident that a triangle unfolded in that position, so this wave count looks wrong and its probability is substantially reduced.
Subminuette wave b may be a sideways moving double combination, but the second structure for micro wave Y is a very rare running flat. This further reduces the probability of this second alternate wave count.
The dark blue channel is a base channel about minor waves 1 and 2: draw the first trend line from the start of minor wave 1 (which you see on the daily chart) to the end of minor wave 2, then place a parallel copy on the end of minor wave 1 (which again is seen on the daily chart). Lower degree second waves should not breach the base channel drawn about a first and second wave one or more degrees higher. Minuette wave (ii) clearly and strongly breaches this base channel. This further reduces the probability of this second alternate wave count. I would judge it to have only about a 10% probability.
This analysis is published about 06:03 p.m. EST.
So Lara, I just want to make sure I’m understanding your main wave analysis: If Primary Wave 5 down has started, 1340 is the maximum target Wave 2 can bounce back, because anything higher than that would be over the point where Wave 1 started. However, if it does go higher than 1340, the alternate count is back in play which assumes that Wave 4 may not be finished yet. Am I reading that right?
No. Minor wave 2 can correct right up to the start of minor wave 1. It cannot move beyond the start of 1 above 1,345.22. Only movement beyond the invalidation point would invalidate the wave count.
That’s how invalidation points work; they can be touched, but any movement, even the tiniest fraction BEYOND an invalidation point invalidates the wave count. Its an important distinction.
If price moves above 1,345.22 the first alternate is in play. That is the confirmation point on the first alternate hourly chart.