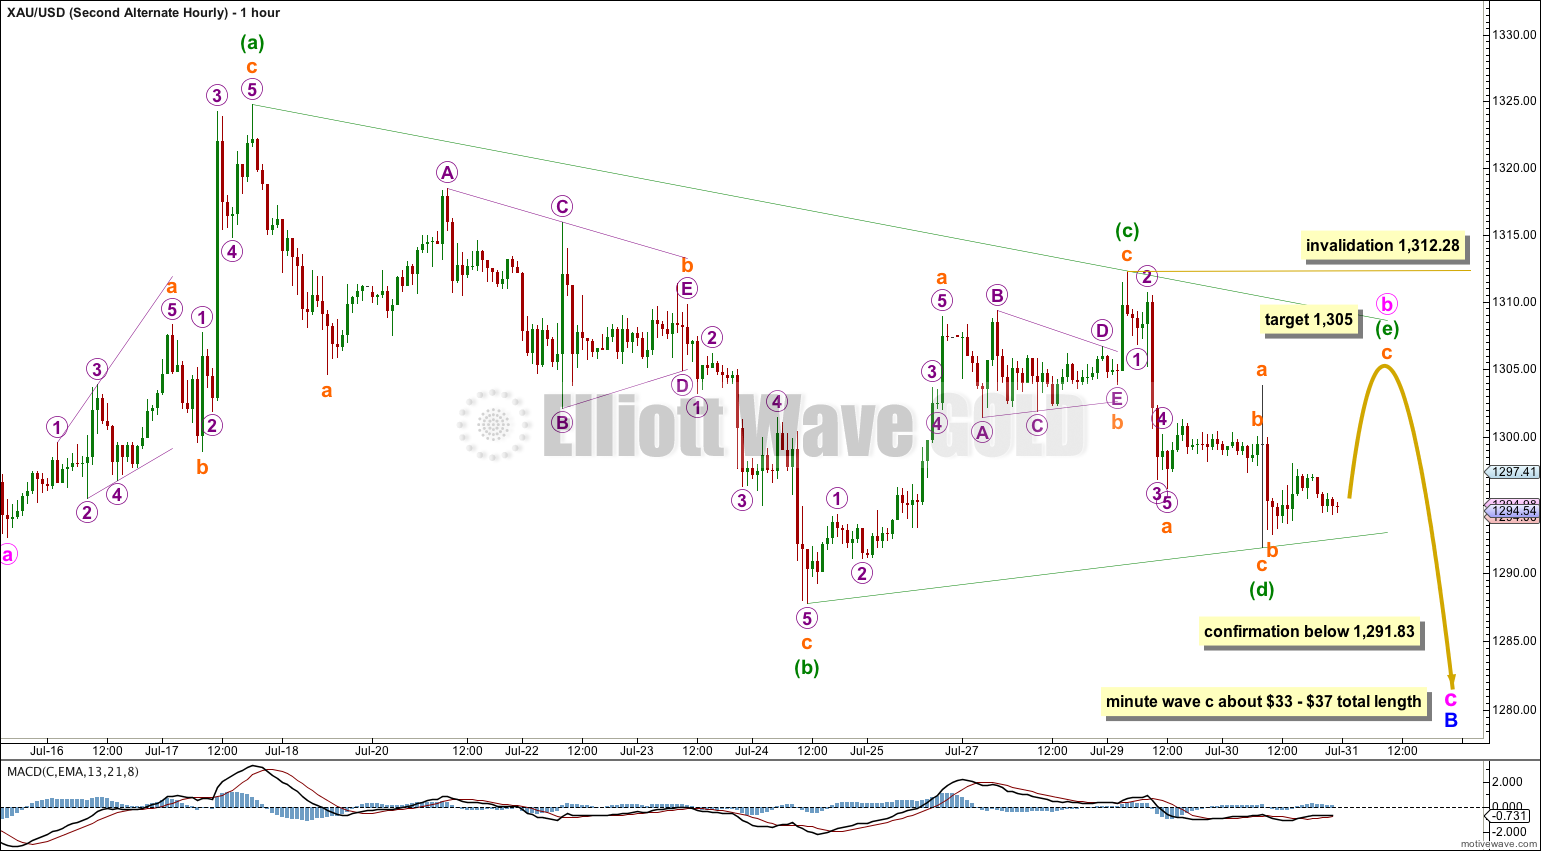
Thanks to Jaf for pointing this error out to me.
The first alternate hourly wave count has an error in the analysis of minuette wave (e). It makes a slight difference to the target calculation. Within that zigzag subminuette wave a ends higher, so at 1,305 subminuette wave c would reach equality in length with subminuette wave a.
The rest of the analysis today remains the same. Updated chart below.


His name is familiar, but I’m not familiar with his work.
To be honest, I rarely look at other analysts work. I used to find that when I did that it would “skew” my own perception and affect my analysis.
I really only look at wave counts that members give me links to or charts uploaded here. I try to be as objective and removed as possible.
I rarely read financial news too, mostly for that reason.
Thank you. I believe your commitment to independent analysis is a real strength and a big value to us subscribers.
Maybe the point labeled subminuette a may have completed the small hourly triangle. Minute C and Minor B may be complete at approx 1281 and we are starting Minor C up to complete the large triangle and Intermediate 4.
I think I have a better fit. To be published momentarily…
What about the idea that primary 4 is finished and the corrective wave two was a running flat? Now we may be in strong third wave down – which may break the $1280 support level.
Nope. See my answer to Jaf. The probability is just too low for me to publish that idea.
Could this long legged doji have served as both “d” and “e”?
With todays break to the bottom it makes the triangle look incomplete. Perhaps we are in wave 5 down?
Picture this from the high… impulse down as “wave one” and then a rare running flat as two?
I view running flats as an indication of impatience or urgency to get on with a move or direction. Maybe the urgency and impatience to break down out of this triangle and get on with wave five warrants a running flat?
I know I’m sick & tired of this move..
Yes, the doji on the hourly chart is both d and e of the triangle.
No I would never consider a running flat with a substantially truncated C wave. It is so very rare, the probability is so minuscule. That is a mistake that analysts new to Elliott wave may make, and I do see wave counts with a lot of running flats which look like that, but I’m not going to go there.
By the way, are you familar with Elliott analysis done by Avi Giburt? He has a big following in Seeking Alpha website. His outlook is quite similar to yours. http://seekingalpha.com/author/avi-gilburt