
The hourly wave count was invalidated with movement below 1,310.43. As stated in yesterday’s Elliott wave analysis a breach of this invalidation point may be significant at primary wave degree.
Summary: At this stage I expect it is likely primary wave 5 downwards began two days ago. The target is 945.36 which could be met in as little as three weeks. However, there is a viable alternate idea which expects more upwards movement first. I will use confirmation / invalidation points to determine which wave count is correct and we may have clarity quickly, or in a few days time. Movement above 1,325.17 would indicate primary wave 4 is incomplete. Movement below the (B)-(D) trend line on the daily chart would provide confidence that primary wave 5 downwards is underway.
Click on charts to enlarge.
Main Wave Count.
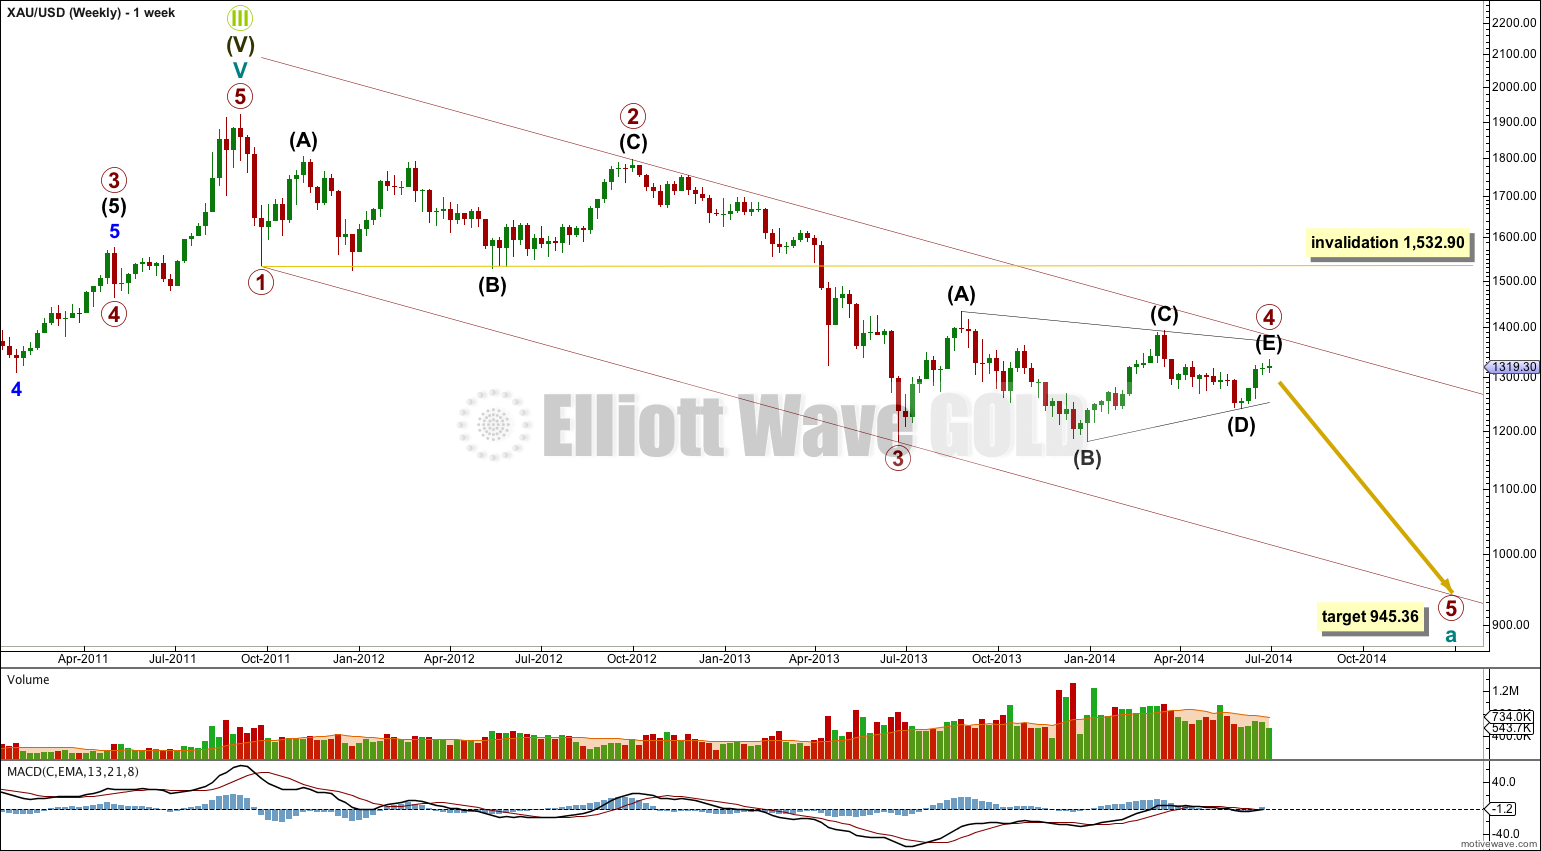
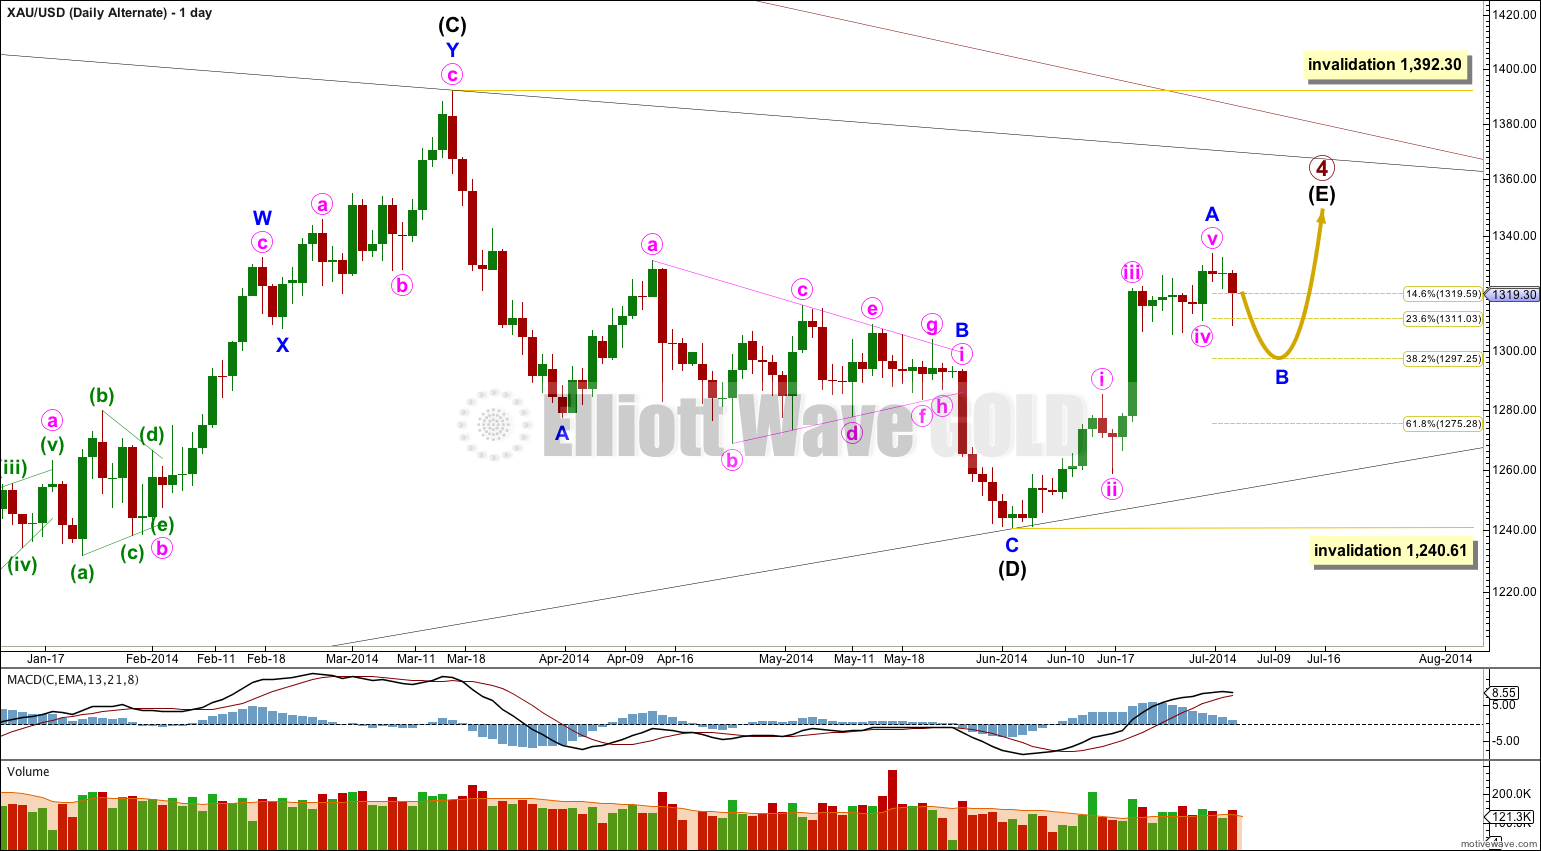
It is possible that primary wave 4 ended just a few days ago. The triangle structure is either complete here, or very close to completion.
Primary wave 4 is a shallow regular contracting triangle, showing perfect alternation with the deep running flat of primary wave 2. Primary wave 2 lasted 53 weeks (just two short of a Fibonacci 55). If primary wave 4 is over now it would be equal in duration at 53 weeks. If it continues a little longer it may be over in two more weeks at a Fibonacci 55 total.
If primary wave 4 is over then at 945.36 primary wave 5 would reach equality in length with primary wave 1. Primary wave 1 lasted just three weeks. Primary wave 5 could be equal in duration, or it may last longer. It may find support at the lower edge of the parallel channel drawn here, in which case it would be more long lasting.
Primary wave 4 may be a complete regular contracting triangle.
Intermediate wave (E) may have ended in just 20 days, one short of a Fibonacci 21. E waves of triangles are often short and brief, and this one looks reasonably typical.
Within primary wave 5 downwards no second wave correction may move beyond the start of its first wave above 1,333.61. Any movement above this point would immediately invalidate this main wave count and clearly confirm the alternate.
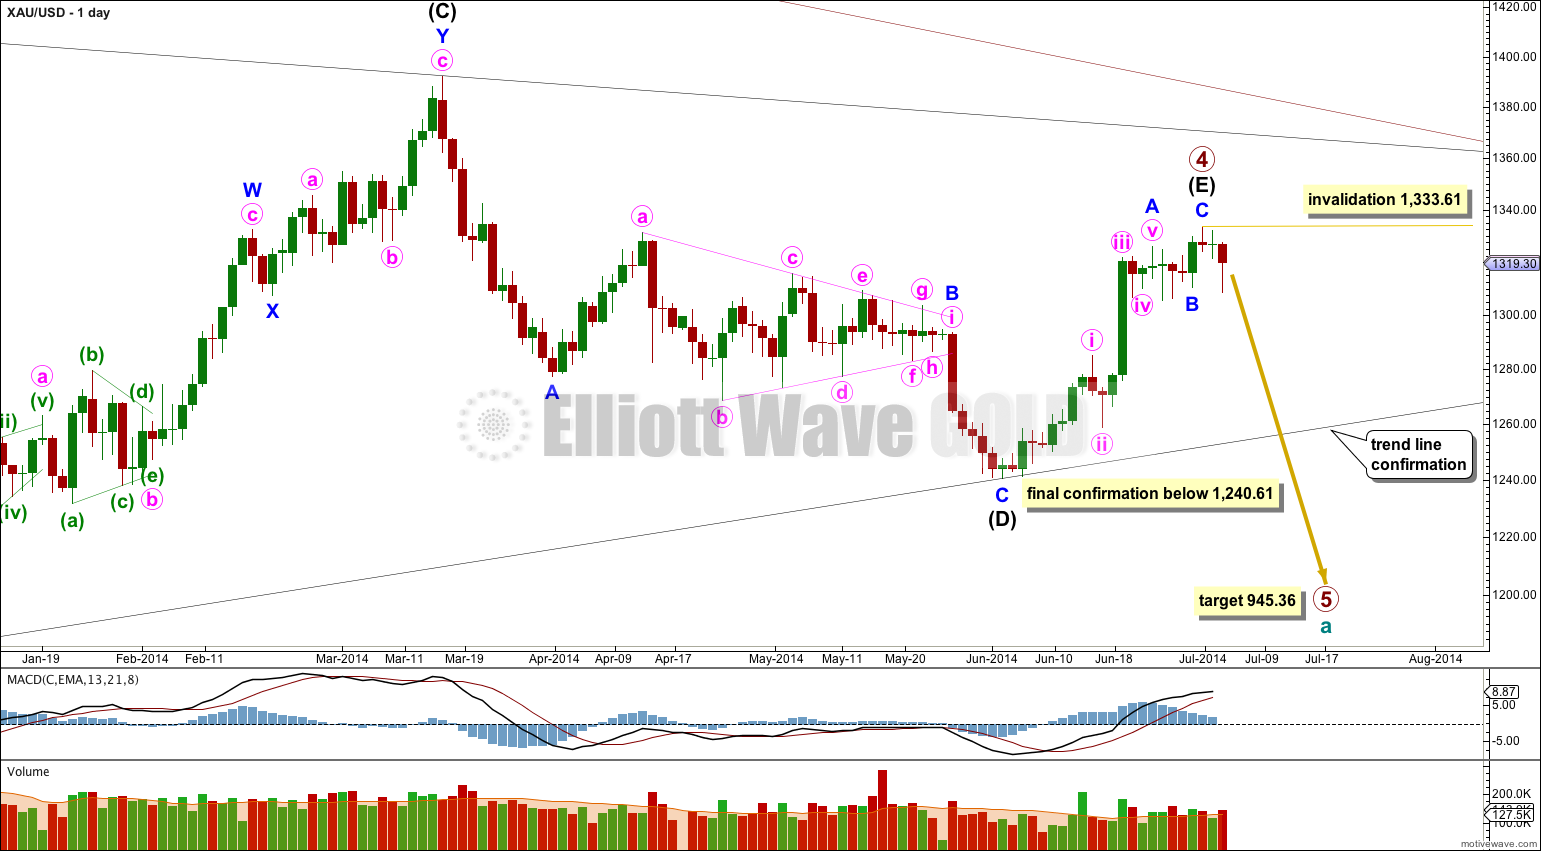
A clear breach of the (B)-(D) trend line would provide confidence in this main wave count. Thereafter, full confirmation would come with price movement below 1,240.61.
The key difference between this main wave count and the alternate below is the structure of this piece of movement. This main wave count has a better fit and better overall look, and so it is my judgement that it has a higher probability than the alternate. I would judge this main wave count to be about 60 – 70% likely.
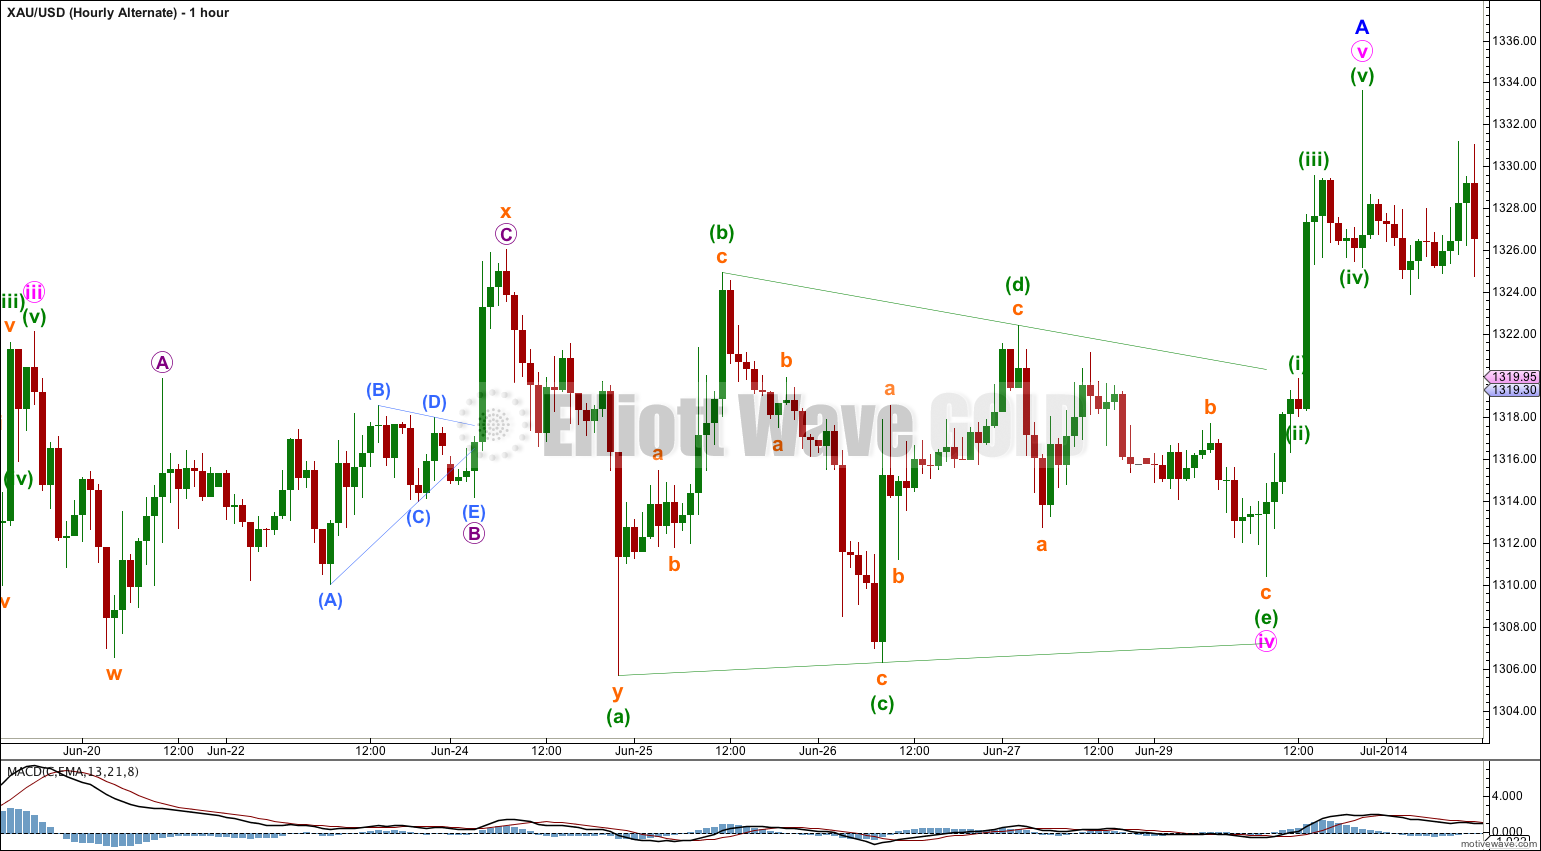
Minute wave iv regular contracting triangle of minor wave A lasted two days (a Fibonacci 55 hours) where minute wave ii lasted 29 hours. Minute wave iv is longer in duration than minute wave ii, but overall they are still in proportion.
Minor wave B is also a regular contracting triangle lasting four days, 95 hours. It is rather brief for a minor degree B wave, but that’s okay considering its within an E wave of a larger triangle.
Minor wave C is very brief and that’s okay too. Final waves out of triangles are often very brief, and can be more brief than expected and surprise us (we’ve been there before). Minor wave C has no Fibonacci ratio to minor wave A which is not unusual for A and C waves in Gold.
Within minor wave A minute wave iii has no Fibonacci ratio to minute wave i, and minute wave v is 1.33 longer than 0.236 the length of minute wave i.
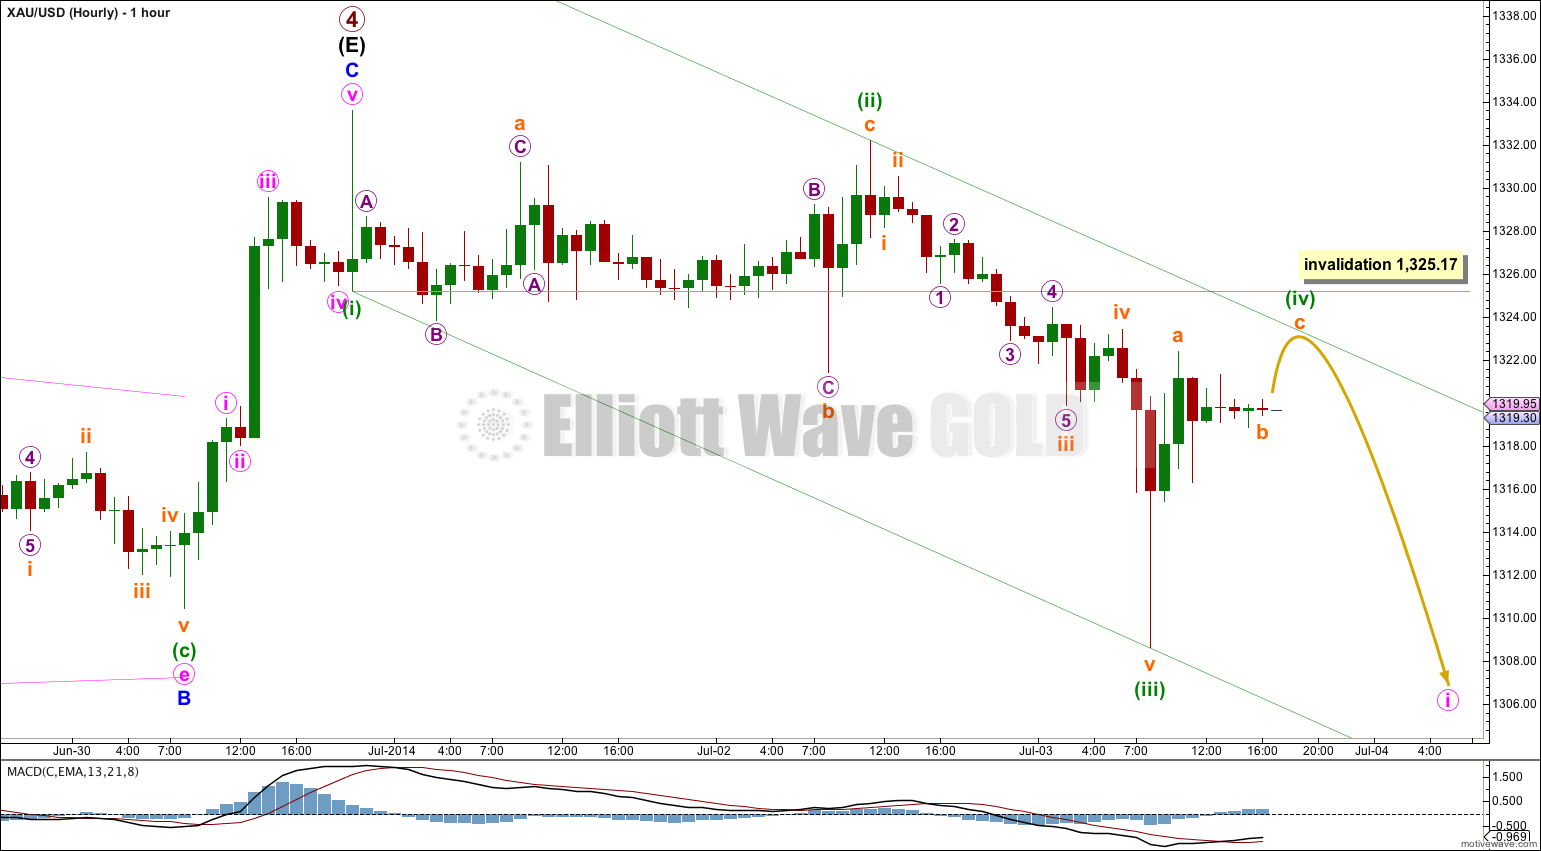
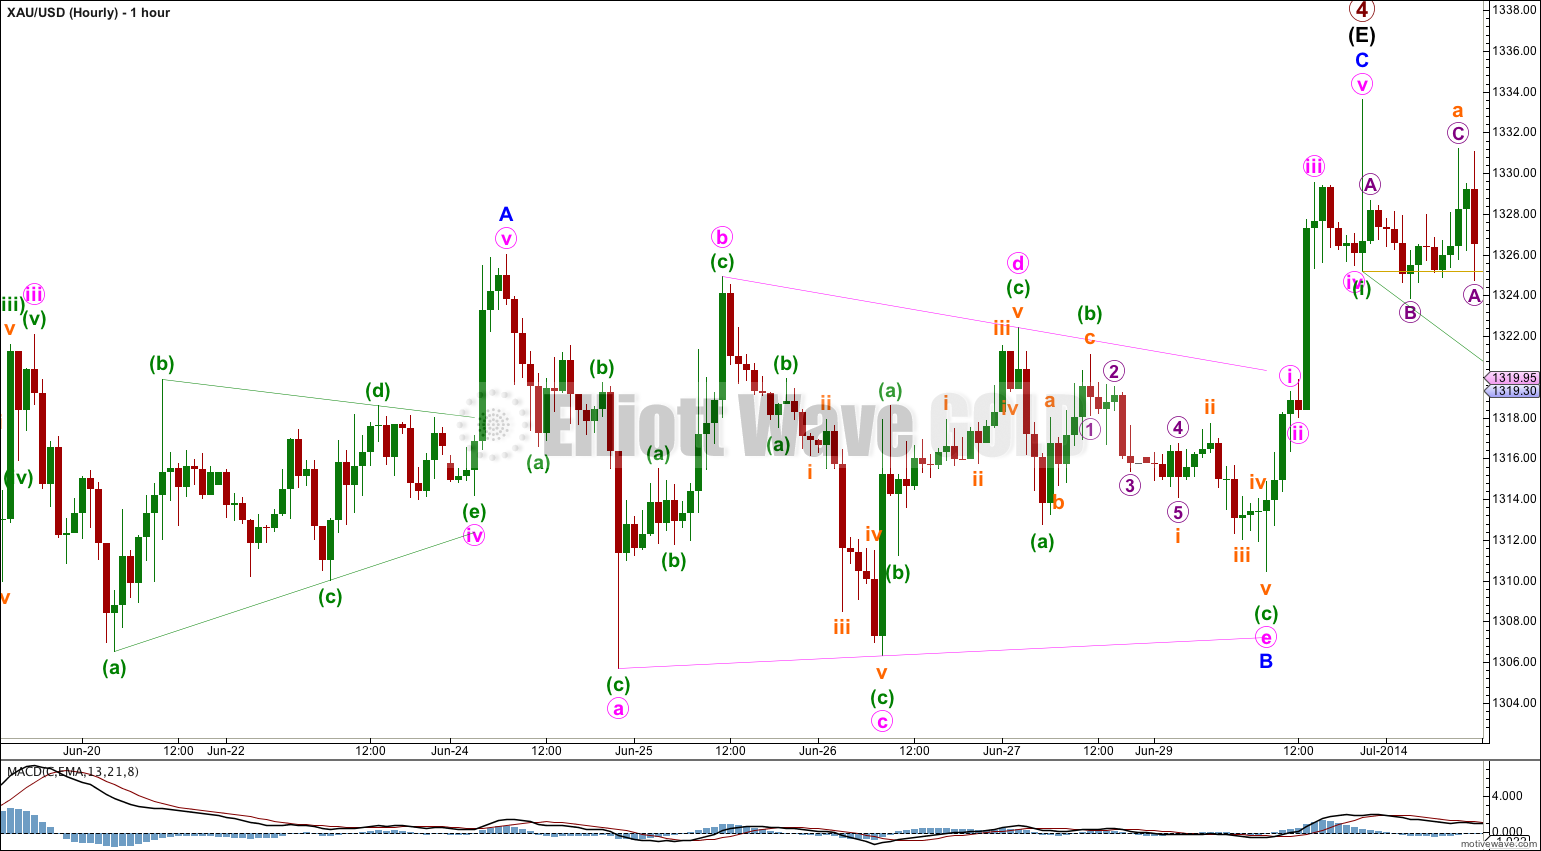
So far to the downside there are three complete waves labeled here minuette waves (i), (ii) and (iii). Minuette wave (iii) is 1.45 longer than 2.618 the length of minuette wave (i).
Minuette wave (iv) is an incomplete zigzag which shows structural alternation with the expanded flat of minuette wave (ii). I would expect minuette wave (iv) to find resistance and end at the upper edge of the channel drawn here using Elliott’s first technique. Within it subminuette wave b is an almost complete regular contracting triangle on the five minute chart.
Minuette wave (iv) may not move into minuette wave (i) price territory above 1,325.17. Movement above 1,325.17 would invalidate this main wave count and provide confirmation of the alternate below.
Alternate Wave Count.
It is possible that only minor wave A is complete and downwards movement may be the start of minor wave B. This wave count could see primary wave 4 last another two weeks to complete in a total Fibonacci 55 weeks which would be very satisfying analytically.
Within minor wave A minute wave ii lasted 29 hours and minute wave iv 154 hours. They are greatly out of proportion and this looks a little odd for Gold on the daily chart. However, fourth wave triangles are more time consuming than second wave zigzags (or in this case a triple zigzag) and so this is possible.
If minor wave B has begun then it should continue for longer than just two days. I would not want to label it as over at today’s low. Overall I would expect it to continue either sideways or lower and last a few more days. If it moved substantially lower it should find very strong resistance at the (B)-(D) trend line. A breach of this trend line would look very atypical and at that stage this alternate would significantly reduce in probability, so much so I may discard it.
Minor wave B may not move beyond the start of minor wave A below 1,240.61. Invalidation of this alternate wave count at the daily chart level would provide full and final confidence in the main wave count.
Minor wave B should move overall lower over the next few days, and may end about the 0.382 Fibonacci ratio of minor wave A at 1,297.25.
I am publishing my analysis of this critical piece of movement for both wave counts so that members may judge for themselves which has the better look. It is my opinion that this alternate does not have as good a look as the main wave count.
Within minor wave A there is no Fibonacci ratio between minute waves iii and i, and minute wave v is just 1.03 short of 0.382 the length of minute wave iii.
Within minute wave iv running contracting triangle it is minute wave (a) which is longer lasting and has deeper percentage retracements as a double zigzag. However, within subminuette wave x micro wave B triangle has an odd look. This part of the wave count looks forced. But it fits all EW rules and is viable.
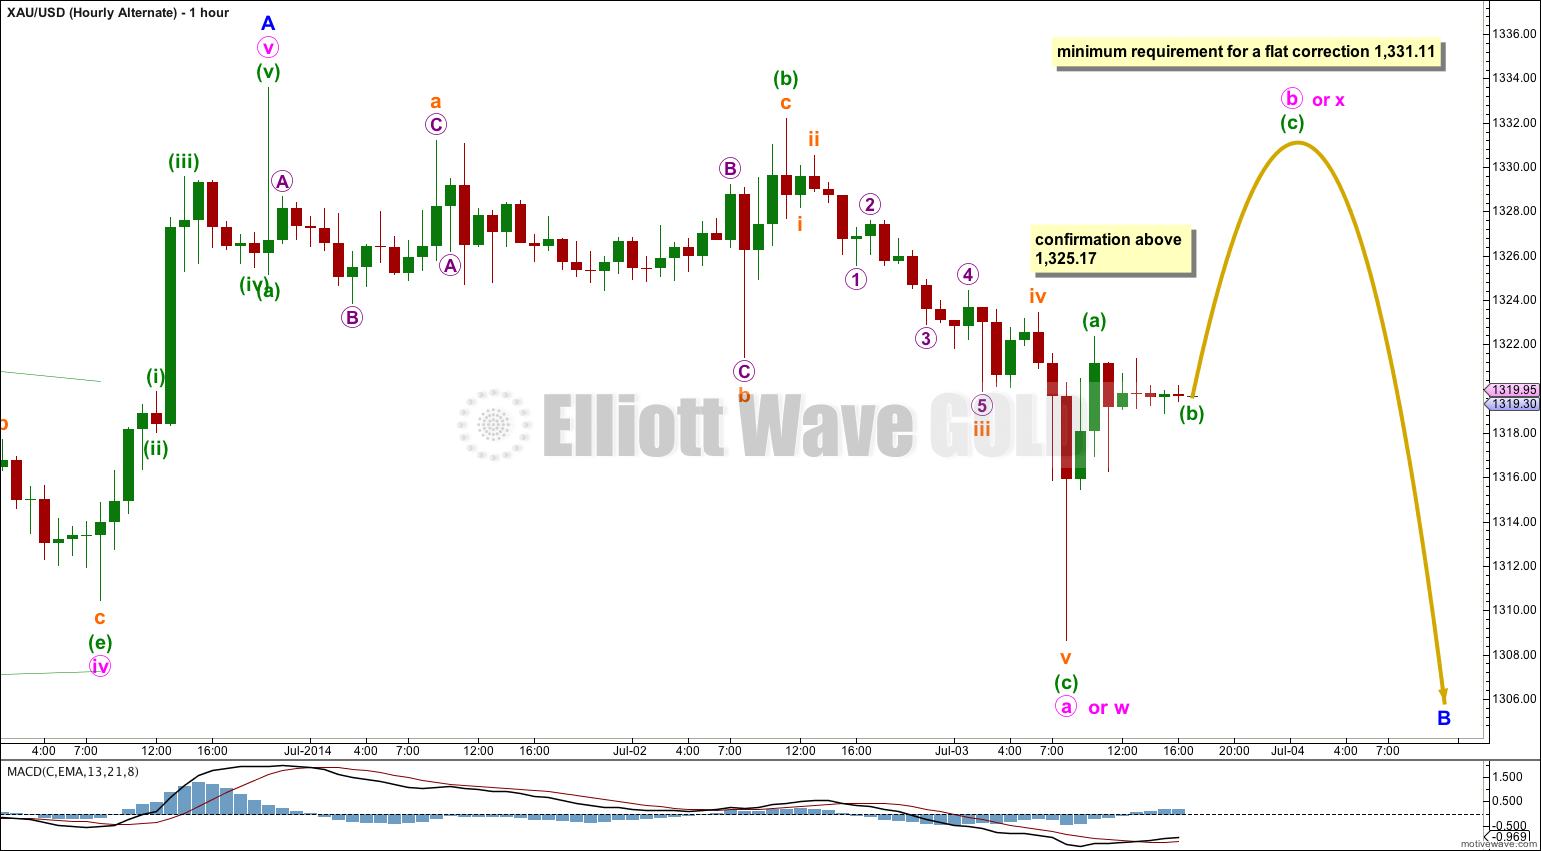
So far there are three waves to the downside. 1-2-3 and A-B-C have exactly the same subdivisions.
This alternate expects more upwards movement in the short term. If minor wave B is unfolding as a flat correction then within it minute wave a is a complete three and minute wave b must reach up to 90% the length of minute wave a at 1,331.11. Minute wave b may make a new high above the start of minute wave a at 1,333.61 which would firmly invalidate the main wave count and provide full and final confirmation of this alternate.
If minor wave B is a double zigzag or double combination then minute wave w was a zigzag. Minute wave x does not have to reach up to any particular point, but it should move higher as it is incomplete. Minute wave y would be either a zigzag, flat or triangle. If it is a zigzag then minor wave B should move substantially below 1,308.63 as the purpose of double zigzags is to deepen a correction when the first zigzag does not move price deep enough. If minute wave y is a flat or triangle then it should end about the same point as minute wave w at 1,308.63 because the purpose of double combinations is to take up time and move price sideways.
Any movement above 1,325.17 would provide a high level of confidence in this alternate wave count.
This analysis is published about 06:17 p.m. EST.
The weekly analysis indeed has that perfect look. I note that you always emphasized the importance of the time factor, therefore I would like to share with you my thoughts on this. In particular, extremely important cycles will mature around 8-11 July with the 10th of July being the most important date for a significant change in trend. This probably supports even further your weekly analysis. However, in my experience, if gold does not break downwards by the end of the above mentioned period, it is very likely, that it will break to the upside very quickly and test at least the 1392 level. Closing of silver above 21.34 would provide in my view full confidence in this scenario.
I have read many EW articles on gold with divergent views, however none of them provide such a clear, detailed and justified analysis like you do. I encourage you to keep the same writing style including the summary in bold.
Thank you.
Re: “important cycles”, Sounds like hurst cycle analysis. Proves wrong as much as it proves right in my experience.
With minuette iv hanging outside the channel, I think the alternate count will be main count. I think Minor B lasts a few more days and $1300 will provide nice support.
Hi Lara
What do you think about this alternate count? I was thinking about a rare triple three for minor B. Minuette (c) of the last flat is a little bit long but it has a nice fibonacci ratio of 2 with minuette (a).
I highly appreciate your work here! It is an unvaluable learning opportunity for me as well as a help for my trading.
Best regards
Thomas
That triple has two zigzags in it. Combinations may only have one zigzag within them. That is a combination with two zigzags, so its not a valid wave count.
And I’m always very wary of any wave count with a triple. I see SO many of them, but those structures are actually very rare. There is usually a simpler explanation.