
Sideways movement was exactly what yesterday’s Elliott wave analysis expected to see. The structure is incomplete. I have three wave counts and they all expect the same direction next as there is no divergence at this stage.
Summary: I expect one to one and a half more days of sideways and / or a little lower movement. Possible targets for it to end are 1,305 or 1,298. Once the structure is complete price should break out of this sideways range upwards.
Click on charts to enlarge.
Main Wave Count.
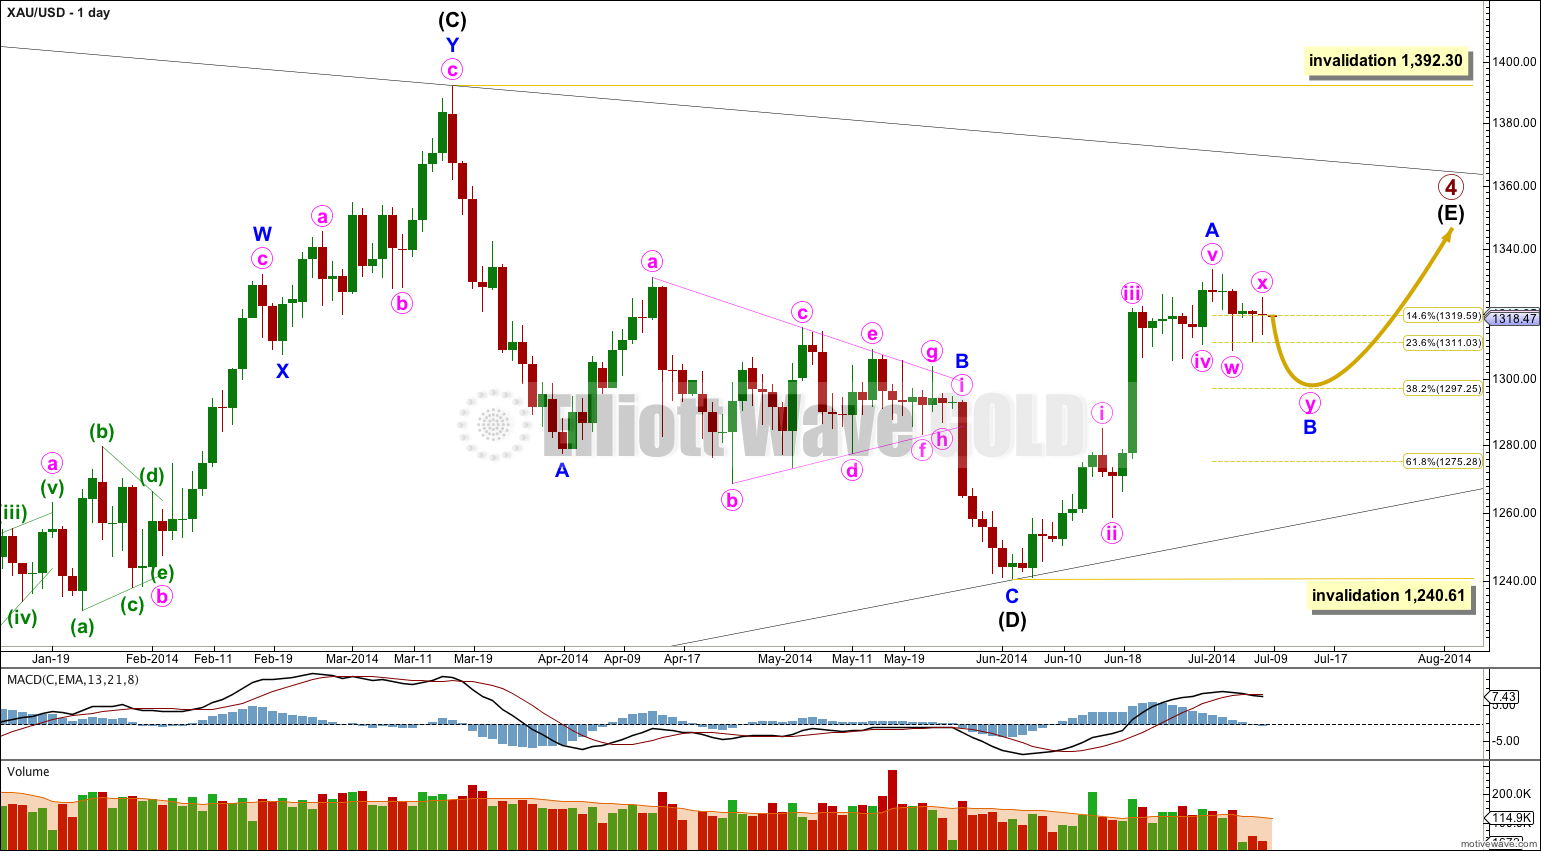
It is likely that only minor wave A is complete and sideways movement is an incomplete minor wave B. This wave count could see primary wave 4 last another two weeks to complete in a total Fibonacci 55 weeks which would be very satisfying analytically.
If minor wave B moved substantially lower it should find very strong resistance at the (B)-(D) trend line. A breach of this trend line would look very atypical and at that stage this main wave count would significantly reduce in probability, so much so I may discard it. However, I do not expect minor wave B to be deep; the deepest target I have for minor wave B to end is about the 0.382 Fibonacci ratio at 1,298.
Minor wave B may not move beyond the start of minor wave A below 1,240.61. Invalidation of this wave count at the daily chart level would provide full confidence in the alternate wave count.
B waves exhibit the greatest variety in form and structure of all waves. They are often very choppy, overlapping range bound movements which are extremely difficult to analyse. Flexibility in analysis is essential during B waves. I will focus in identifying the end of this sideways movement over one to two days. When it is done price should break out upwards.
I will now separate out the different possible structures for minor wave B into separate charts. At this stage it cannot be a single flat correction because the minimum length for a B wave within a flat was not met. This leaves three structural possibilities.
In my judgement this first wave count may have a slightly lower probability, although all three are entirely valid and reasonably close to equal in probability.
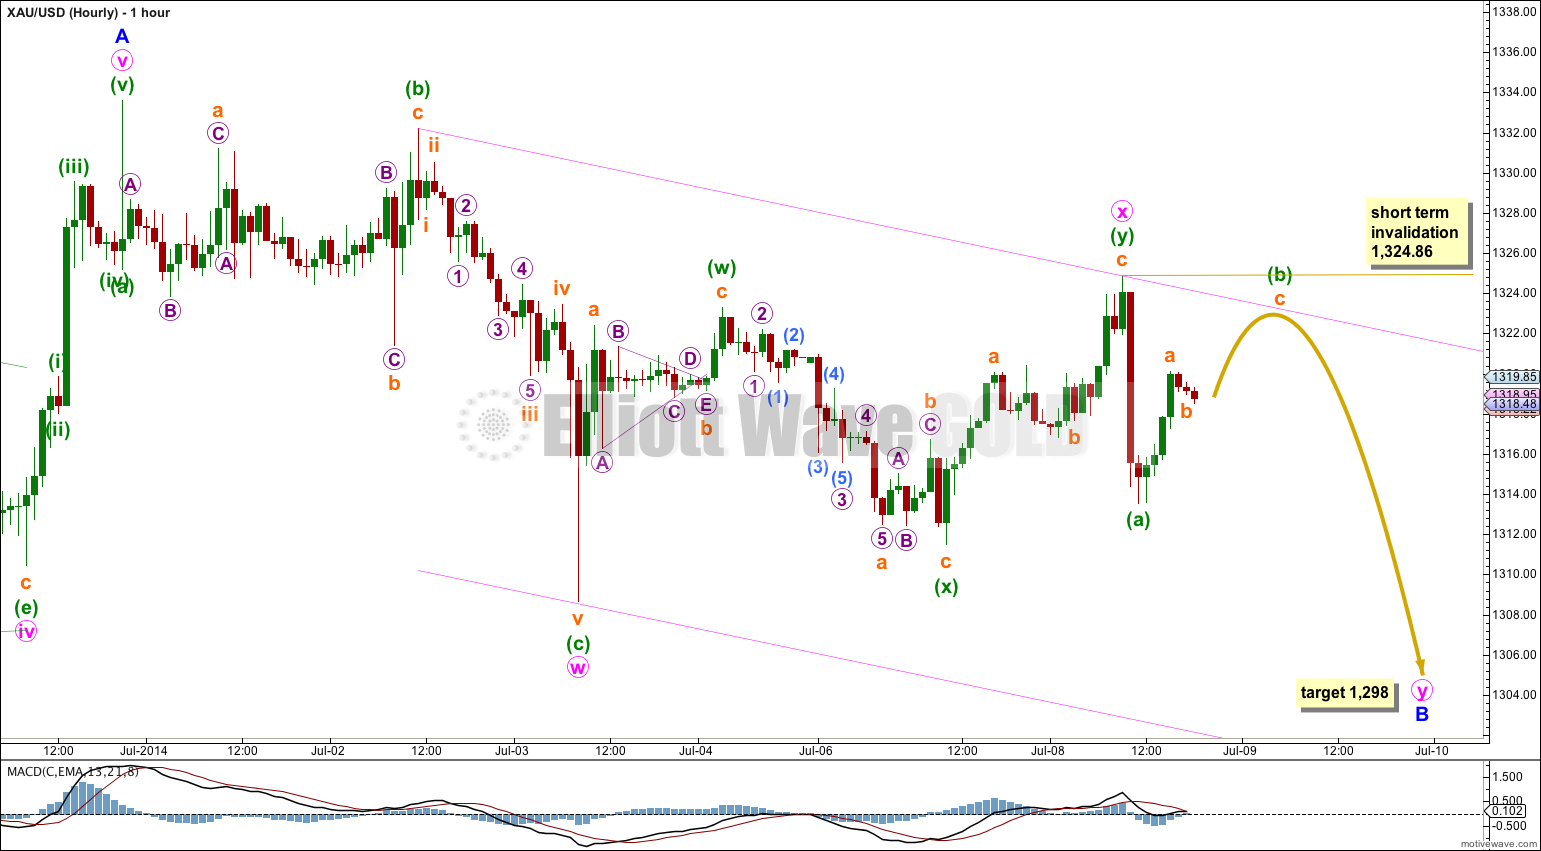
This first hourly wave count sees minor wave B as a double zigzag. Within the double minute wave w is a zigzag and not a flat correction because minuette wave (b) is less than 90% the length of minuette wave (a).
Minute wave x within the double is a “three”, a double zigzag. While W, Y and Z waves may only subdivide into simple A-B-C structures (or triangles) X waves may be any corrective structure, including multiples.
The second zigzag in the double would be expected to deepen the correction so that minor wave B would have a clear slope downwards, against the main trend. It may end about the 0.382 Fibonacci ratio of minor wave A about 1,298.
Within minute wave y zigzag minuette wave (b) may not move beyond the start of minuette wave (a) above 1,324.86.
When minute wave y is a completed zigzag then the short term invalidation point no longer applies and minor wave B would be considered complete.
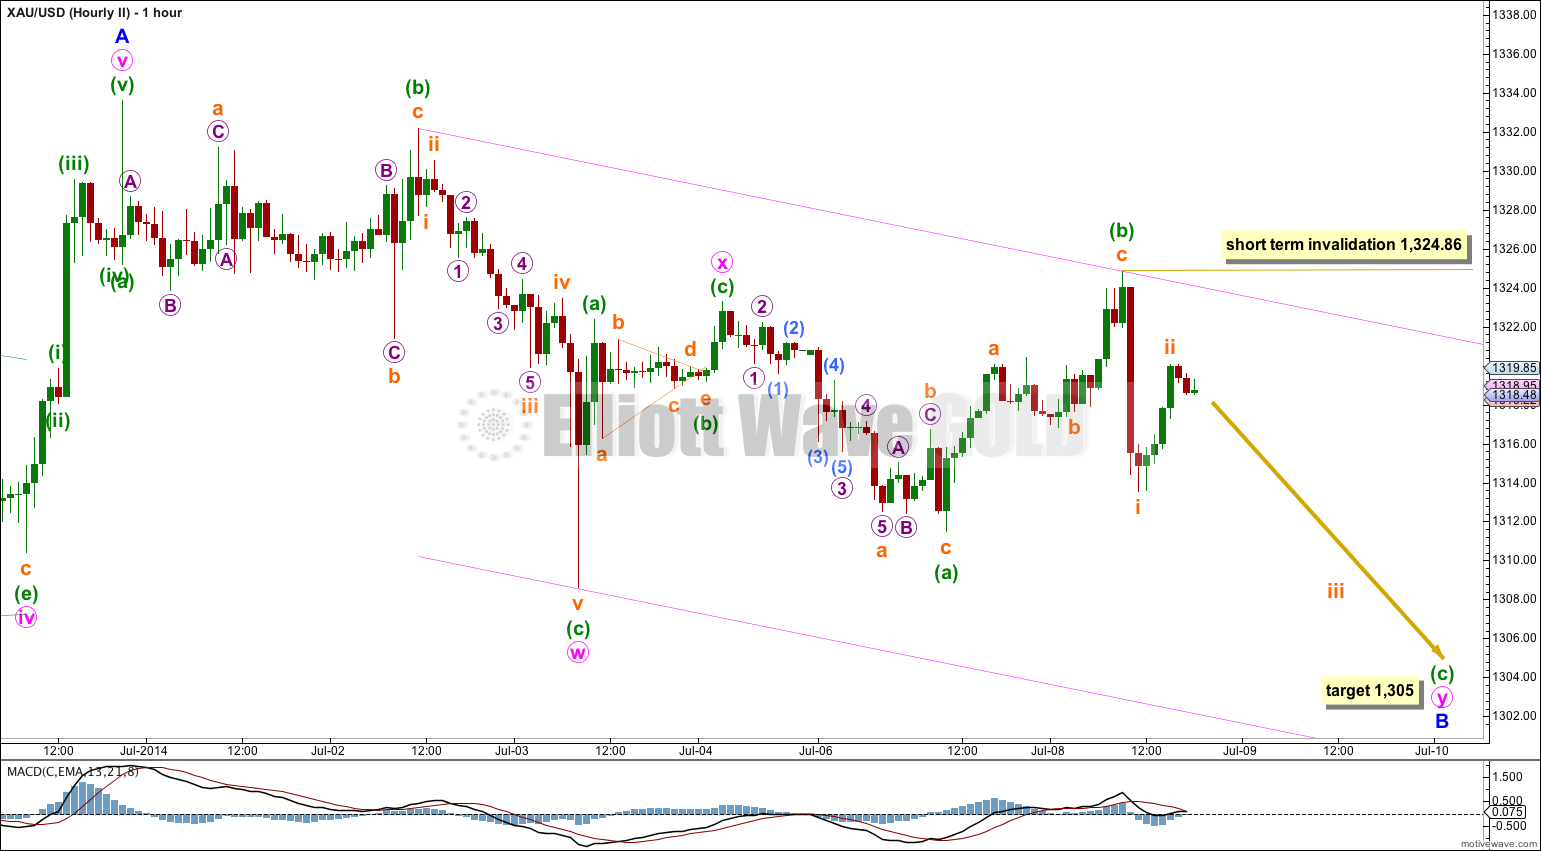
Minor wave B may also be an incomplete double combination. The first structure in the combination is a zigzag labeled minute wave w. The double is joined by a three in the opposite direction, a zigzag labeled minute wave x.
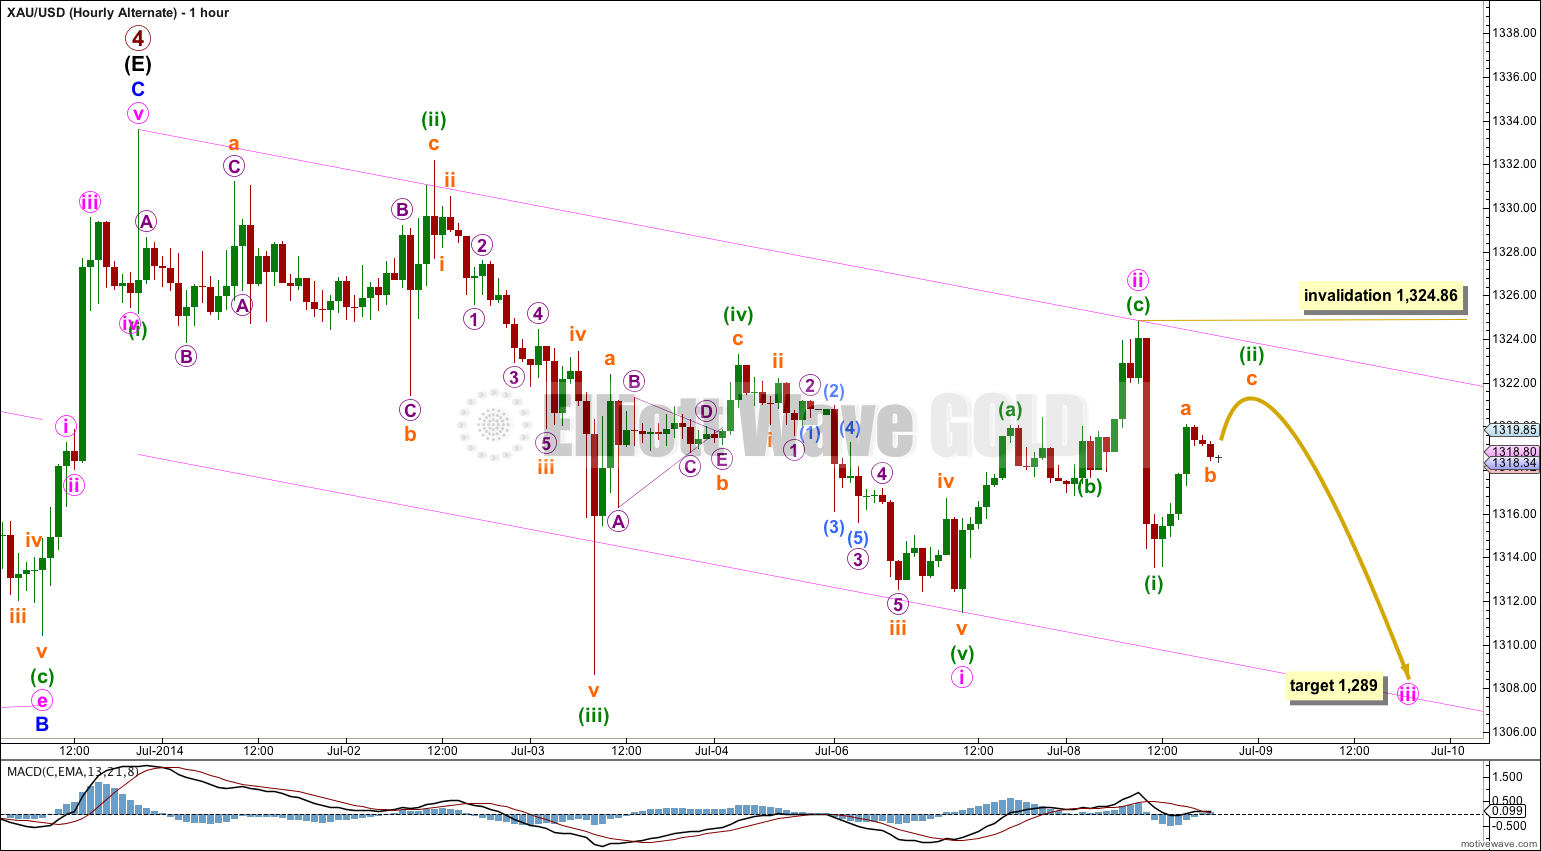
The second structure in the double may be an incomplete expanded flat correction labeled minute wave y. Within the expanded flat minuette wave (b) is a 113% correction of minuette wave (a). At 1,305 minuette wave (c) would reach 1.618 the length of minuette wave (a) and minute wave y would end close to the same level as minute wave w at 1,308.63. The whole structure would move sideways as combinations should.
Within minuette wave (c) no second wave correction may move beyond the start of its first wave above 1,324.86. When minuettte wave (c) is a complete five wave structure, particularly once it has made a new low below the end of minuette wave (a) at 1,311.49 and avoided a truncation, then this invalidation point will no longer apply and it may be expected that minor wave B in its entirety would then be complete.
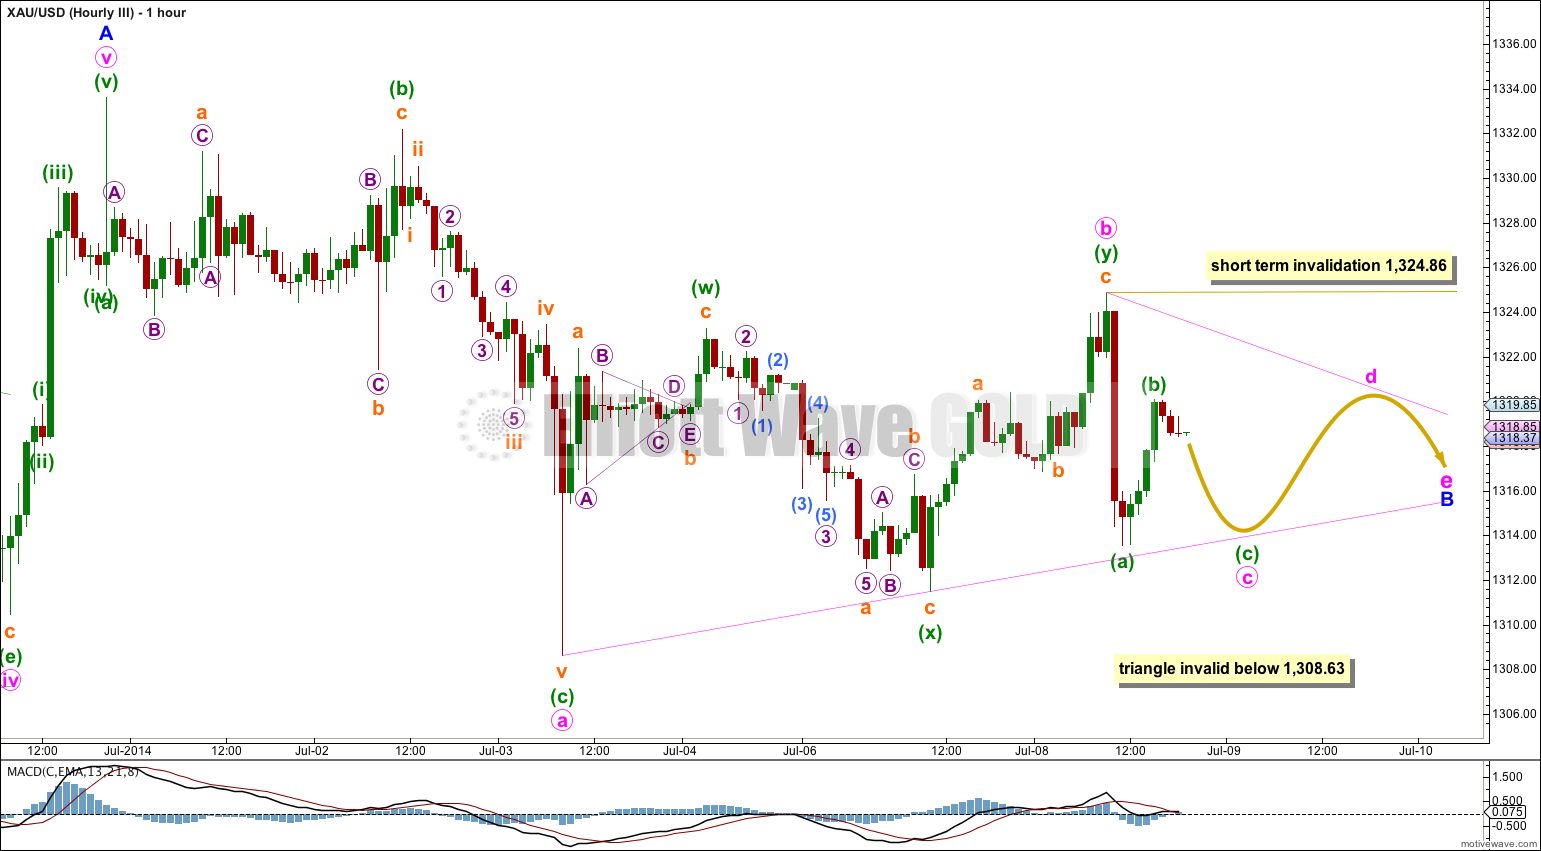
Minor wave B may also be an incomplete regular contracting triangle.
Within the triangle it is minute wave b which is longer lasting and more complicated as a double zigzag. This leaves minute wave c, d and e incomplete, and they must all subdivide as simple A-B-C corrections and extremely likely to be simple zigzags.
Minute wave c may not move beyond the end of minute wave a below 1,308.63. This invalidation point is black and white.
Minute wave d may not move beyond the end of minute wave b above 1,324.86 for a contracting triangle. For a barrier triangle minute wave d may end about the same level as minute wave b, as long as the b-d trend line is essentially flat. In practice this means d may move very slightly above 1,324.86 and so this invalidation point is not black and white.
This idea expects sideways movement in an ever decreasing range which could last another two to three days. The eventual breakout is still expected to be upwards.
Alternate Wave Count.
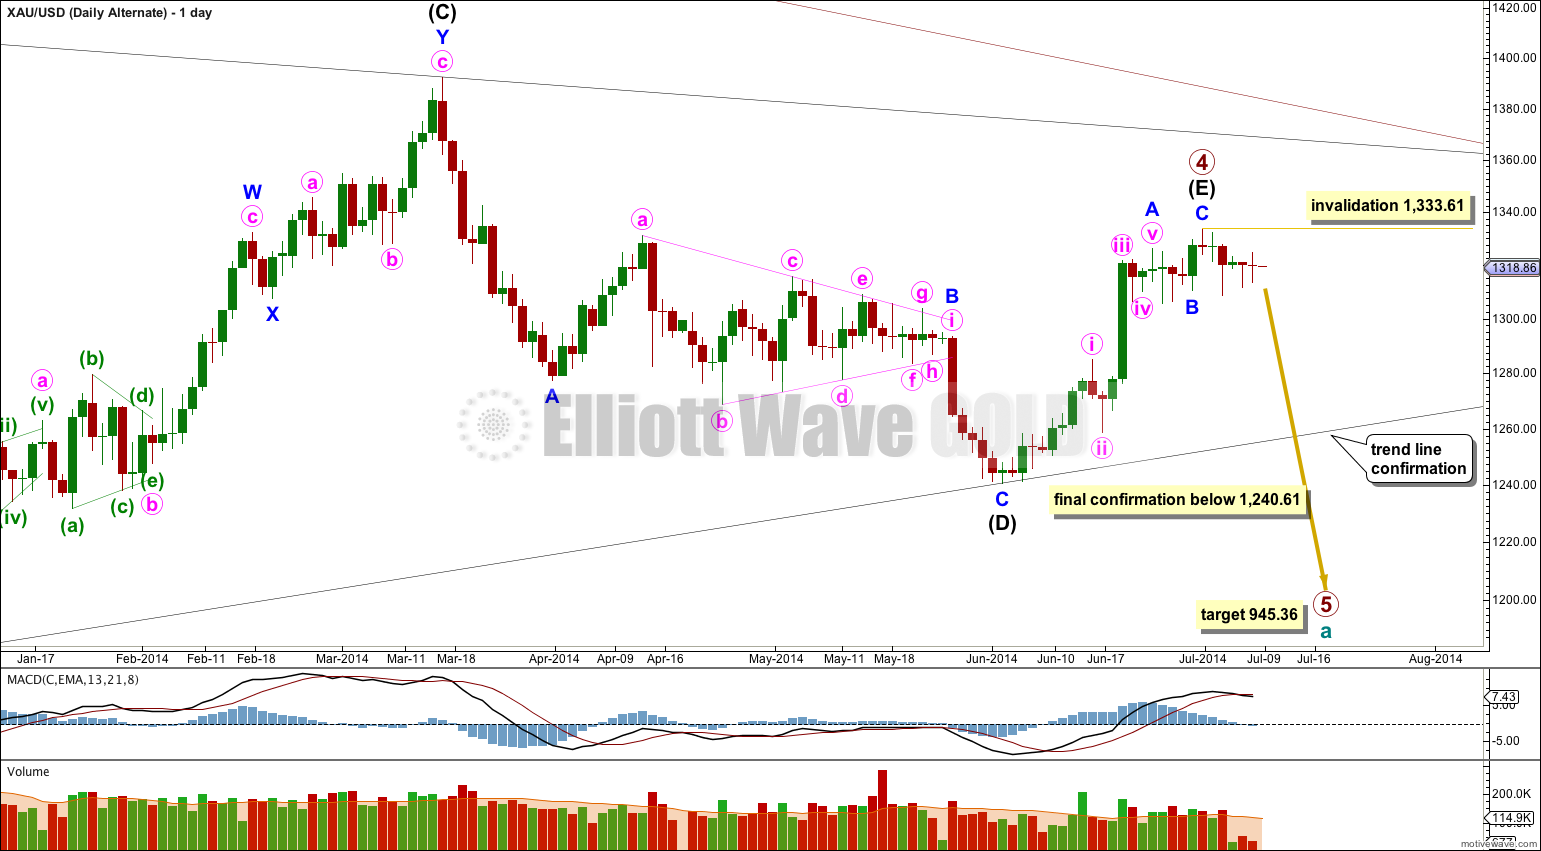
Primary wave 4 may be a complete regular contracting triangle.
Intermediate wave (E) may have ended in just 20 days, one short of a Fibonacci 21. E waves of triangles are often short and brief, and this one looks reasonably typical.
Within primary wave 5 downwards no second wave correction may move beyond the start of its first wave above 1,333.61. Any movement above this point would immediately invalidate this wave count and clearly confirm the main wave count.
A clear breach of the (B)-(D) trend line would provide confidence in this alternate wave count. Thereafter, full confirmation would come with price movement below 1,240.61.
While price continues to move sideways overall this wave count does not have a good fit. Sideways movement looks much more like a typical B wave at this stage than a new downwards impulse. This wave count looks forced. I only publish it today because it expects a strong third wave downwards. Although this has a low probability, it is possible.
At 1,289 minute wave iii would reach 1.618 the length of minute wave i.
Minute wave iii should break below the lower edge of the pink base channel drawn about minute wave i and ii. If the lower pink trend line is breached that would be confirmation that a third wave is underway. Upwards corrections should find resistance at the upper pink trend line.
The truncated fifth wave for minuette wave (v) at the end of minute wave i significantly reduces the probability of this wave count.
This analysis is published about 08:30 p.m. EST.
What will be targets ?
1324.86 has invalid now what to do , why you are not posting when point will break 1324.86 level ?
Lara I agree you were kind of asking for it posting 3 scenarios with same invalidation pt
Yeah, that really was an epic fail.
It still looks like a B wave though. Not a new impulse upwards.
Because I did not see this possibility when I did yesterday’s analysis.
Because I’m human?
Hi Lara. B waves are indeed very difficult to analyse. Just now, gold spot price has risen higher than 1324.86. Does it invalidate all of your alternatives? Also, could you post an update on silver soon? With so much changes, the previous post might need an update. Apparently, silver now follows gold’s movements quite closely. Thank you for all your hard work. It is truly appreciated.
Yes, I’ll post updates on Silver and GDX today.
It may only be charts, but it will be done.
Lara,
Gold, Silver and GDX daily chart on same day–that will be great thank you.
Thank you. Charts will be fine. I greatly appreciate your diligence and help.