Sideways movement continues. The main hourly Elliott wave count still looks more likely.
Summary: It is most likely we shall see more sideways movement ending a little lower to about 1,298.55 before the upward trend resumes (although this target may be too low, we may see only a slight new low below 1,304.93). The target remains at 1,346 and it may be met in three or four days time.
Click on charts to enlarge.
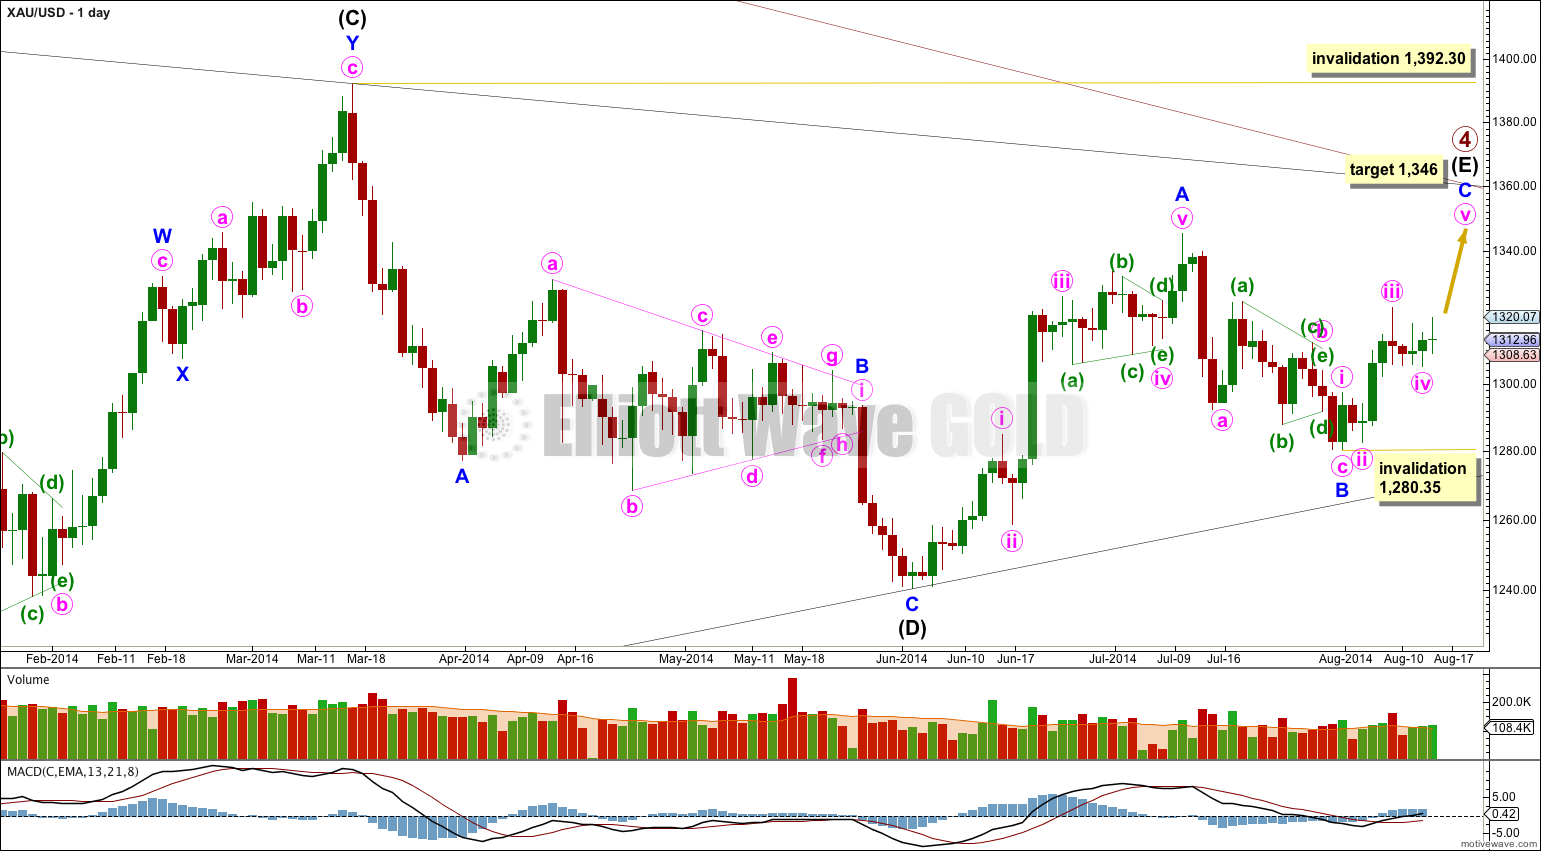
Primary wave 4 is an incomplete regular contracting triangle. Primary wave 2 was a deep 68% running flat correction. Primary wave 4 is showing alternation in depth and some alternation in structure.
Within the triangle of primary wave 4 intermediate wave (E) is unfolding as a zigzag: minor wave A is a five wave impulse and minor wave B downwards is a zigzag. Minor wave C must subdivide as a five wave structure.
At 1,346 minor wave C would move slightly above the end of minor wave A at 1,345.22 and avoid a truncation, and intermediate wave (E) would fall short of the (A)-(C) trend line.
There are four nice examples of triangles on this daily chart: within intermediate wave (C), within intermediate wave (D), within minor wave A of intermediate wave (E), and within minor wave B of intermediate wave (E). In all four examples the final subwave of the triangle ends comfortably short of the A-C trend line. This is the most common place for the final wave of a triangle to end and so that is what I will expect is most likely to happen for this primary degree triangle of primary wave 4.
Within minor wave C no second wave correction may move beyond its start below 1,280.35.
Intermediate wave (E) may not move beyond the end of intermediate wave (C) above 1,392.30.
Main Hourly Wave Count.
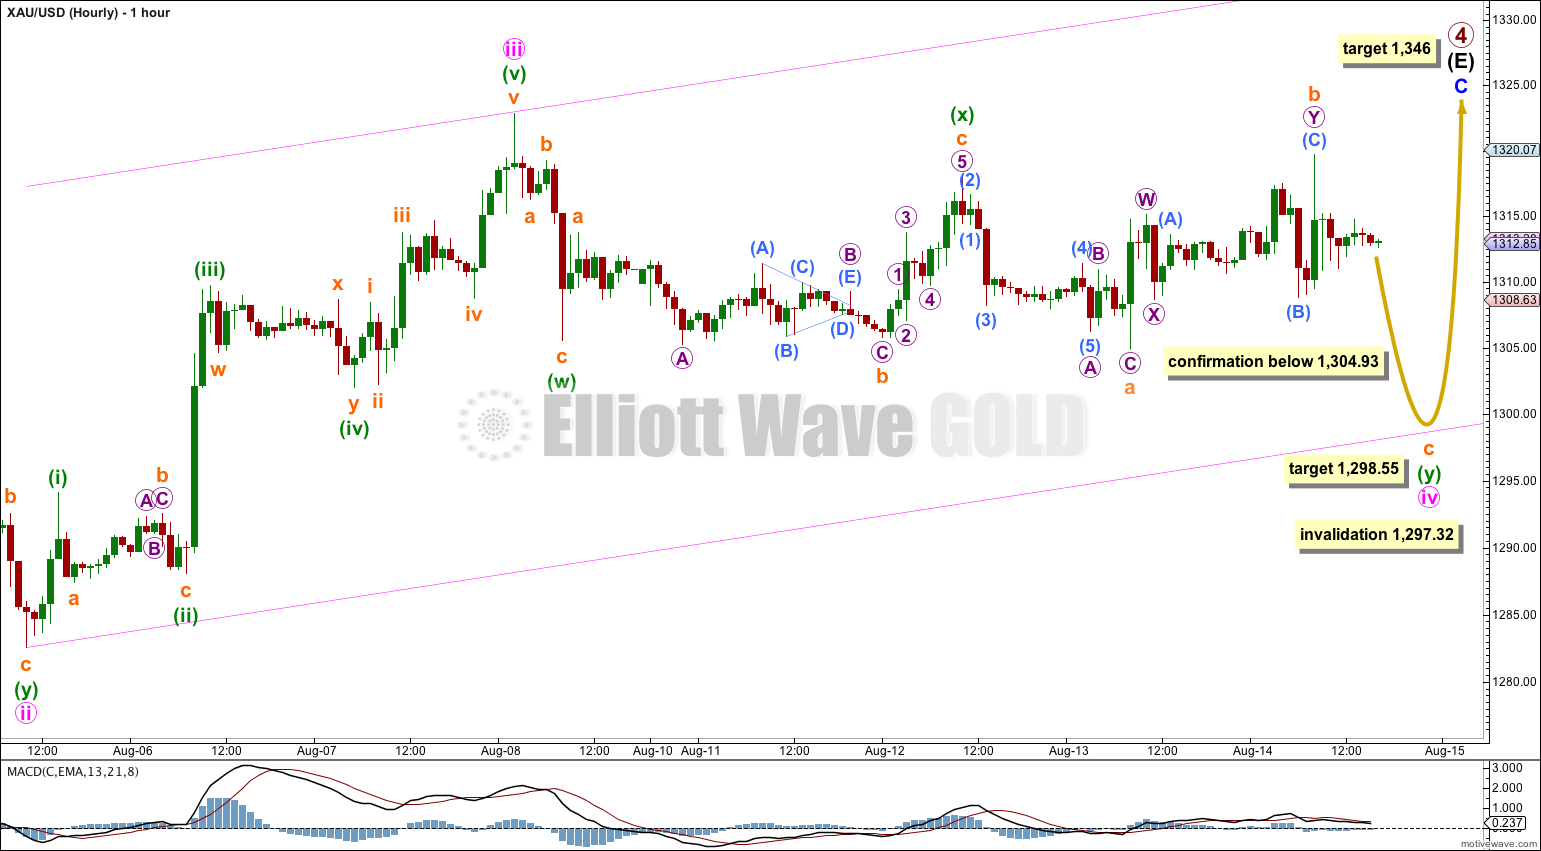
Despite a green candlestick for Thursday’s session minute wave iv is still most likely to be an incomplete double combination. This would give it structural alternation with the double zigzag of minute wave ii. Minute wave ii was a deep 87% correction, and at its end minute wave iv may be a shallow (less than 50%) correction providing alternation in depth as well.
The first structure, minuette wave (w), is a brief zigzag. The second structure, minuette wave (y), may be an incomplete expanded flat correction: subminuette wave b is a 113% correction of subminuette wave a. At 1,298.55 subminuette wave c would reach 1.618 the length of subminuette wave a. However, subminuette wave c may not reach down that low and may end only slightly below 1,304.93 to avoid a truncation and a very rare running flat. If we do see a new low below 1,304.93 I will be looking out for an imminent trend change back to the upside.
The channel about minor wave C must be redrawn once minute wave iv is over: draw the first trend line from the ends of minute waves ii to iv, then place a parallel copy on the end of minute wave iii. I will expect minute wave v to end at the upper edge of the channel.
So far minute wave iv has lasted ten days. If it continues for another three it may end in a Fibonacci 13 days. Depending on where we count the first candlestick of minute wave iv it could also be considered to have lasted only nine days, and so it could continue for another four.
Minute wave iv may not move into minute wave i price territory below 1,297.32.
Alternate Hourly Wave Count.
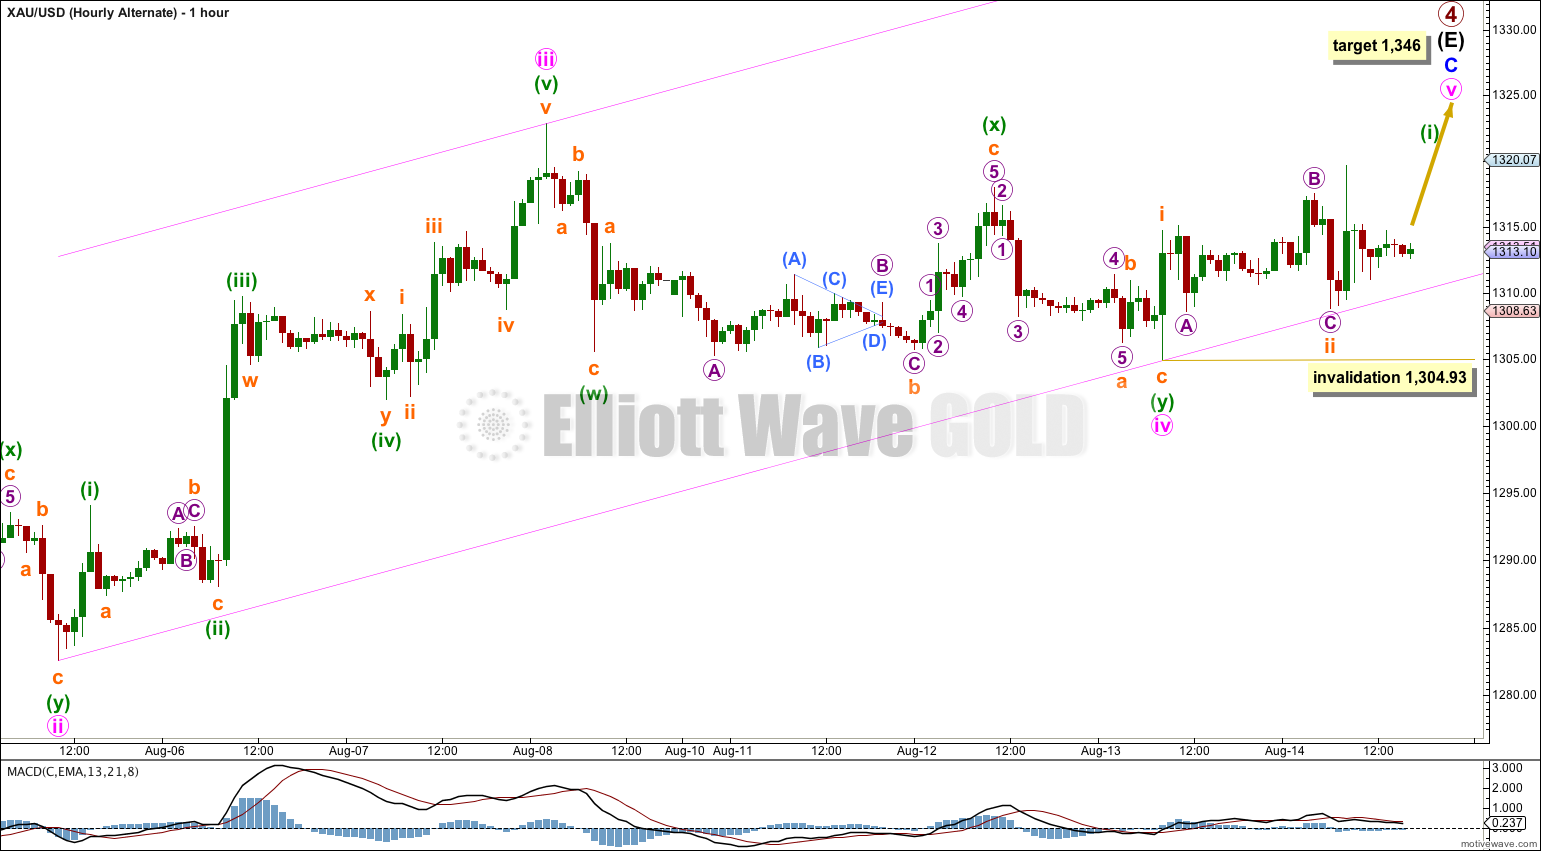
If minute wave iv is over then the only structure which fits into this sideways chop is a double zigzag (I have considered and eliminated all other possibilities).
It is a very atypical double zigzag in that the second zigzag in the double does not deepen the correction and just moves the correction sideways. This reduces the probability of this alternate wave count.
If minute wave iv is a double zigzag then there is no structural alternation with minute wave ii, which was also a double zigzag. This further reduces the probability of this alternate wave count.
However, minute wave iv does show alternation in depth of correction and is shallow at 44%.
Alternation is a guideline and not a rule which needs to be applied with flexibility. Occasionally, I have seen impulses with second and fourth wave corrections which appear to be the same structure (usually zigzags) and they show alternation within their structures. For example, within one zigzag the A and C waves may be close to equality, within the other they may have a 1.618 or 2.618 ratio to each other. We may be seeing a similar situation here in that minute waves ii and iv are the same structure but show alternation within their structures.
If minute wave v begins at 1,304.93 then a first wave upwards for subminuette wave i is followed by a complete second wave correction for subminuette wave ii. However, the only structure which fits for subminuette wave ii is a very rare running flat correction. This further reduces the probability of this alternate wave count today.
Despite Thursday’s session providing a green candlestick on the daily chart this alternate wave count has an even lower probability than yesterday. I would judge this alternate to have about a 10% probability today.
At 1,345.21 minute wave v would reach equality in length with minute wave iii. A 1,345.06 minor wave C would reach 0.618 the length of minor wave A. Because minor wave C is most likely to move at least slightly above 1,345.22 to avoid a truncation I leave the target at 1,346.
Within minute wave v no second wave correction may move beyond its start below 1,304.93.
This analysis is published about 05:18 p.m. EST.


The subdivisions quite simply do not fit. If you are seeing this sideways chop as a series of overlapping first and second waves (which it can only be if Gold has begun a new upwards trend) then the upwards waves of my triangle for intermediate waves (A) and (C) must be seen as five wave impulses. Within intermediate wave (C) there is a triangle which would be in a second wave position. Triangles may not be the sole corrective structure in a second wave.
Intermediate wave (A) quite simply does not look like a five wave structure, it looks like a three.
I have just joined with Gold EWTA yesterday. I think after the major top on about 9/11 at $1900+. it appears the wave had ABC down on about 6/13 at about $1180.40(C). Then instead of contracting triangle waves(ABCDE) the wave should be viewed as 1 up, and 2 down($1180.84) with double bottom formation, next (1) up, and (2) down($1240), and next 1(circle) up, and 2(circle) down to 1280.35. In Lara’s intended labelled area of B minor is the beginning of wave 3(circle) with massive bullish potential, perhaps beginning on Monday, next week. If you look at the wave structure of 1, (1), 1(circle) are 5 waves and 2, (2), 2(circle) are 3 wave structures. They are so clear to me? However, It’s just my opinion. Best wishes, Thanks.
Lara,
I was wondering why the upper edge of the large channel containing primary waves 1-4 shows up in the 1400s in your August 12th analysis, while it has been in the 1360s area before and after that day’s analysis? Any of the charts that I have drawn coincide with your August 12th drawing. Someone else had commented on the same topic some weeks ago. Thanks.
Probably because on on 12th I may not have compressed and expanded my daily chart.
Motive Wave does not place channels correctly when it does not see the points the trend lines are attached to.
You’ll see what I mean when I publish a video of how I do a wave count / how I use Motive Wave for Nick.
I have to agree with Charles below. To my inexperienced eye, it really looks like we may have just completed a wave 2 (not a wave 4) correction. In terms of overall scale, waves 1 & 2 of minor wave C are comparable to their counterparts in minor wave A.
Perhaps the recent high at 1322.80 was the end of wave 1. Wave 2 correction?
Maybe….
Maybe blue C is an ending diagonal?
3 up, 3 down, 3 up etc…
Everything just got blown out of the water with this downside move IMO.
Lara, setting aside the complexity of this wave count, the MACD appears ripe for a breakout to the downside on both the hourly and weekly charts. Gdx has also put in a slight new high. Perhaps we should entertain that wave 4 is complete and 5 begun?
Tough calls…