
Yesterday’s main Elliott wave count expected to see some downwards movement to a short term target at 1,298.55 (although I had strongly suggested this target was too low) before price turned back upwards again. We did see downwards movement followed by a turn back up, but downwards movement was just over $6 more than the target and moved slightly below the invalidation point.
I have two wave counts for you today.
Summary: It is still more likely that primary wave 4 is incomplete and we shall see a new high above 1,345.22 before it is done. Next week I expect to see upwards movement to a new high above 1,322.83 on Monday or Tuesday for a third wave of an ending diagonal. The alternate idea sees primary wave 4 complete, and this would be confirmed with a new low below 1,280.35.
Click on charts to enlarge.
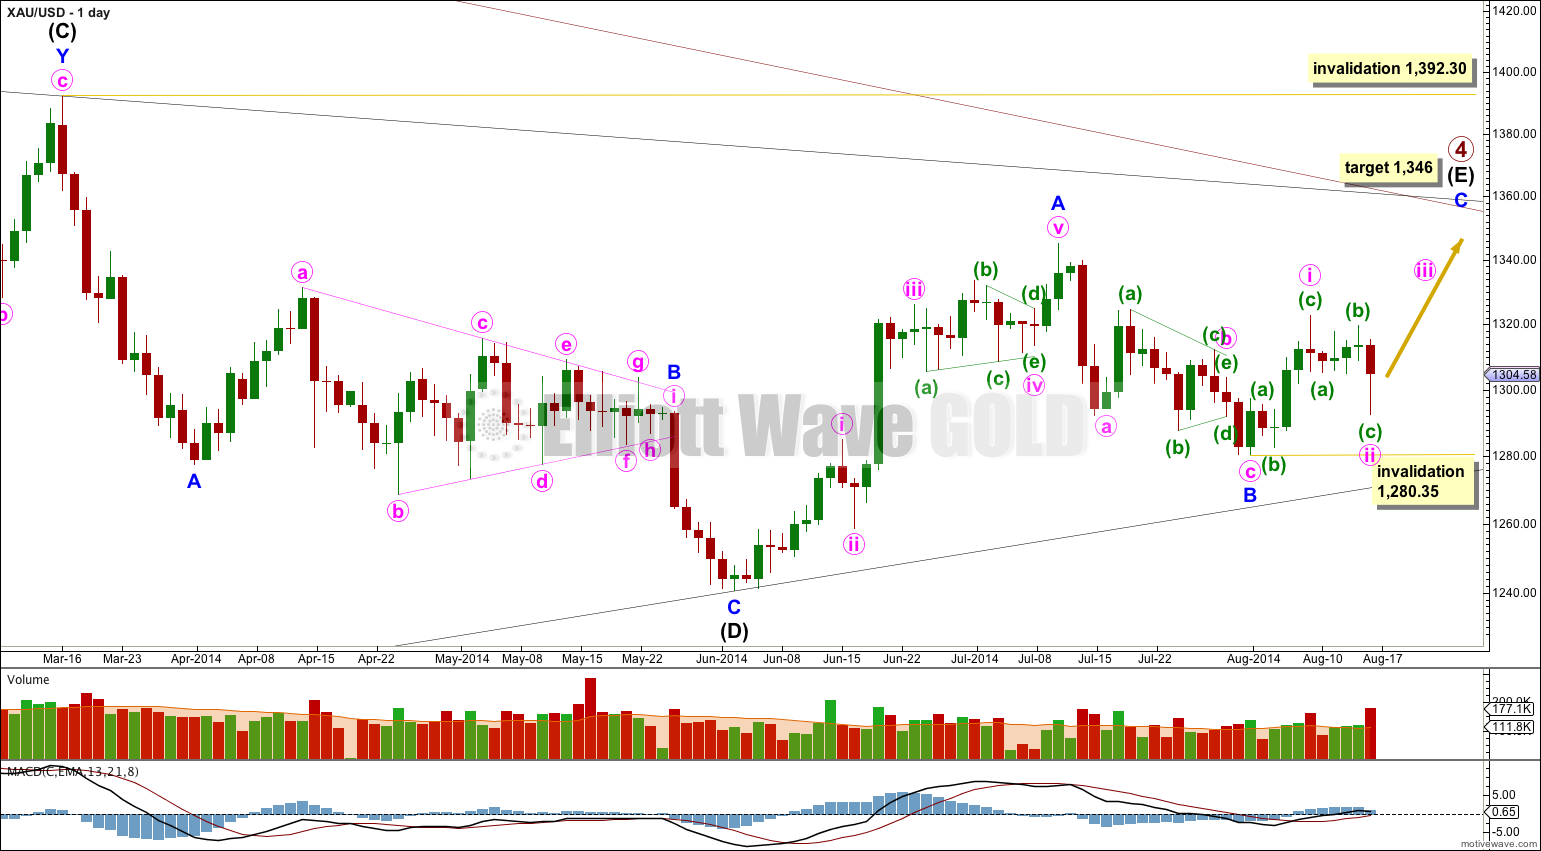
Primary wave 4 is an incomplete regular contracting triangle. Primary wave 2 was a deep 68% running flat correction. Primary wave 4 is showing alternation in depth and some alternation in structure.
Within the triangle of primary wave 4 intermediate wave (E) is unfolding as a zigzag: minor wave A is a five wave impulse and minor wave B downwards is a zigzag. Minor wave C must subdivide as a five wave structure.
At 1,346 minor wave C would move slightly above the end of minor wave A at 1,345.22 and avoid a truncation, and intermediate wave (E) would fall short of the (A)-(C) trend line.
There are three nice examples of triangles on this daily chart: within intermediate wave (D), within minor wave A of intermediate wave (E), and within minor wave B of intermediate wave (E). In all three examples the final subwave of the triangle ends comfortably short of the A-C trend line. This is the most common place for the final wave of a triangle to end and so that is what I will expect is most likely to happen for this primary degree triangle of primary wave 4.
Within minor wave C no second wave correction may move beyond its start below 1,280.35.
Intermediate wave (E) may not move beyond the end of intermediate wave (C) above 1,392.30.
Main Hourly Wave Count.
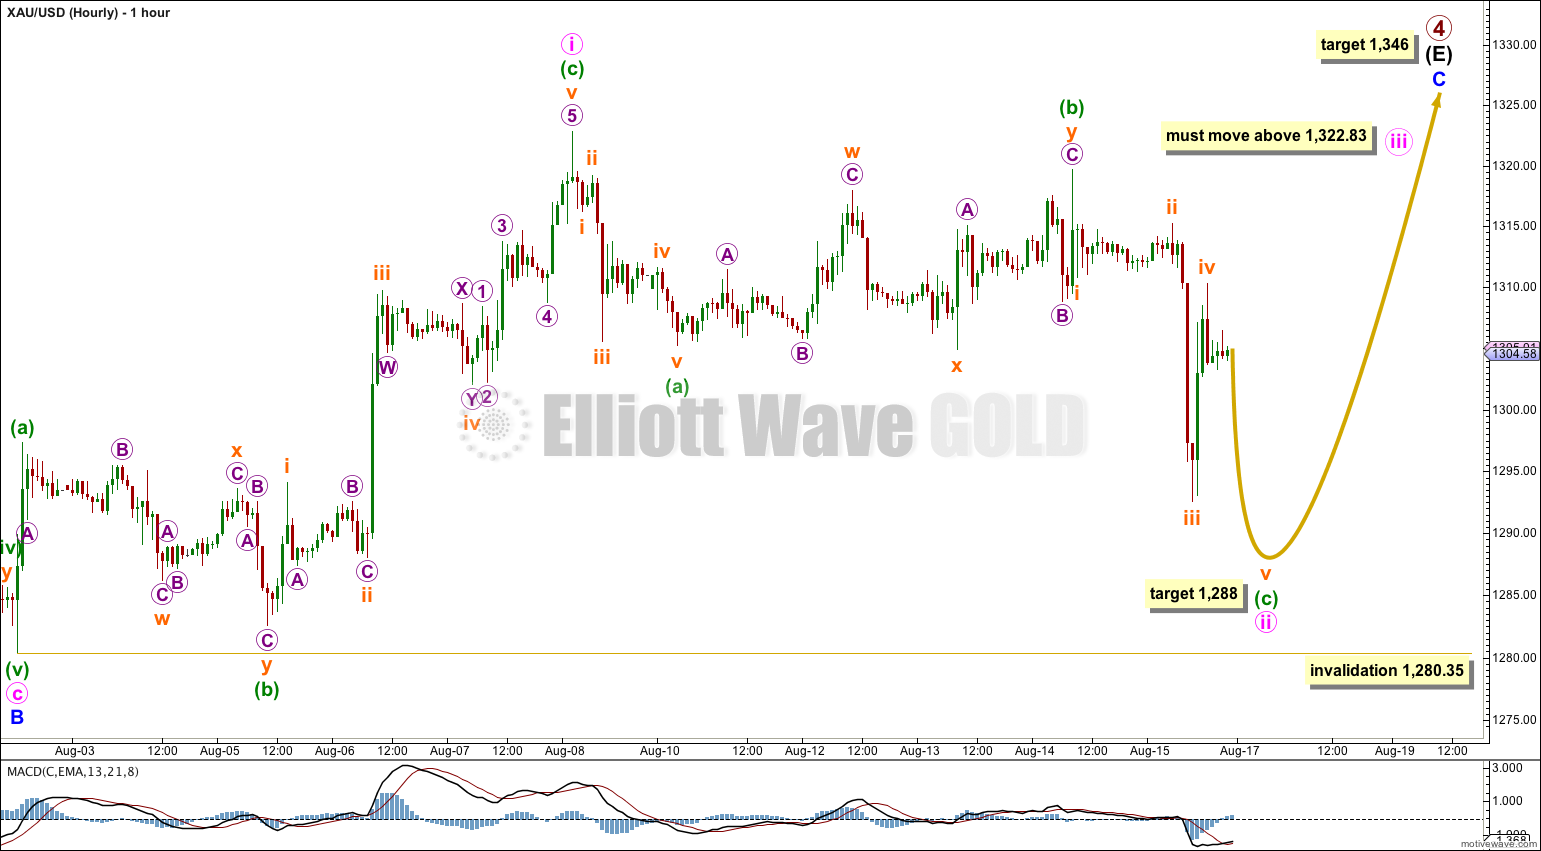
There are two possible structures for minor wave C. I had expected to see the more common impulse, but movement back into what was wave 1 price territory for an impulse has invalidated that idea. The upwards wave labeled minute wave i is a clear zigzag which is complete.
The other structural possibility is an ending diagonal. Within an ending diagonal all subwaves may only subdivide into single zigzags. With the first wave up fitting best as a zigzag this may be what is happening.
Within a diagonal the second and fourth waves most commonly end between 0.66 to 0.81 the prior wave. So far minute wave ii is a 0.71 length of minute wave i, nicely within the common length. The target would see it reach down to 0.81 the length of minute wave i.
Within minuette wave (c) of minute wave ii, subminuette wave iii is 0.48 short of 2.618 the length of subminuette wave i. At 1,289 subminuette wave v would reach just short of equality with subminuette wave iii, and minute wave ii would reach the maximum common length of 0.81 minute wave i.
Minute wave iii must move above the end of minute wave i so a new high above 1,322.83 is required. There is not normally a Fibonacci ratio between actionary waves of diagonals, so I cannot calculate a target yet for minute wave iii. The ratio between minuette waves (a) and (c) within minute wave iii may be used to calculate a target for minute wave iii to end, and I will do this once minuette wave (b) is over.
Overall the bigger picture remains the same: minor wave C is still extremely likely to move at least slightly above the end of minor wave A at 1,345.22 to avoid a truncation, and the target at 1,346 where minor wave C would reach 0.618 the length of minor wave A remains the same. Only the structure to get there is different.
Diagonals are choppy and overlapping, but have a definite trend (unlike their sideways cousins the triangles). They tend to be longer lasting than impulses. The target at 1,346 may now be further away in time. If minute wave C lasts a Fibonacci 21 days it could take another two weeks.
Minute wave ii may not move beyond the start of minute wave i below 1,280.35.
Alternate Daily Wave Count.
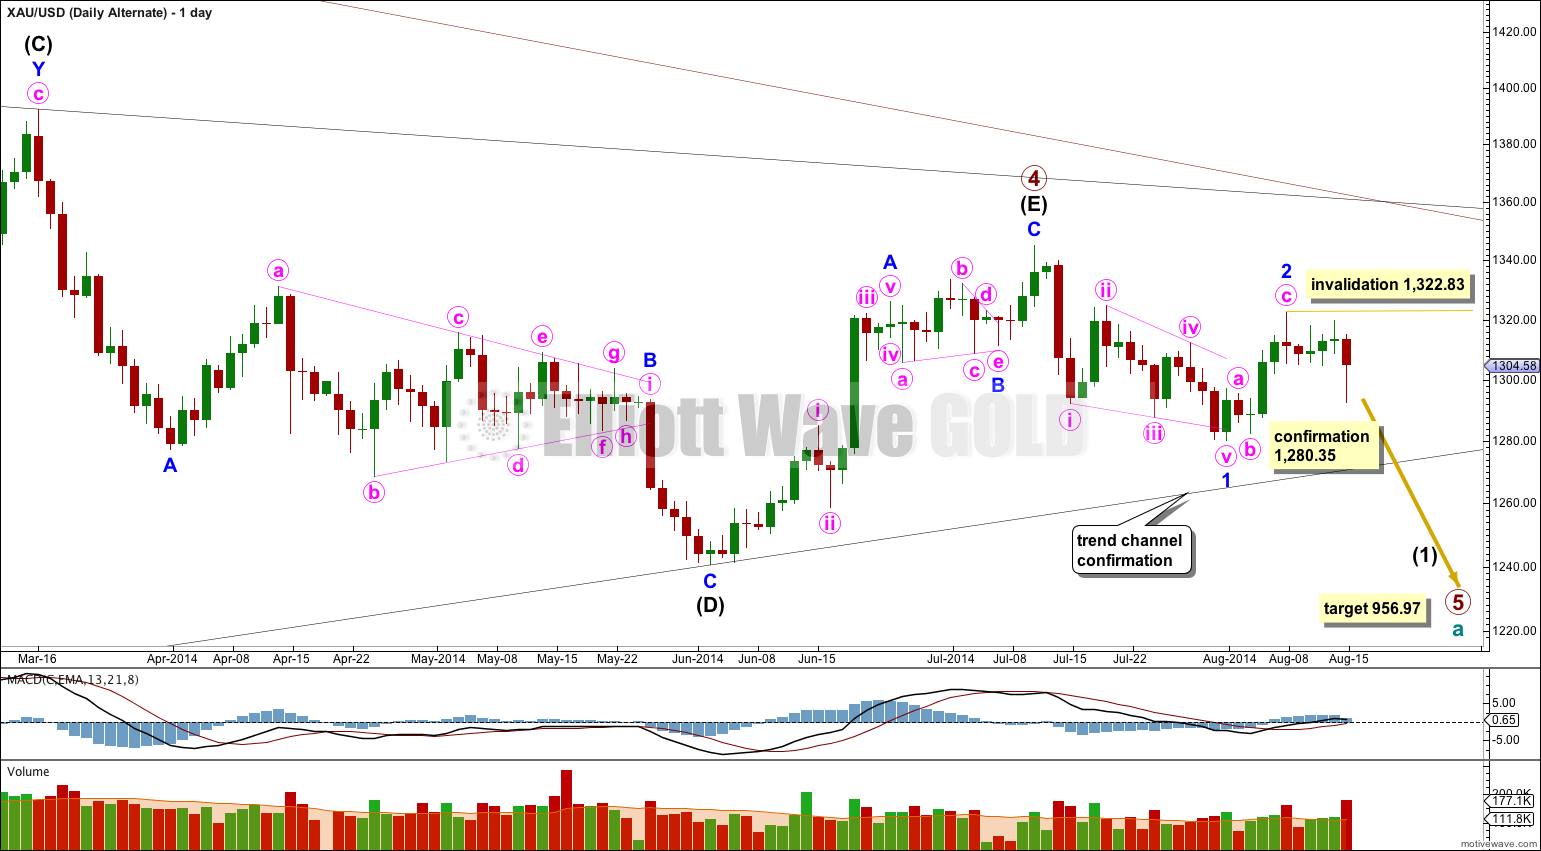
This wave count is one I have referred to before as a possibility, but have not published for you. In the interests of considering all possibilities after the invalidation of the last hourly wave count I will publish it now.
It is possible (but unlikely) that primary wave 4 is over.
If primary wave 4 is over then primary wave 5 downwards would reach equality in length with primary wave 1 at 956.97. Primary wave 1 was a remarkably brief 3 weeks duration. I would expect primary wave 5 to last some months, and is already longer than one month.
The only structure which fits for minor wave 1 is a leading contracting diagonal. While leading diagonals are not rare, they are not very common either. This slightly reduces the probability of this wave count.
Within diagonals the second and fourth waves are commonly between 0.66 to 0.81 the prior wave. Here minute wave ii is 0.61 the length of minute wave i, just a little shorter than the common length, slightly reducing the probability of this wave count. Minute wave iv is 0.66 the length of minute wave iii, just within the common length.
Leading diagonals in first wave positions are normally followed by very deep second wave corrections. Minor wave 2 is deep at 65% the length of minor wave 1, but this is not “very” deep. This again very slightly reduces the probability of this wave count.
The biggest problem I have with this wave count and the reason for it being an alternate is the leading diagonal following the end of the triangle for primary wave 4. When triangles end the first piece of movement out of the triangle is almost always very strong and swift. Diagonals are not strong and swift movements. To see a first wave out of a triangle subdividing as a diagonal is highly unusual and does not at all fit with typical behaviour. This substantially reduces the probability of this alternate wave count. I would judge it to have less than a 10% probability.
Within minor wave 3 no second wave correction may move beyond the start of its first wave above 1,322.83.
Only if this wave count is confirmed with a new low below 1,280.35 next week would I take it seriously. After that a clear breach of the lower (B)-(D) trend line of the primary wave 4 triangle would provide full and final confirmation of this alternate. A full daily candlestick below that trend line would provide me with 100% confidence in this wave count.
This analysis is published about 12:20 a.m. EST.
Hi Lara, where is your gold video for the 18th? Are you OK?
Analysis for the 18th will be published soon.
Probably. I will get to GDX today or tomorrow.
Hi Lara,
in your hourly wave count you have a subminuette wave 4, that seems for me not corrective. I think it is an impuls (see my 5min chart). And wave 1 and four is nearly overlapped, so I think minuette wave c is maybe finished already.
Can this be an alternative?
Jan
You’re right. I’ve not paid enough attention to the five minute chart. That looks like an impulse. Either subminuette wave iv is not over, or minuette wave (c) is over (and looks like a “three”) or minuette wave (c) began earlier at the high labeled subminuette wave ii.
In conclusion, this means we may very well NOT see another push lower to 1,289 on Monday. Price may just continue upwards.
A new high above 1,310.83 would confirm minute wave ii in its entirety is over and minute wave iii is underway.
Another alternative count is that wave 4 triangle ended not on July 10th top but on Aug 12th top. Namely the wave 4 triangle has 7 zig zag waves. What is labeles as blue 1 of the fifth wave down in the alternative count is seen as a zig zag of impulse a, corrective b wave and ending diagonal c wave.
If so, we have just started the fifth wave down out of the triangle this past week and the movement is sharp as we have seen on Friday. We may have seen 1-2-i-ii type move down and it may get even sharper downward early next week.
Would appreciate hearing Lara’s comment on this.
James, you are over-analyzing everything. Let’s keep it simple like Lara. If $1280 is breached, then P5 is underway hands down. Until then, the structure looks perfect as an ED. My gut tells me P4 has to kiss the upper weekly trendline from the 2011 top before it starts. This sits around $1260 now. All the buying that came in at $1295 should be enough proof for this.
Triangles are either five or nine waves. They cannot be seven.
Ok… How about this? How about wave 4 being a combination of zig zag – X wave down – a 5 waves triangle?? My suggestion remains the same. A triangle has ended and 5th wave down may have begun late last week.
Hi Lara,
Whenever I try to create an hourly analysis based on the daily analysis in Motivewave my chart gets so compressed with all the higher wave labelling that I cannot see the waves clearly like you seem to be able to do. Could you please devote another lesson in showing us how you overcome this. Or do you have to have a massive screen – I am working with a laptop.
Many thanks.
Okay, when I do Silver or GDX next I’ll video how I do it.
Thanks Lara, should we expect similar wave action on GDX?
thanks