Downwards movement was expected to continue to 1,275 to 1,271, but only a slight new low to 1,280.35 was seen before price turned up. A breach of the short term invalidation point on the hourly Elliott wave chart indicates the next wave has begun.
Summary: I expect overall upwards movement here for a minor degree wave to just above 1,345.22 to last about 17 days in total.
Click on charts to enlarge.
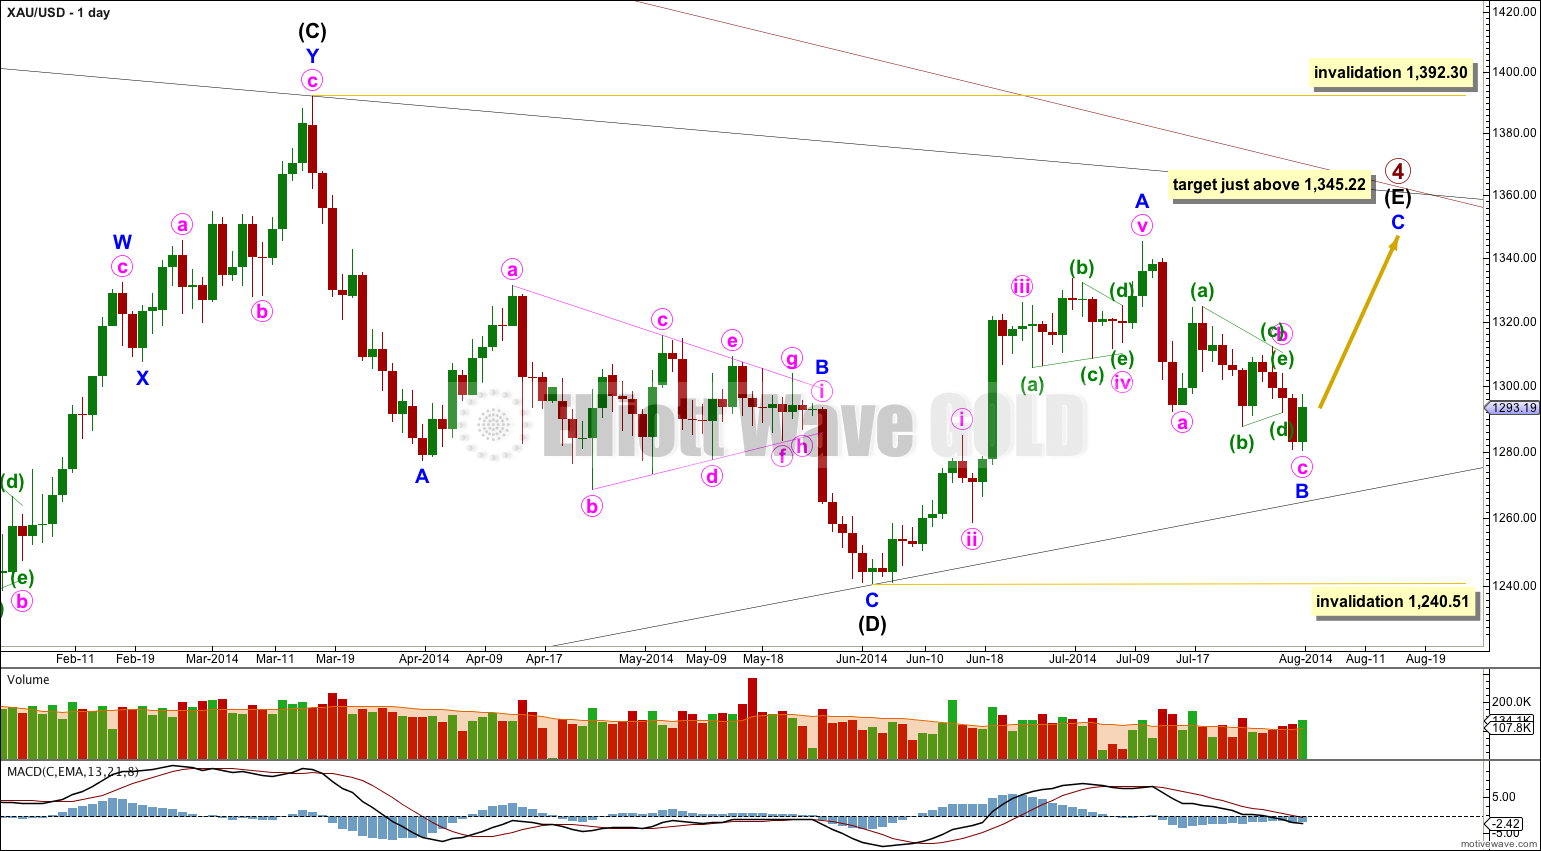
The main wave count sees primary wave 4 as an incomplete regular contracting triangle. Primary wave 2 was a deep 68% running flat correction. Primary wave 4 is showing alternation in depth and some alternation in structure.
Within the triangle of primary wave 4 intermediate wave (E) is unfolding as a zigzag: minor wave A is a five wave impulse and minor wave B downwards is now a complete zigzag.
Because there is a clear triangle within this downwards wave of minor wave B, this movement cannot be a new impulse to the downside because a triangle may not be the sole corrective structure in a second wave position. The position of this triangle indicates strongly that intermediate wave (E) is incomplete.
If minor wave B continues (alternate hourly wave count below) and gets down as low as the black (B)-(D) trend line it should find very strong support there. Only a small intra-day overshoot could be contemplated if this wave count is correct. Minor wave B may not move beyond the start of minor wave A below 1,240.51.
Intermediate wave (E) may not move beyond the end of intermediate wave (C) above 1,392.30.
I can see one alternate possibility today. If primary wave 4 is over at the high labeled minor wave A within intermediate wave (E) then it is possible that primary wave 5 is beginning with a leading diagonal in a first wave position. However, leading diagonals in first wave positions are not very common, and I have never seen a zigzag for a first wave of a leading diagonal which has a triangle in its B wave position. This alternate idea is possible, but I judge it to have a very low probability, maybe as low as 5%. I will only publish this idea if the black (B)-(D) trend line is clearly breached.
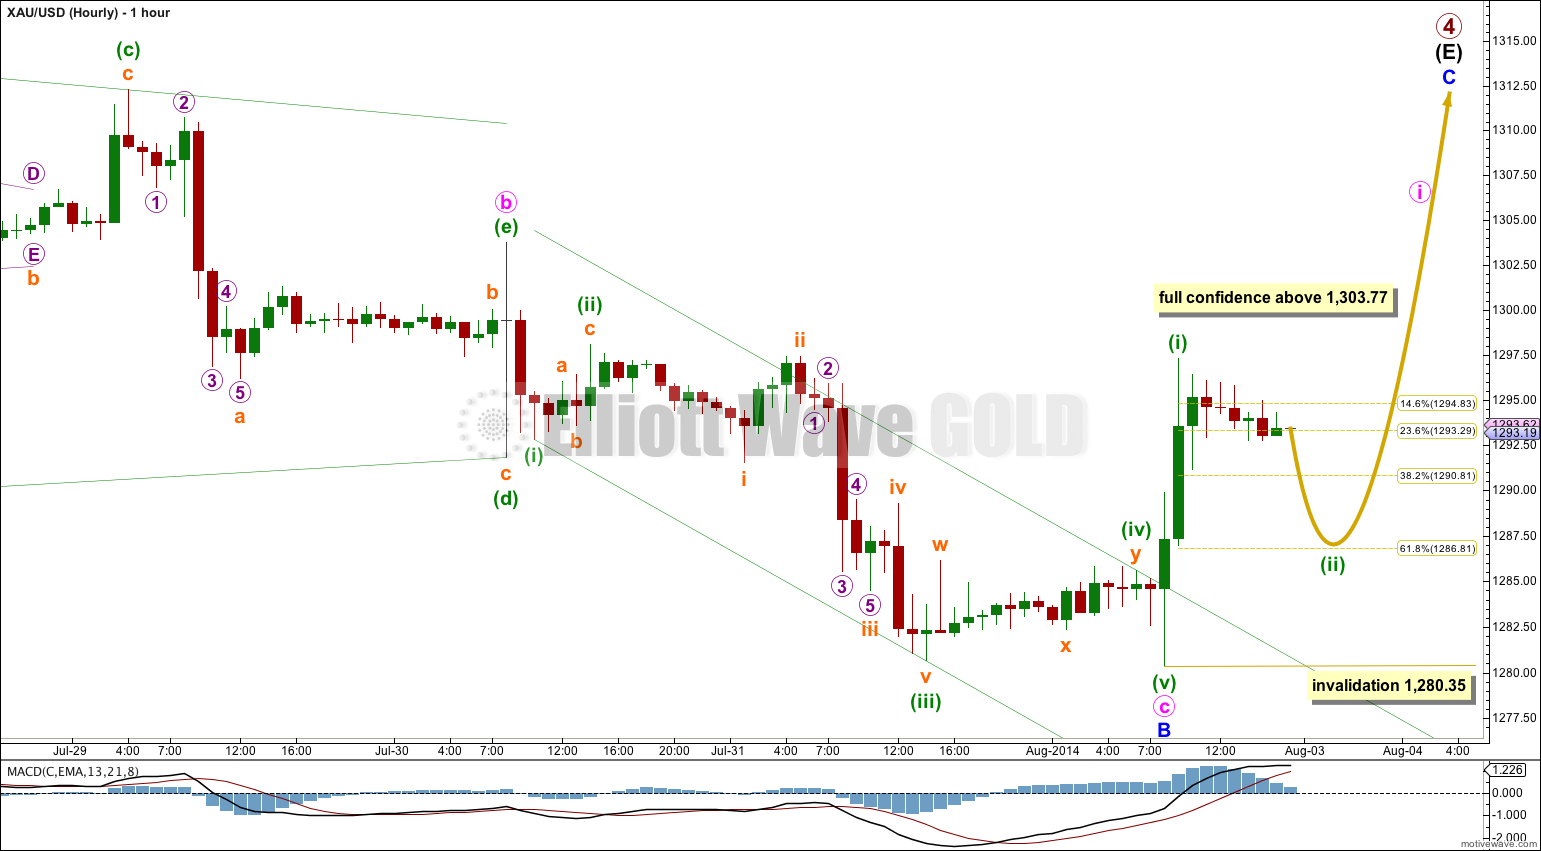
Main Hourly Wave Count.
Ratios within minute wave c are: minuette wave (iii) is just 0.30 short of 1.618 the length of minuette wave (i), and minuette wave (v) has no Fibonacci ratio to either of minuette waves (i) or (iii).
Yesterday’s target was too high; minute wave c has no Fibonacci ratio to minute wave a. The reason why the target was not useful is because the target was calculated at minute and minuette wave degrees (the only two degrees which it was possible to calculate a target) and no Fibonacci ratios were seen for those degrees at the end of the movement.
Once a new low below 1,280.67 was seen then the fifth wave count had been over, and it was. So a subsequent movement above the short term invalidation point on the last hourly chart at 1,292.84 was confirmation that minute wave c was most likely over and the next wave was underway.
Because Friday’s session completed a strong green candlestick I expect this main hourly wave count has a very high probability, perhaps a little over 90%. Waves following triangles like minute wave b do tend to be sharp and brief.
Minor wave A lasted 27 days and minor wave B lasted close to 0.618 that duration at 16 days. Minor wave C would reach 0.618 the length of minor wave A at 1,345 and it would reach 0.618 the duration of minor wave A if it lasts 17 days.
So far minuette wave (ii) may be incomplete. It may follow a common tendency of second waves to be relatively deep, and may end about the 0.618 ratio of minuette wave (i) at 1.286.81.
Minuette wave (ii) may not move beyond the start of minuette wave (i) at 1,280.35.
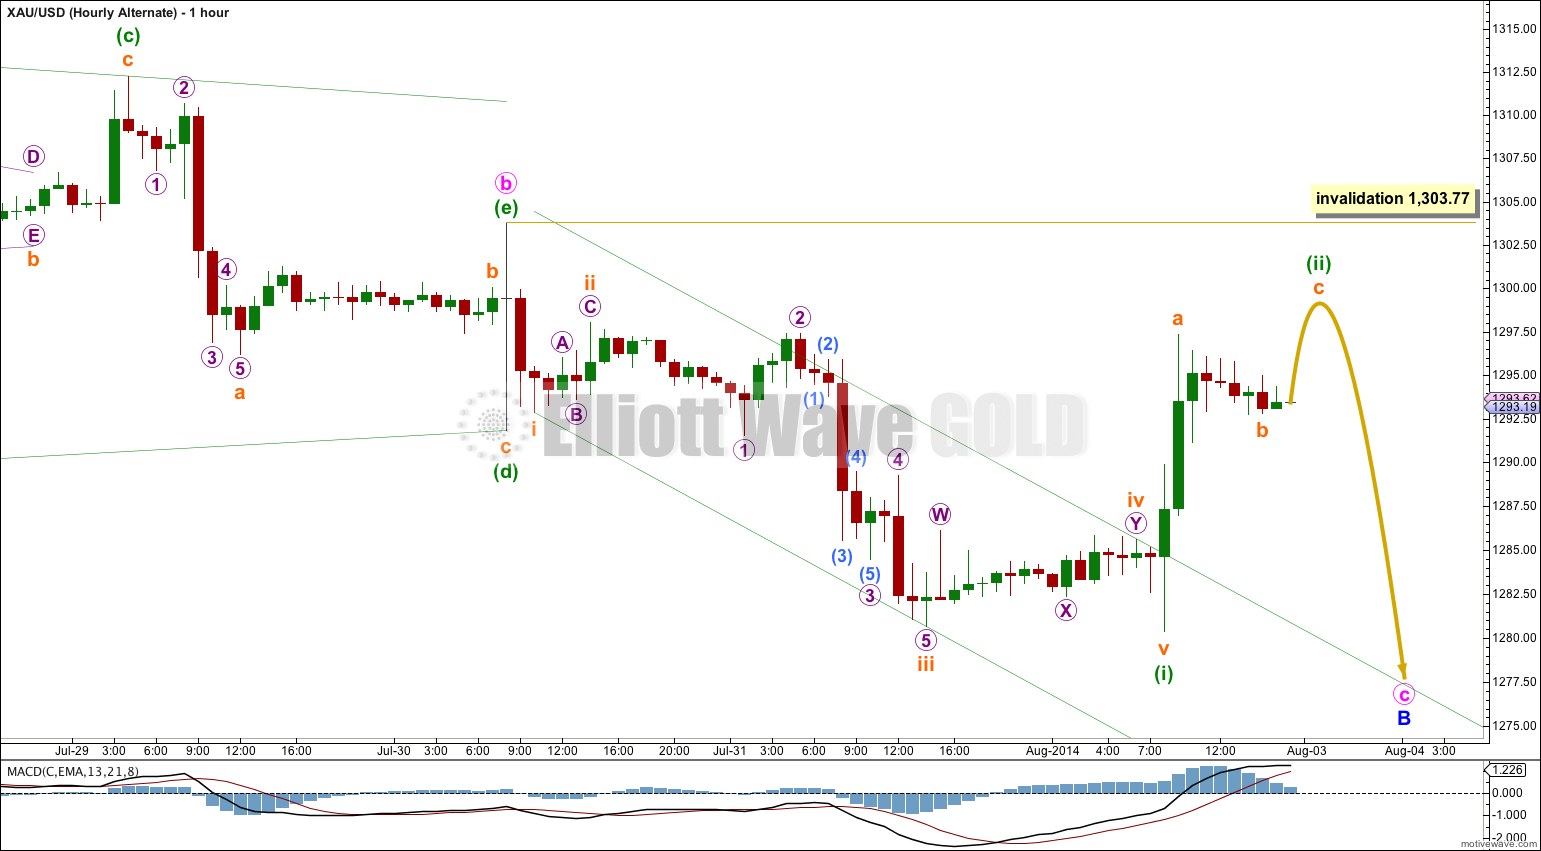
Alternate Hourly Wave Count.
By simply moving the degree of labeling within minute wave c all down one degree it is possible that only minuette wave (i) is over.
This wave count has a very low probability, less than 10%. Waves following triangles are normally relatively brief in length and duration. This alternate expects the more unusual situation of an extended wave after a triangle.
Minuette wave (ii) may not move beyond the start of minuette wave (i) above 1,303.77. Invalidation of this alternate would provide further confidence in the main wave count.
This analysis is published about 11:00 p.m. EST.


Hi Lara. I think that the alternate wave count has greater merit than the 10% you assessed it to be. I agree that the chart pattern looks odd. However, there are two redeeming features for it. Firstly, Minute C would end at roughly 1250, calculating from typical Fibonacci ratios : Minute C begins at 1303.77; Minuette i ends at the point labeled as subminuette a at 1280.65. Extrapolating yields 1250. At a higher degree, at 1250 Minute C is almost equal to Minute A in length, another typical wave ratio. Secondly, silver apparently is almost identical in wave structure as gold. When gold reached 1280.35, silver was at 20.29. Like gold, silver went up in price but then it subsequently dropped below 20.29 to reach a new low of 20.27. Now, if silver does not diverge from gold in wave count, this would clearly inviolate your main wave count for gold. Thoughts please. Thank you.
My apologies. One part of the text somehow got mixed up when I posted it. It should read “Minute C begins at 1303.77; Minuette i ended at 1280.35, both shown on the graph. Minuette ii ends at the point labeled as subminuette a at 1296.87. Extrapolating yields roughly 1256, 1272 and 1250.”
Please read the comments guidelines.
Please provide a chart for your idea.