
Last Elliott wave analysis expected some downwards movement before more upwards movement, but this is not what happened. Price moved higher before turning lower to complete a red doji candlestick for Friday’s session. This changes the wave count slightly, but the mid term outlook and target is exactly the same.
Summary: Upwards movement is closer to an end and may not last a total 17 days. The target for upwards movement to end can now be calculated at 1,346. This target may be met in two to seven days. In the short term I expect some sideways movement for another one to two days before the final upwards wave.
Click on charts to enlarge.
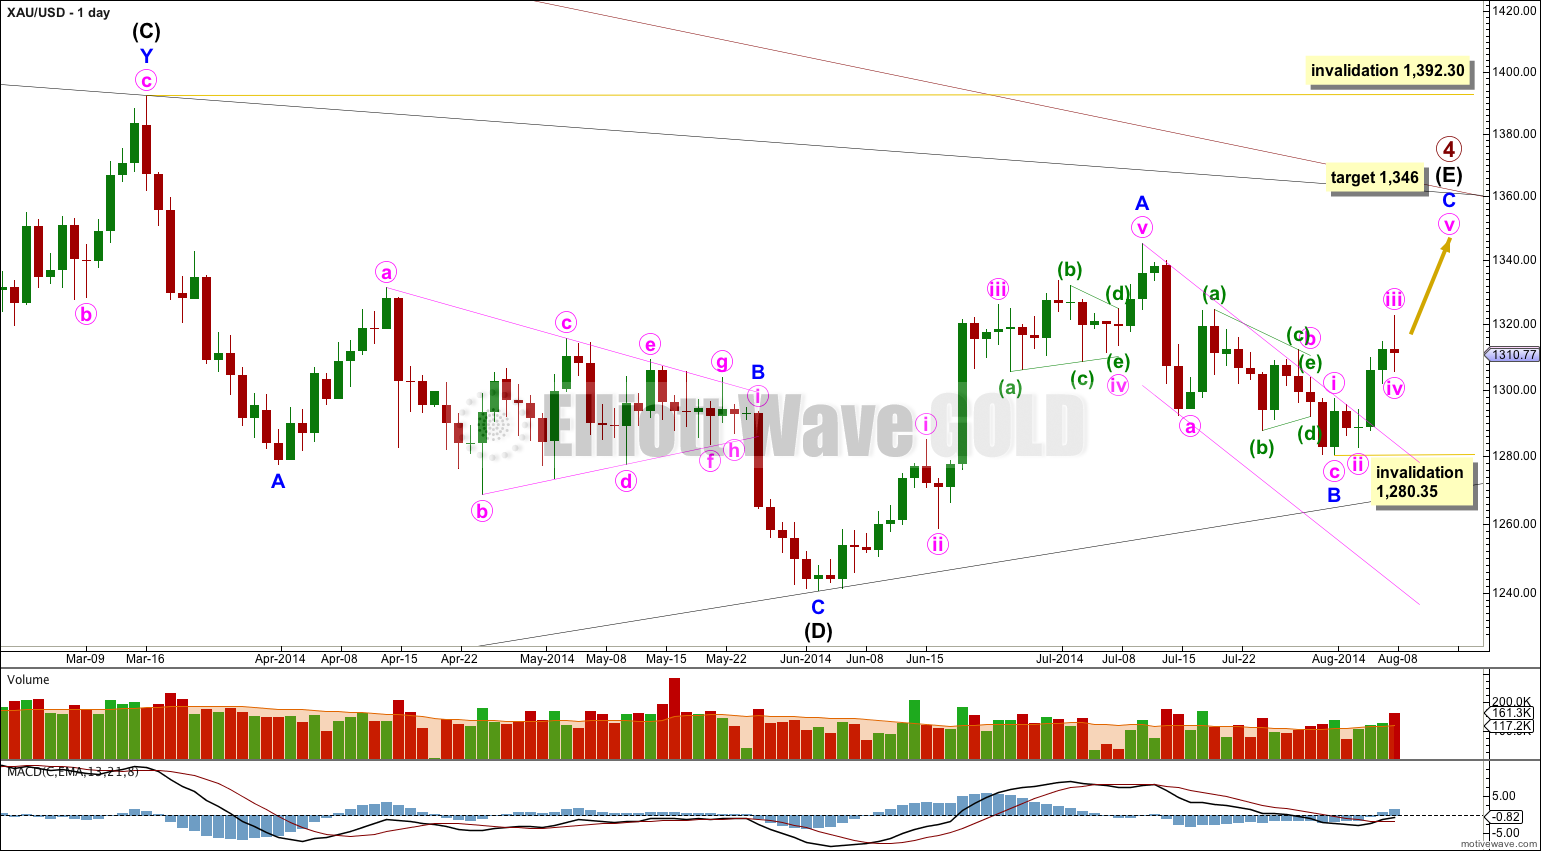
Primary wave 4 is an incomplete regular contracting triangle. Primary wave 2 was a deep 68% running flat correction. Primary wave 4 is showing alternation in depth and some alternation in structure.
Within the triangle of primary wave 4 intermediate wave (E) is unfolding as a zigzag: minor wave A is a five wave impulse and minor wave B downwards is a zigzag. I have drawn a corrective channel about minor wave B downwards. This channel is now breached by a full candlestick above the channel and not touching it, confirming minor wave B is over and minor wave C upwards has begun.
Because there is a clear triangle within this downwards wave of minor wave B, this movement cannot be a new impulse to the downside because a triangle may not be the sole corrective structure in a second wave position. The position of this triangle indicates strongly that intermediate wave (E) is incomplete.
Within minor wave C no second wave correction may move beyond its start below 1,280.35.
Intermediate wave (E) may not move beyond the end of intermediate wave (C) above 1,392.30.
I can still see another alternate possibility today. If primary wave 4 is over at the high labeled minor wave A within intermediate wave (E) then it is possible that primary wave 5 has began with a leading diagonal in a first wave position which would be complete, and this would be followed by a very deep second wave correction. However, leading diagonals in first wave positions are not very common. This alternate idea is possible, but I judge it to have a very low probability, maybe as low as 5%. I will only publish this idea if the black (B)-(D) trend line is clearly breached.
Main Hourly Wave Count.
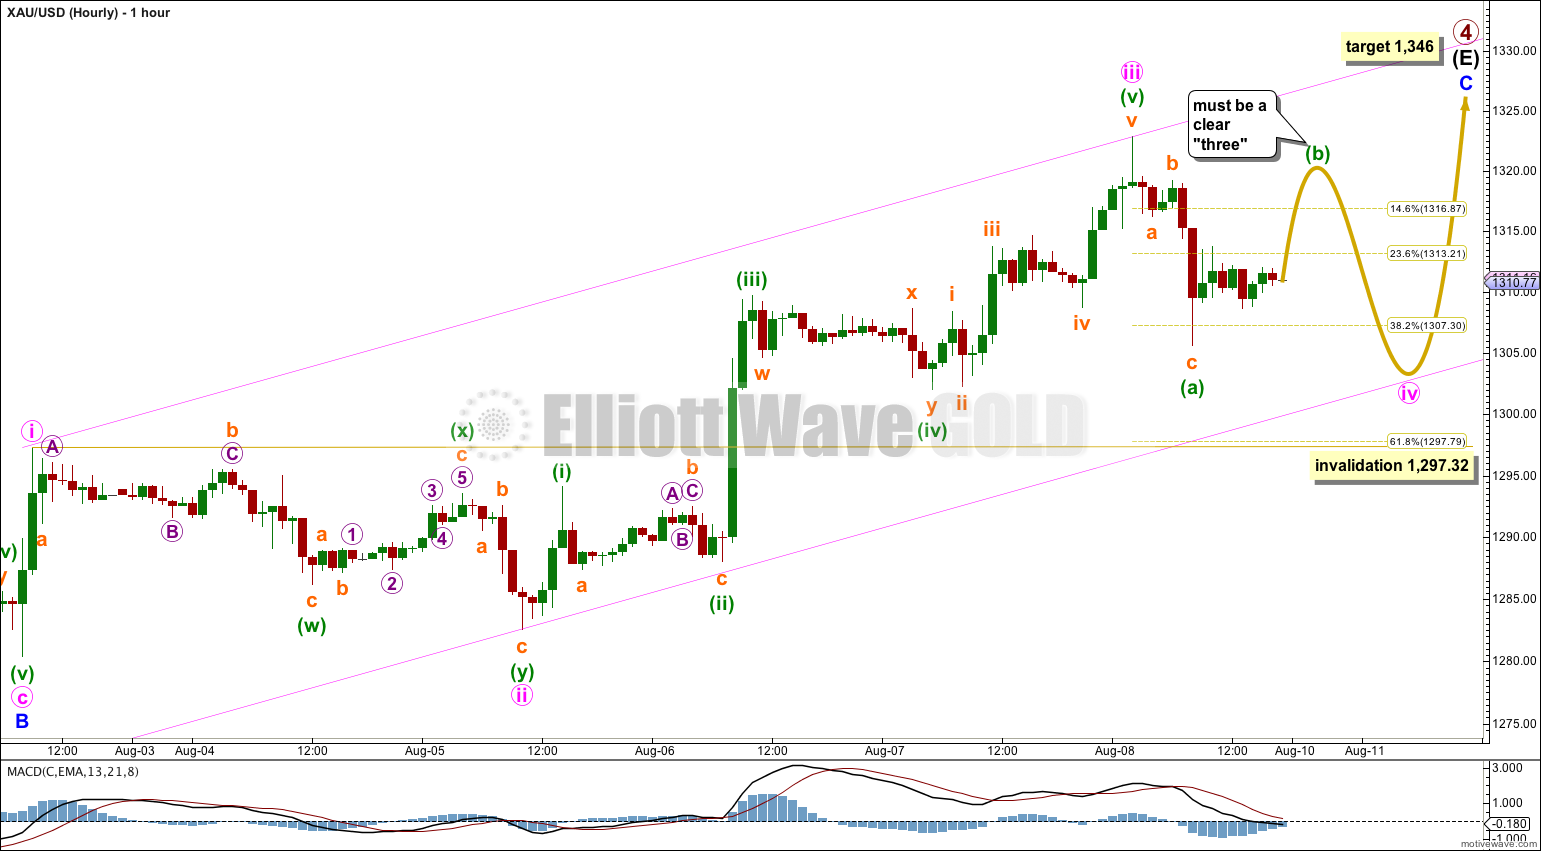
I have moved the degree of labeling within minute wave iii up one degree. Further upwards movement to its end suggests that this third wave is over. It is much longer than equality with minute wave i, and longer than 1.618 the length of minute wave i. There is no Fibonacci ratio between minute waves i and iii. This makes it more likely we shall see a Fibonacci ratio between minute wave v and either of i or iii.
Minute wave iv may not be over. So far it has moved to just below the 0.382 Fibonacci ratio of minute wave iii at 1,307.30. If minute wave iv continues further I would expect mostly sideways movement, not much lower, and a shallower correction than minute wave ii, because I would expect minute wave iv to provide alternation.
If minute wave iv continues sideways it would most likely be a flat or triangle. Both are more time consuming sideways movements with triangles being particularly more time consuming. If it is a regular triangle then it may move only sideways and not have another low below 1,305.59. If it is a flat correction then within it minuette wave (b) may make a new price extreme beyond the start of minuette wave (a) above 1,322.83.
The only way to tell if minute wave iv is continuing or not is a careful analysis of the next upwards wave, whether or not it makes a new high above 1,322.83. If the next upwards wave looks like a three, then minute wave iv is probably continuing. If the next upwards wave is a five, then minute wave iv is over and minute wave v is underway.
This main wave count has a slightly higher probability with the alternate wave count below. If minute wave iv continues further it would have better alternation and better proportion to minute wave ii.
If minute wave iv continues it may find support at the lower edge of the parallel channel.
Draw a parallel channel about minor wave C: draw the first trend line from the ends of minute waves i to iii, then place a parallel copy on the end of minute wave ii. Minute wave v may end either mid way within this channel, or it may find resistance at the upper edge.
Minute wave iv may not move into minute wave i price territory below 1,297.32.
I would judge this main wave count to be about 60% likely.
Alternate Hourly Wave Count.
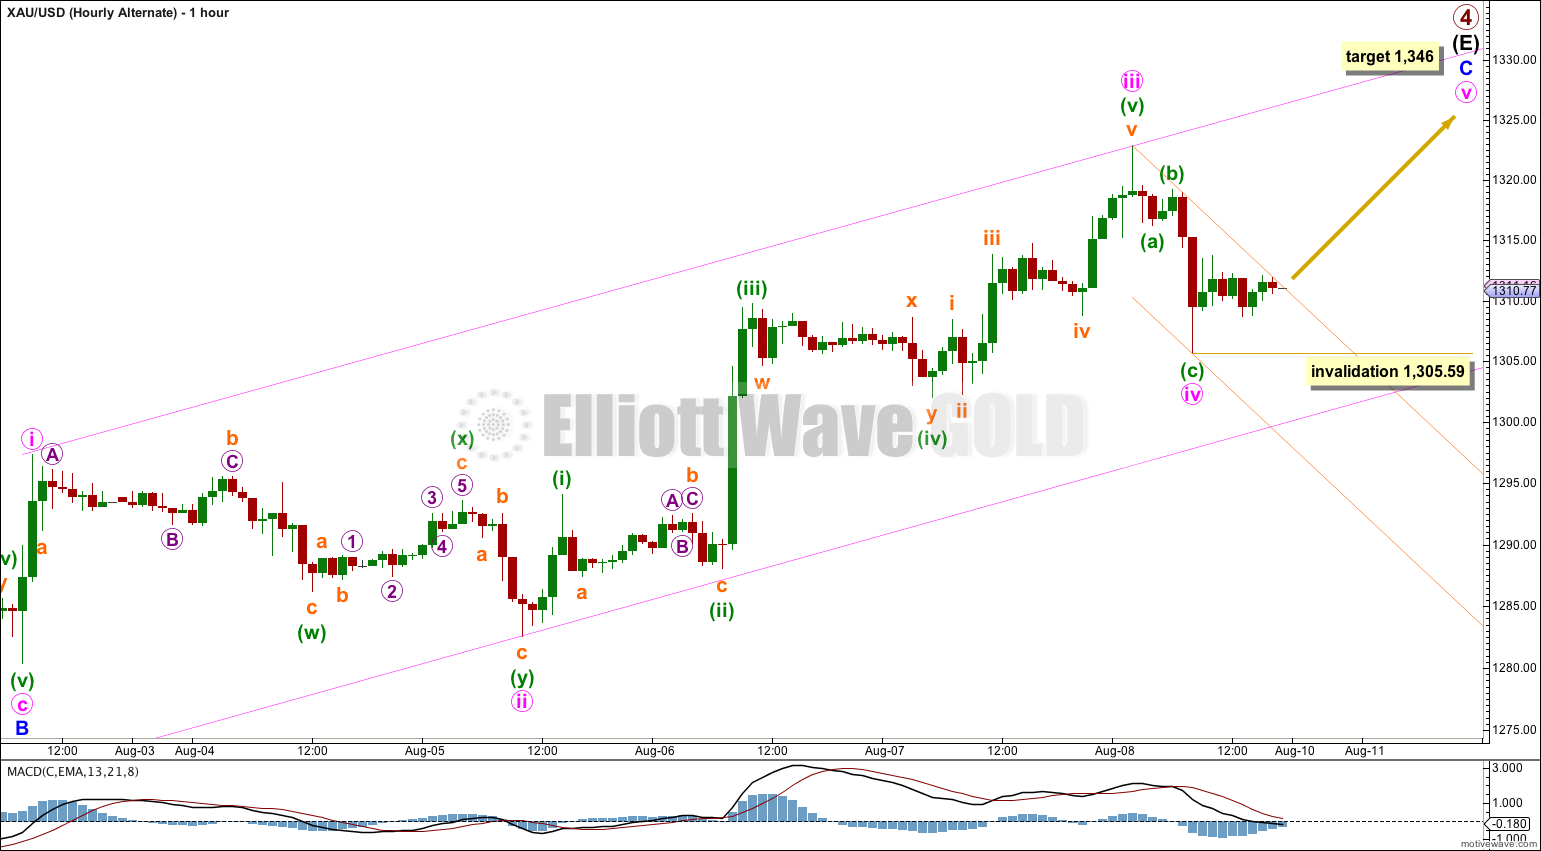
If minute wave iv is over here as a brief zigzag there is alternation between minute waves ii and iv and they both show clearly on the daily chart. Minute wave ii is a very deep 87% double zigzag. Minute wave iv may be a complete shallow 43% single zigzag. At 1,346 minute wave v would reach equality in length with minute wave iii.
Within minute wave v no second wave correction may move beyond the start of its first wave below 1,305.59.
I consider this alternate wave count to have a reasonable probability because both minute waves ii and iv show clearly on the daily chart. Although they are not perfectly in proportion overall this wave count has a reasonably good look.
I would judge this alternate to be 40% likely.
This analysis is published about 11:38 p.m. EST.
No clear three up and 105.59 is breached to the downside. Is wave four over? Is this wave 5?
I think its a triangle.
And its not quite done yet, but getting close. Watch for price to find support at the lower edge of the pink channel.