
Last Elliott wave analysis for Silver expected to see some upwards movement for a second wave correction, but this is not what happened. The first wave moved lower.
I expect now that we shall see downwards movement towards 18.802 to complete a third wave. Notice that since 1st of August Gold has trended sideways (and slightly higher) while Silver has clearly trended downwards. They quite simply do not always have to move together.
I expect that while Gold finishes an ending diagonal (very choppy, generally trending upwards) Silver will complete this downwards impulse and its fourth wave corrections will correspond to Golds upwards waves.
Click on charts to enlarge.
Main Wave Count.
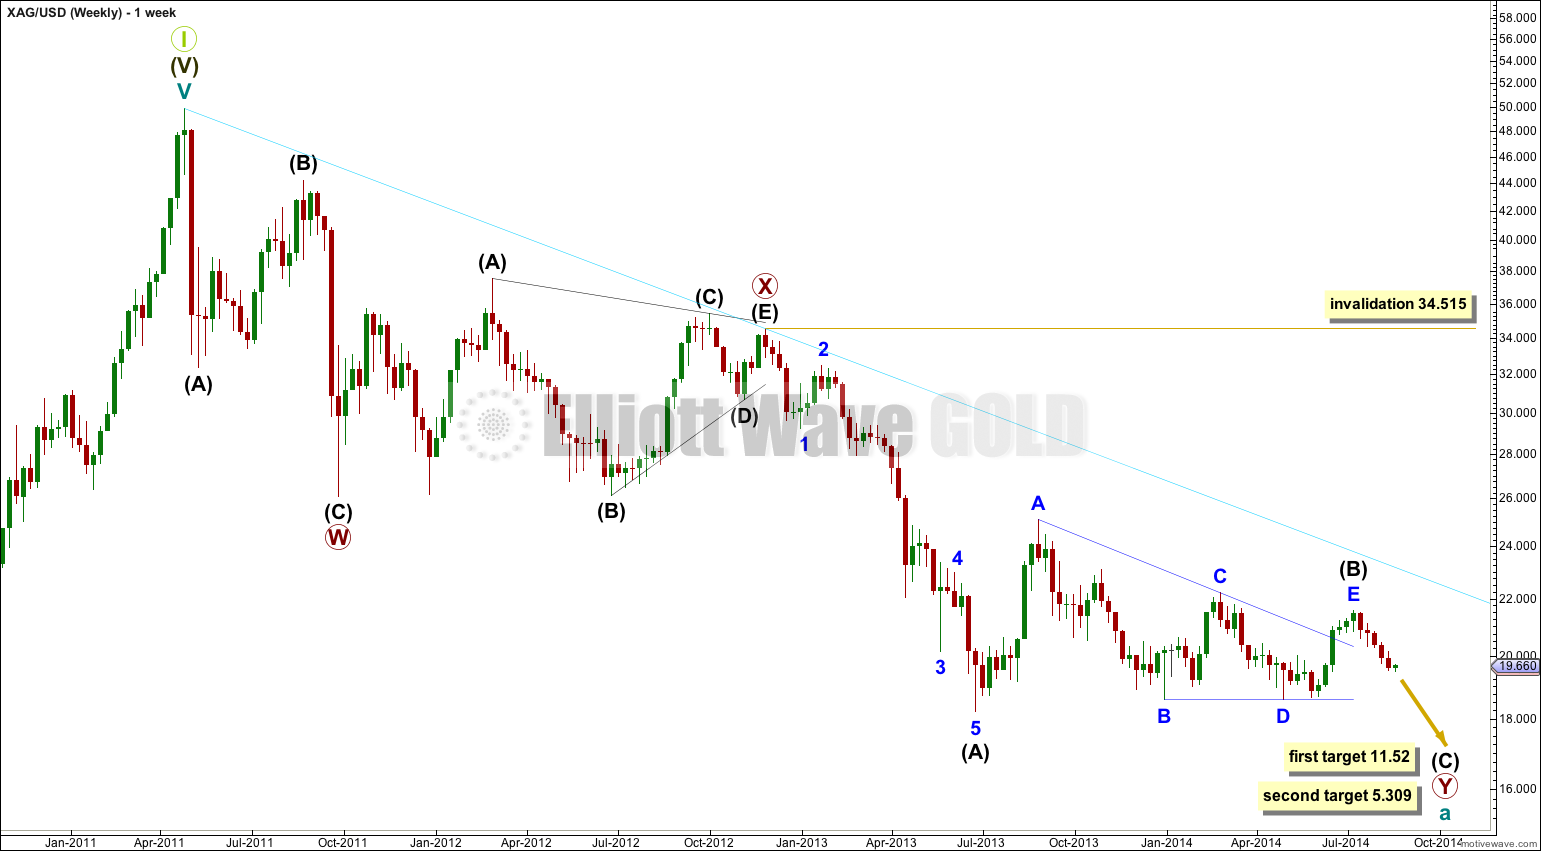
Downwards movement subdivides so far as an incomplete double zigzag. This cannot be an impulse if the movement which I have labeled primary wave X is correct as a triangle because a triangle may not be the sole structure in a second wave position.
The first zigzag in the double is labeled primary wave W. The double is joined by a “three”, a triangle, in the opposite direction labeled primary wave X.
The second zigzag for primary wave Y is moving price lower to deepen the correction, and so this structure has a typical double zigzag look in that it has a clear slope against the main trend.
Within primary wave Y the triangle for intermediate wave (B) is now a complete barrier triangle. Movements following triangles, and particularly barrier triangles, have a tendency to be relatively short and brief. The higher target has a higher probability for this reason.
Within primary wave Y at 11.52 intermediate wave (C) would reach 0.618 the length of intermediate wave (A). At 5.309 intermediate wave (C) would reach equality in length with intermediate wave (A).
Within primary wave Y intermediate wave (A) lasted 30 weeks, and intermediate wave (B) lasted exactly a Fibonacci 54 weeks. I would expect intermediate wave (C) to end in a total 21 or 34 weeks.
The triangle for intermediate wave (B) is very likely to be complete.
Intermediate wave (C) downwards should subdivide as a five wave structure, either an impulse (most likely) or an ending diagonal (less likely). At this stage it is far too early to tell which structure may unfold.
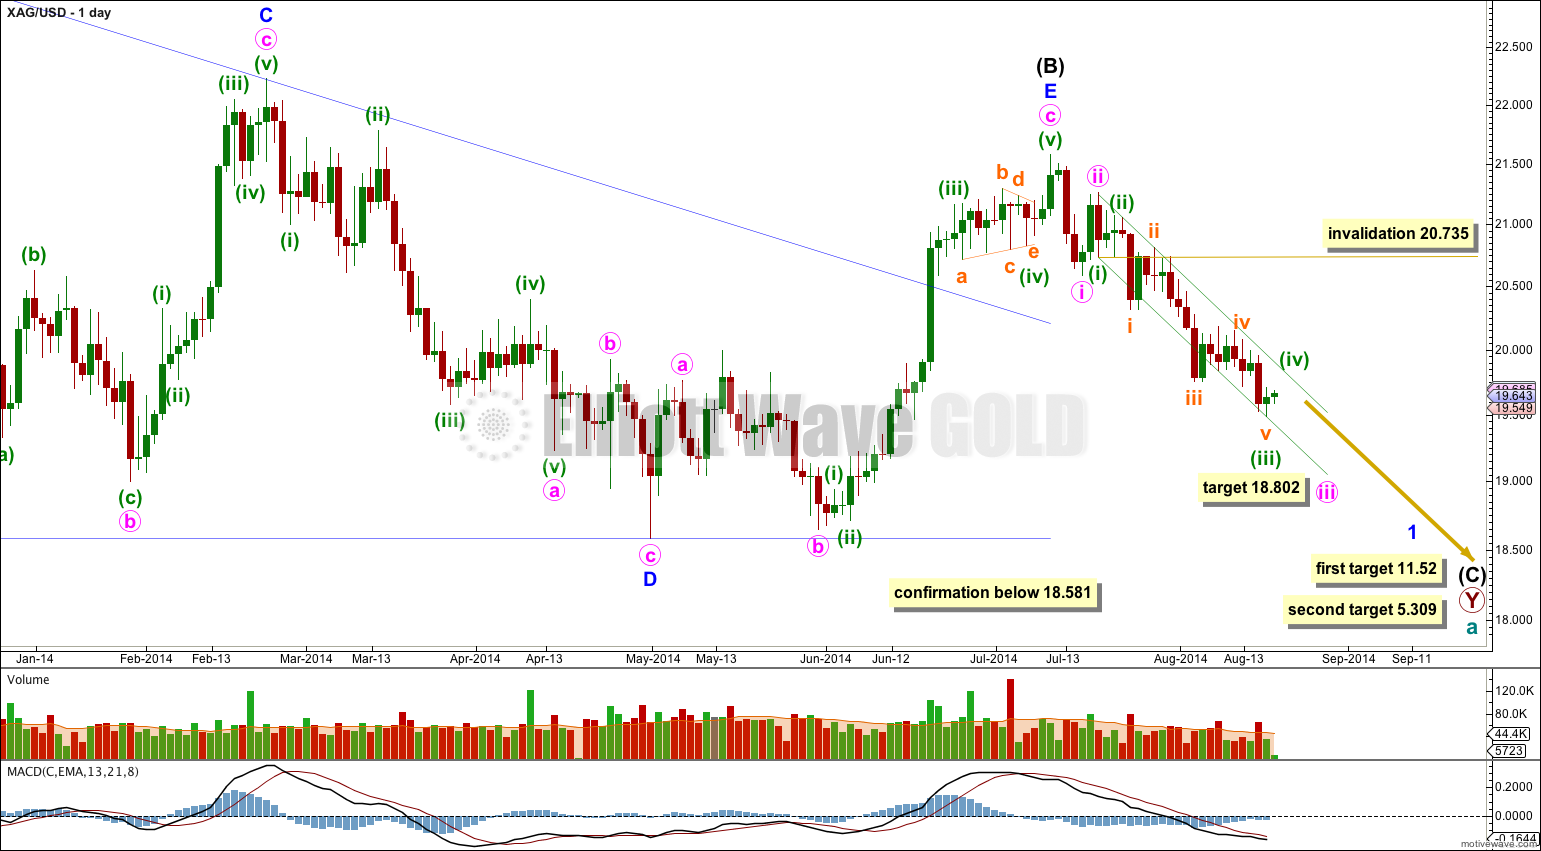
Minor wave 1 is incomplete, and it is unfolding as a simple impulse. Within it the middle of a third wave has passed. There are no Fibonacci ratios between minuette waves (iii) and (i), nor any Fibonacci ratios within the subdivisions of minuette wave (iii). This is slightly unusual for Silver.
At 18.802 minute wave iii would reach 2.618 the length of minute wave i.
Within minute wave iii minuette wave (iv) may not move into minuette wave (i) price territory above 20.735.
Minuette wave (iv) should last about three to seven days in total. It may find resistance at the upper edge of the green channel. Draw the channel using Elliott’s first technique: draw the first trend line from the lows of minuette waves (i) to (iii), then place a parallel copy on the high of minuette wave (ii).
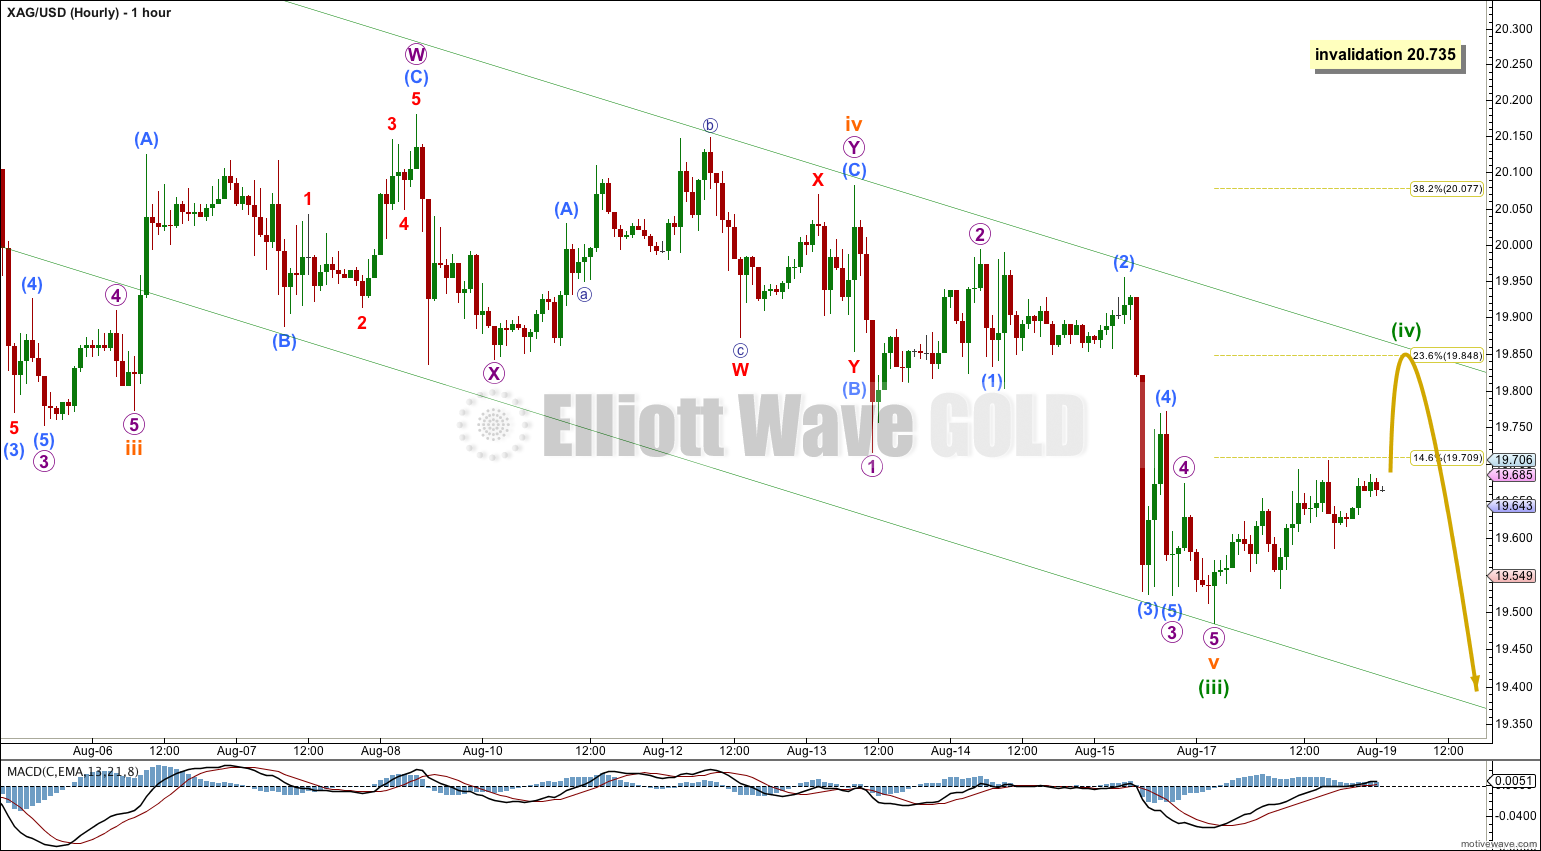
Minuette wave (iii) is most likely over, and minuette wave (iv) has most likely begun.
Minuette wave (iv) may end when price comes very close to, or touches the upper edge of the Elliott channel copied over here from the daily chart.
I would expect minuette wave (iv) to end below the end of the fourth wave of one lesser degree.
Minuette wave (iv) may not move into minuette wave (i) price territory above 20.735.
Alternate Wave Count.
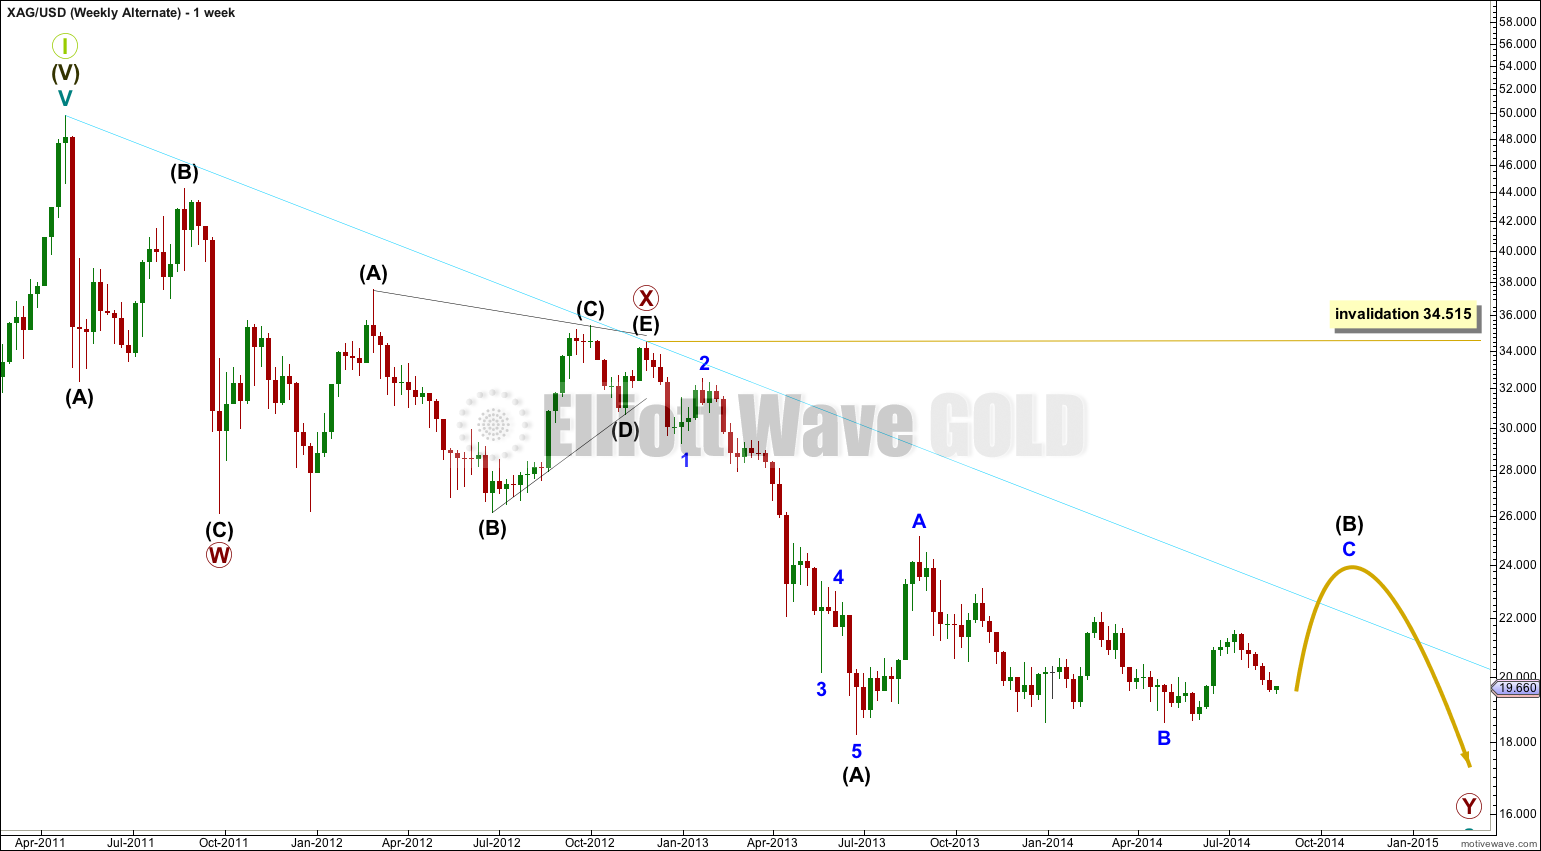
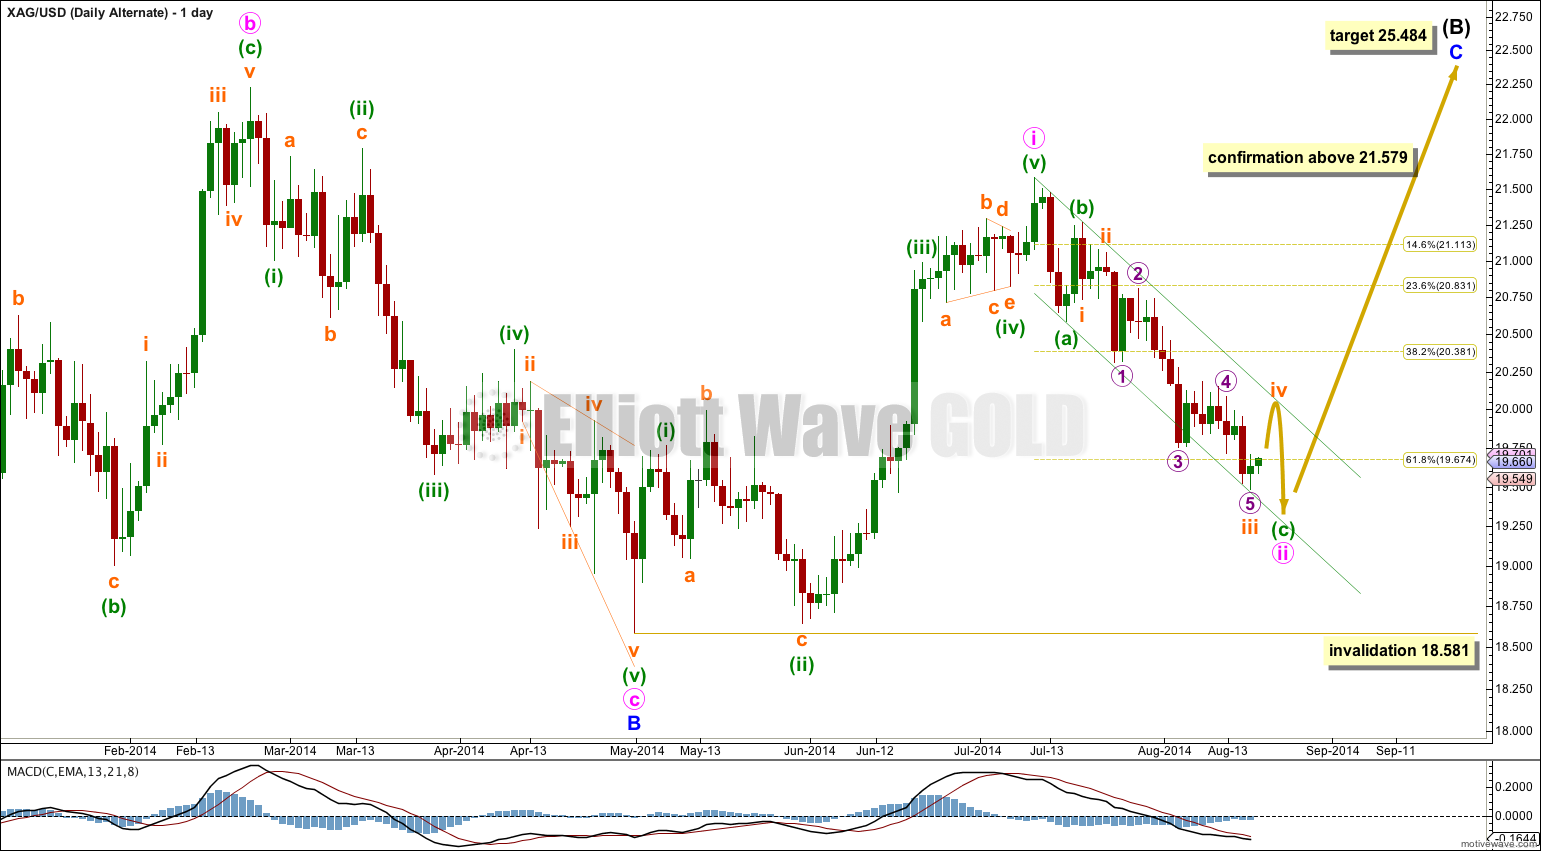
This alternate wave count sees intermediate wave (B) as an incomplete zigzag and not as a complete triangle.
This alternate would expect intermediate wave (B) to break through resistance at the aqua blue trend line. However, this is unlikely and reduces the probability of this wave count to an alternate.
Intermediate wave (B) may not move beyond the start of intermediate wave (A) above 34.515.
Minute wave ii may be continuing lower; the structure must be incomplete.
The channel about minute wave ii is drawn using Elliott’s technique for a correction: the first trend line is drawn from the start of minuette wave (a) to the end of minuette wave (b), then a parallel copy is placed upon the end of minuette wave (a). Only the end of micro wave 3 is overshooting the channel, and as this is a third wave that is entirely acceptable, even should be expected.
Minute wave ii may not move beyond the start of minute wave i below 18.581.
I am still considering this alternate idea because for the main wave count (at the daily chart level) minor wave E of the triangle is such a strong overshoot. Sometimes E waves overshoot the A-C trend line of triangles when they come to an end, but not by that much. It has a slightly strange look.
This wave count requires a new high above 21.579 for confirmation. While price remains below 21.579 the main wave count will have a much higher probability.
At 25.484 minor wave C would reach equality in length with minor wave A.
You’re welcome 🙂
Thank you for the Silver update.