Last Elliott wave analysis expected more downwards movement from Silver. Price has moved lower as expected.
Click on charts to enlarge.
Main Wave Count.
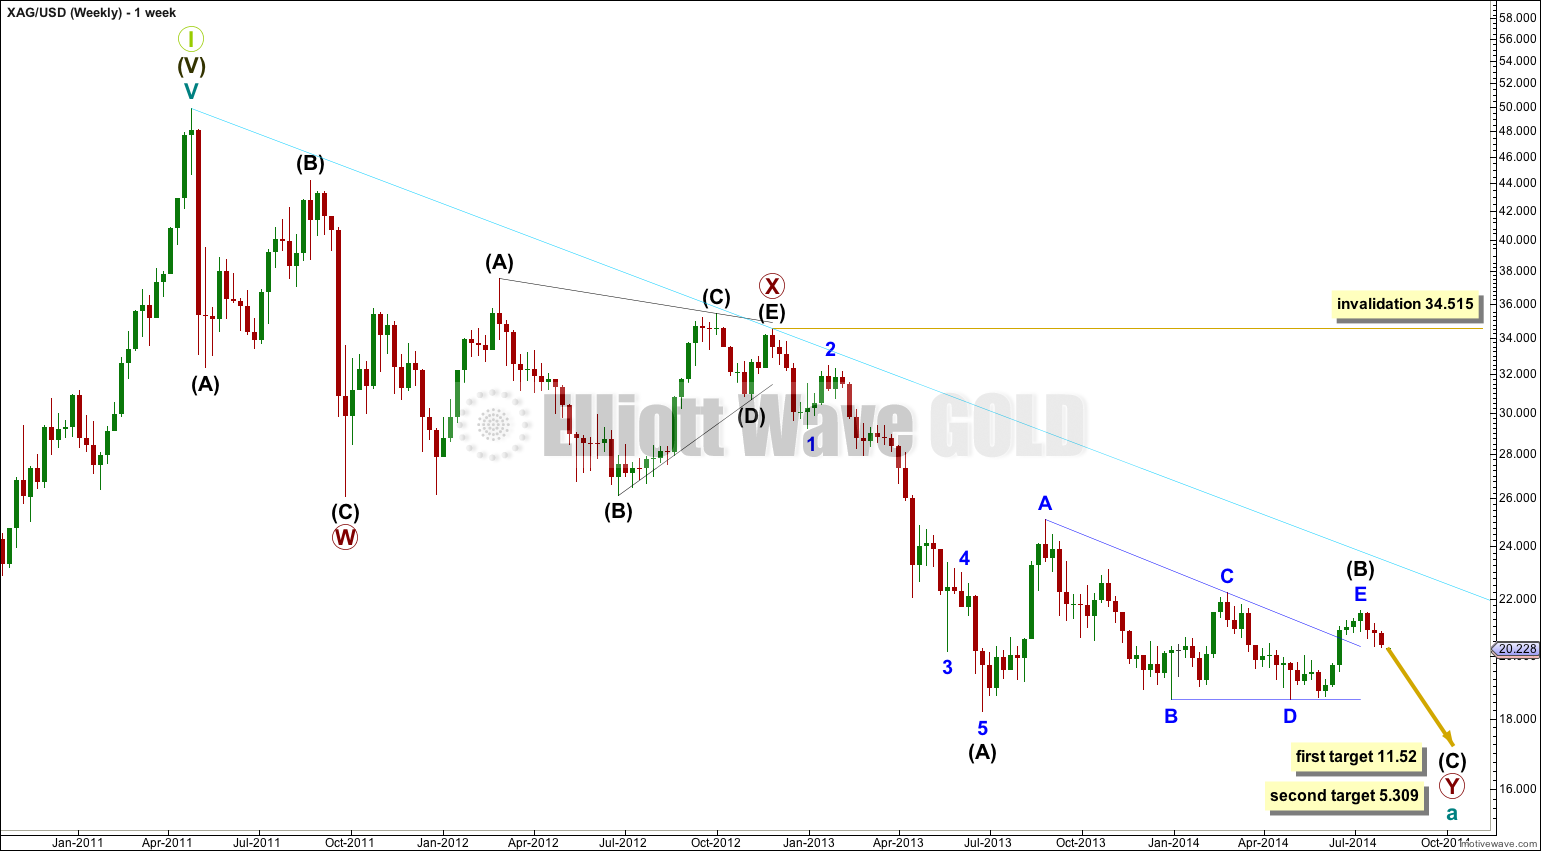
Downwards movement subdivides so far as an incomplete double zigzag. This cannot be an impulse if the movement which I have labeled primary wave X is correct as a triangle because a triangle may not be the sole structure in a second wave position.
The first zigzag in the double is labeled primary wave W. The double is joined by a “three”, a triangle, in the opposite direction labeled primary wave X.
The second zigzag for primary wave Y is moving price lower to deepen the correction, and so this structure has a typical double zigzag look in that it has a clear slope against the main trend.
Within primary wave Y the triangle for intermediate wave (B) is now a complete barrier triangle. Movements following triangles, and particularly barrier triangles, have a tendency to be relatively short and brief. The higher target has a higher probability for this reason.
Within primary wave Y at 11.52 intermediate wave (C) would reach 0.618 the length of intermediate wave (A). At 5.309 intermediate wave (C) would reach equality in length with intermediate wave (A).
Within primary wave Y intermediate wave (A) lasted 30 weeks, and intermediate wave (B) lasted exactly a Fibonacci 54 weeks. I would expect intermediate wave (C) to end in a total 21 or 34 weeks.
The triangle for intermediate wave (B) is complete.
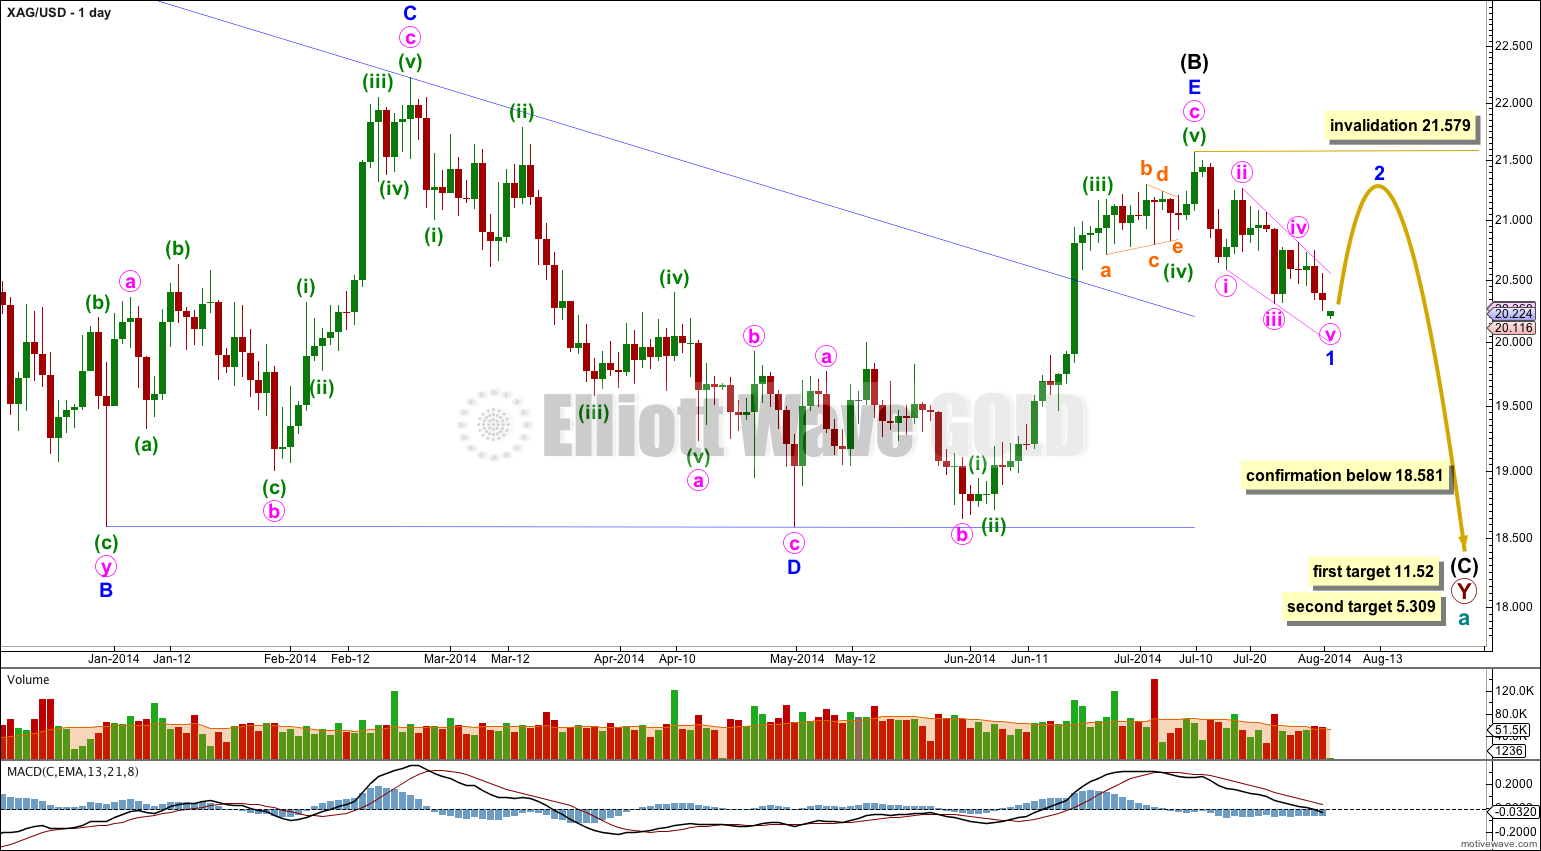
Intermediate wave (C) downwards should subdivide as a five wave structure, either an impulse (most likely) or an ending diagonal (less likely). At this stage it is far too early to tell which structure may unfold.
The first five down is complete as a leading contracting diagonal. Following leading diagonals in first wave positions second wave corrections tend to be very deep. I would expect minor wave 2 to end above the 0.618 Fibonacci ratio of minor wave 1 and be over 80% of minor wave 1.
Minor wave 1 lasted 17 days. I would expect minor wave 2 to be about the same duration.
Within intermediate wave (C) no second wave correction may move beyond the start of its first wave above 21.579.
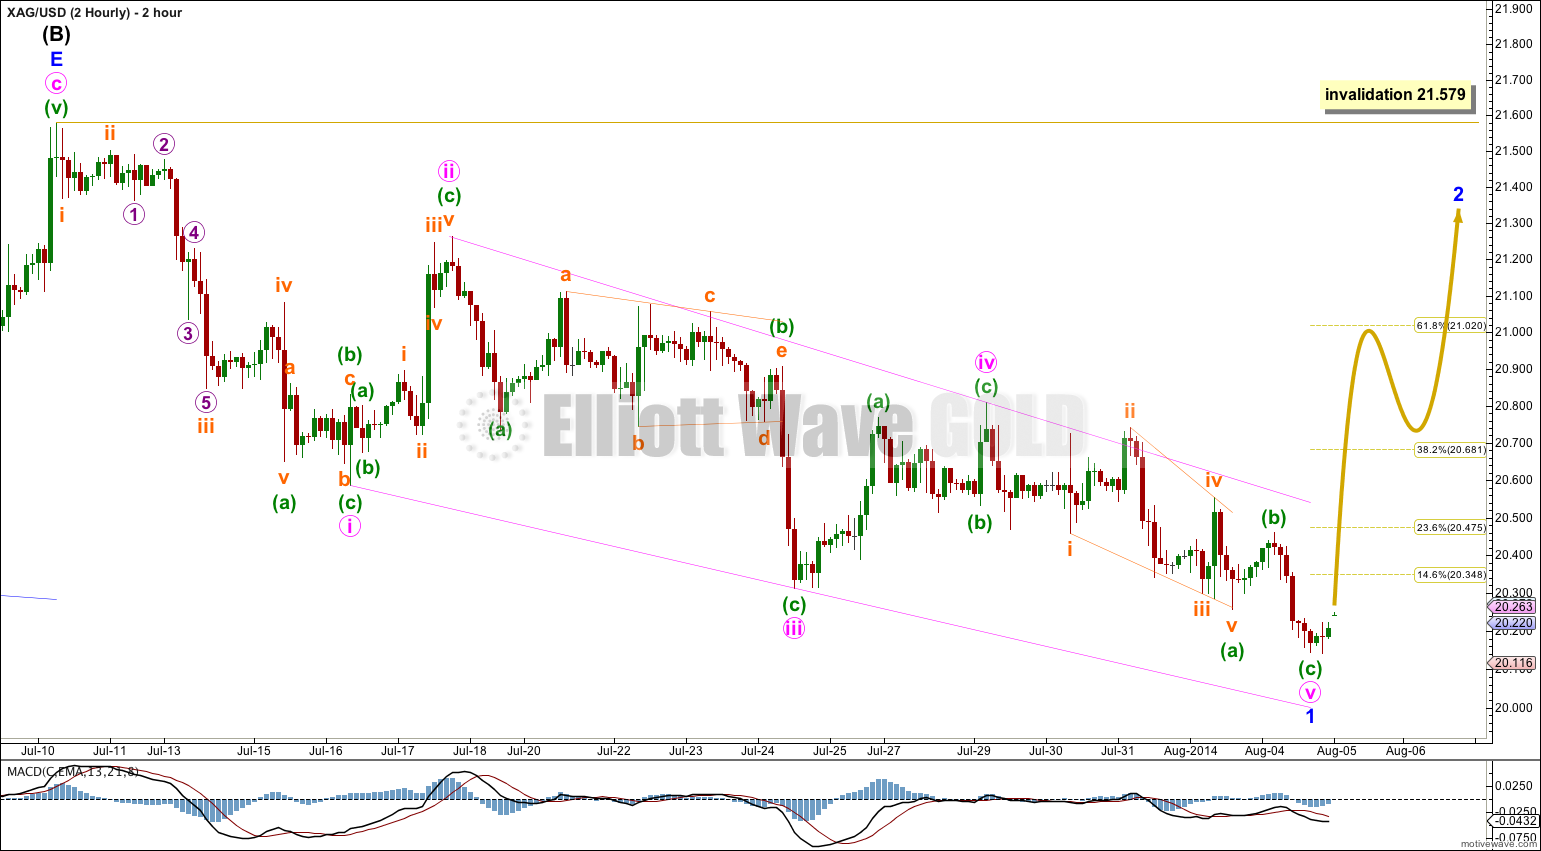
So far to the downside minor wave 1 subdivides as a leading diagonal where all the sub waves are zigzags. The fourth wave overlaps back into first wave price territory as it should for a diagonal.
Minute wave ii is a 68% correction of minute wave i, and minute wave iv is a 52% correction of minute wave iii. Minute wave ii is within the more common range of between 66% to 81% the prior wave while minute wave iv is more shallow.
Minor wave 2 is most likely to unfold as a zigzag, but there are several other possible structures it may take. If it is an expanded flat or combination then it may include a new low below its start. For this reason there can be no lower invalidation point for this correction.
Minor wave 2 may not move beyond the start of minor wave 1 above 21.579.
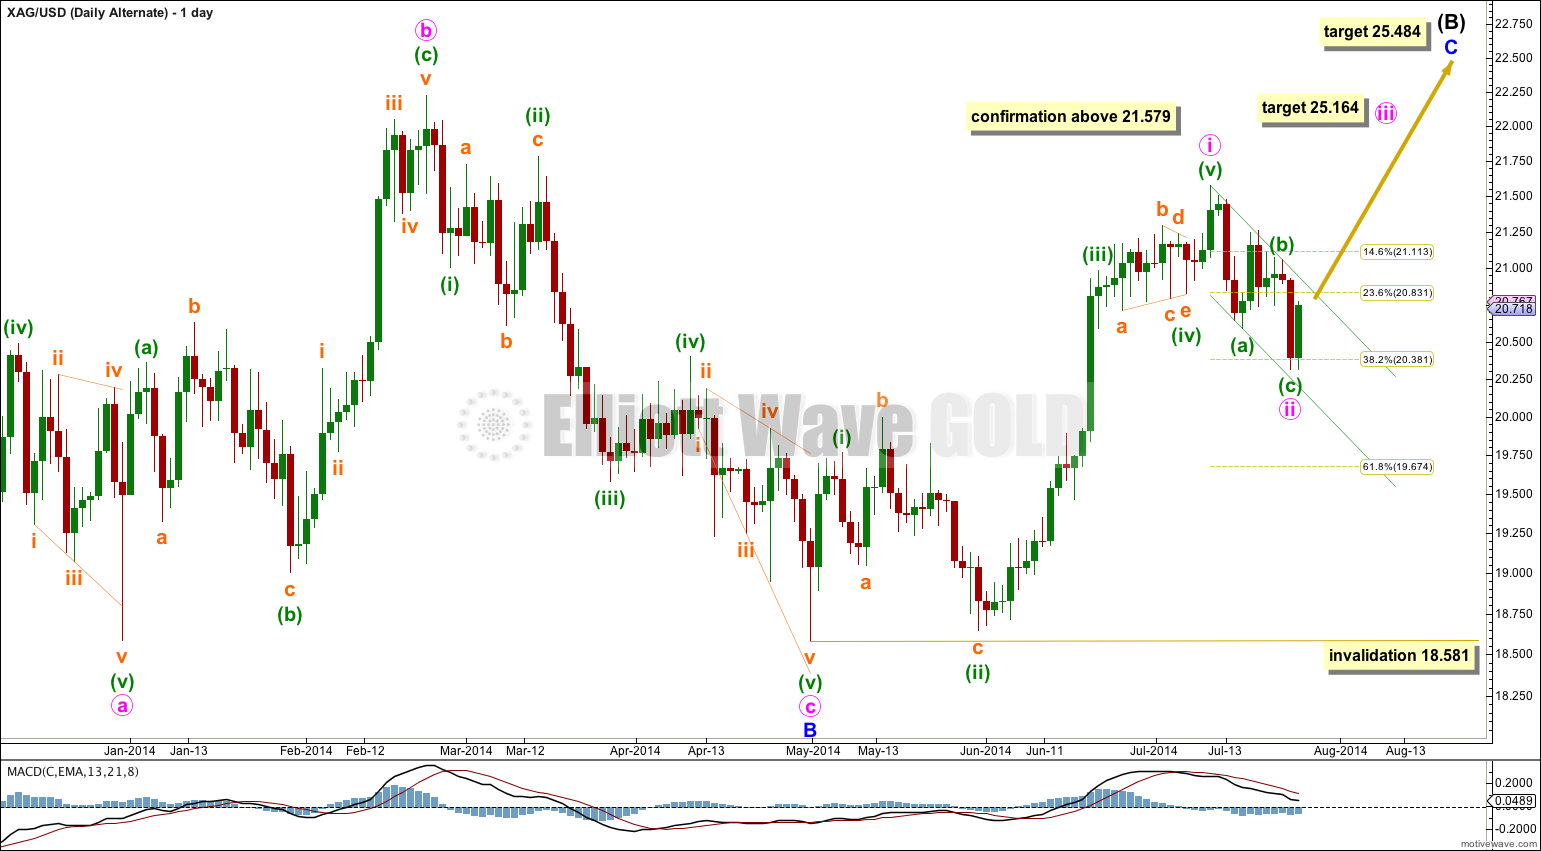
Alternate Wave Count.
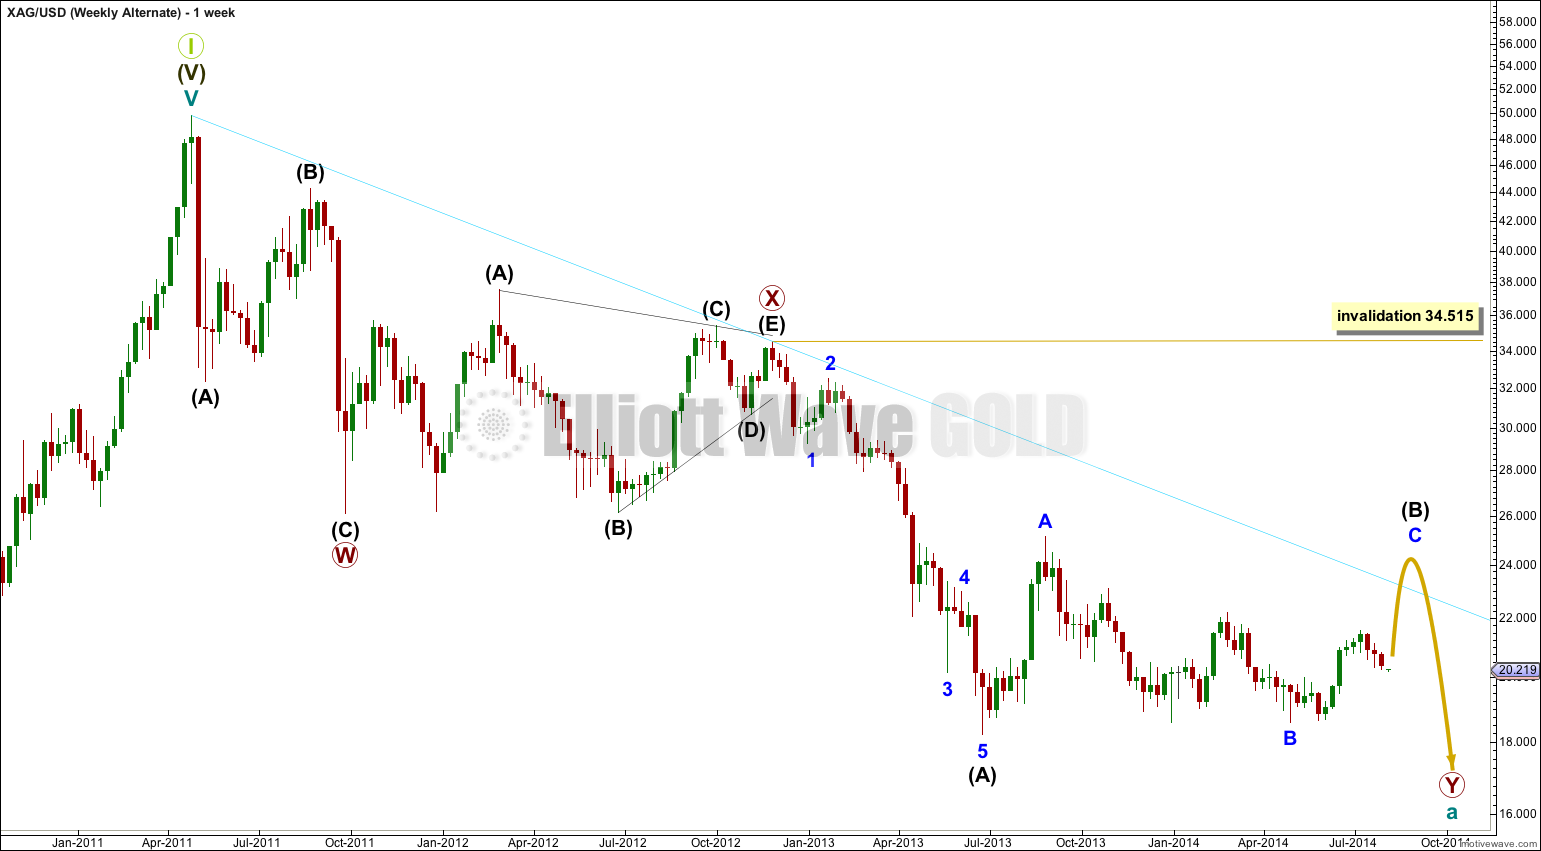
This alternate wave count sees intermediate wave (B) as an incomplete zigzag and not as a complete triangle.
This alternate would expect intermediate wave (B) to break through resistance at the aqua blue trend line. This is unlikely.
Intermediate wave (B) may not move beyond the start of intermediate wave (A) above 34.515.
At 25.484 minor wave C would reach equality in length with minor wave A. Minor wave C is extremely likely to make at least a slight new high above 25.118 to avoid a truncation.
Within minor wave C at 25.164 minute wave iii would reach 1.618 the length of minute wave i.
Minute wave ii may not move beyond the start of minute wave i below 18.581.
I am still considering this alternate idea because for the main wave count (at the daily chart level) minor wave E of the triangle is such a strong overshoot. Sometimes E waves overshoot the A-C trend line of triangles when they come to an end, but not by that much. It has a slightly strange look.
This wave count requires a new high above 21.579 for confirmation. While price remains below 21.579 the main wave count will have a much higher probability.

This morning (8/5), silver is touching as low as 19.8. Is this fifth wave overshoot of the channel for pink v wave?
No. I think my wave count for Silver is wrong.
I think that instead of this being a leading diagonal which is complete, it was more likely a series of overlapping first and second waves. That big move looks more like a strong third wave down.
Thank you for the reply. Does that have a bearish implication for gold and GDX?