
Although the short term target was too high, the second hourly Elliott wave count was more correct.
I have just the one daily Elliott wave count and now one hourly Elliott wave count for you today.
Summary: Downwards movement is incomplete. The short term target is 1,221 where a fourth wave correction which may show up on the daily chart may arrive. The target for the next larger correction is now only 1,218.
Click on charts to enlarge.
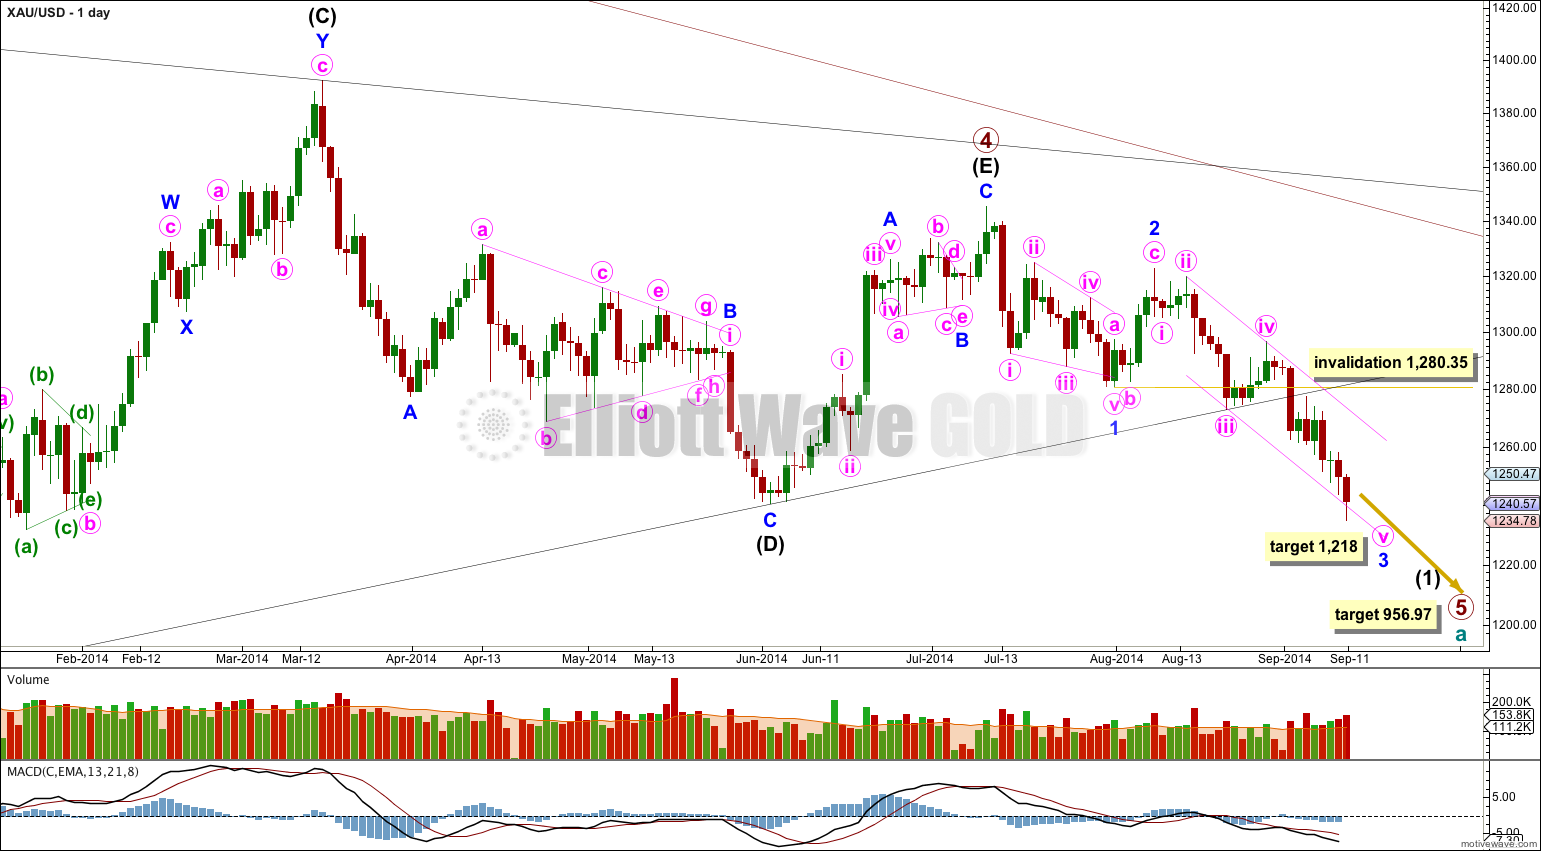
The black (B)-(D) trend line is clearly breached. I have confidence that primary wave 5 has begun. The black (B)-(D) trend line is now also clearly breached on the weekly chart. This is significant.
In the last few trading days it is downwards days which have mostly higher volume. From a traditional technical analysis point of view this indicates the main trend is most likely down.
At 956.97 primary wave 5 would reach equality in length with primary wave 1. Primary wave 3 is $12.54 short of 1.618 the length of primary wave 1, and equality between primary waves 5 and 1 would give a perfect Elliott relationship for this downwards movement.
However, when triangles take their time and move close to the apex of the triangle, as primary wave 4 has (looking at this on a weekly chart is clearer) the movement following the triangle is often shorter and weaker than expected. If the target at 956.97 is wrong it may be too low. In the first instance I expect it is extremely likely that primary wave 5 will move at least below the end of primary wave 3 at 1,180.40 to avoid a truncation. When intermediate waves (1) through to (4) within primary wave 5 are complete I will recalculate the target at intermediate degree because this would have a higher accuracy. I cannot do that yet; I can only calculate it at primary degree.
On a weekly chart extend the triangle trend lines of primary wave 4 outwards. The point in time at which they cross over may be the point in time at which primary wave 5 ends. This does not always work, but it works often enough to look out for. It is a rough guideline only and not definitive. A trend line placed from the end of primary wave 4 to the target of primary wave 5 at this point in time shows primary wave 5 would take a total 26 weeks to reach that point, and that is what I will expect. So far it is in its ninth week.
Minor wave 1 is a leading contracting diagonal. This was followed by a somewhat deep correction, a zigzag for minor wave 2.
Within minute wave v no second wave correction may move beyond its start above 1,296.60.
Draw a channel about minor wave 3 on the daily chart and copy it over carefully to the hourly chart: draw the first trend line from the highs labeled minute waves ii to iv, then place a parallel copy on the low labeled minute wave iii. Minute wave v has overshot the lower edge of this channel, sometimes extended fifth waves behave like this for commodities.
At 1,218 minor wave 3 would reach 1.618 the length of minor wave 1.
Now that minor wave 3 is close to its end I will move the invalidation point down. When it arrives minor wave 4 may not move back into minor wave 1 price territory above 1,280.35.
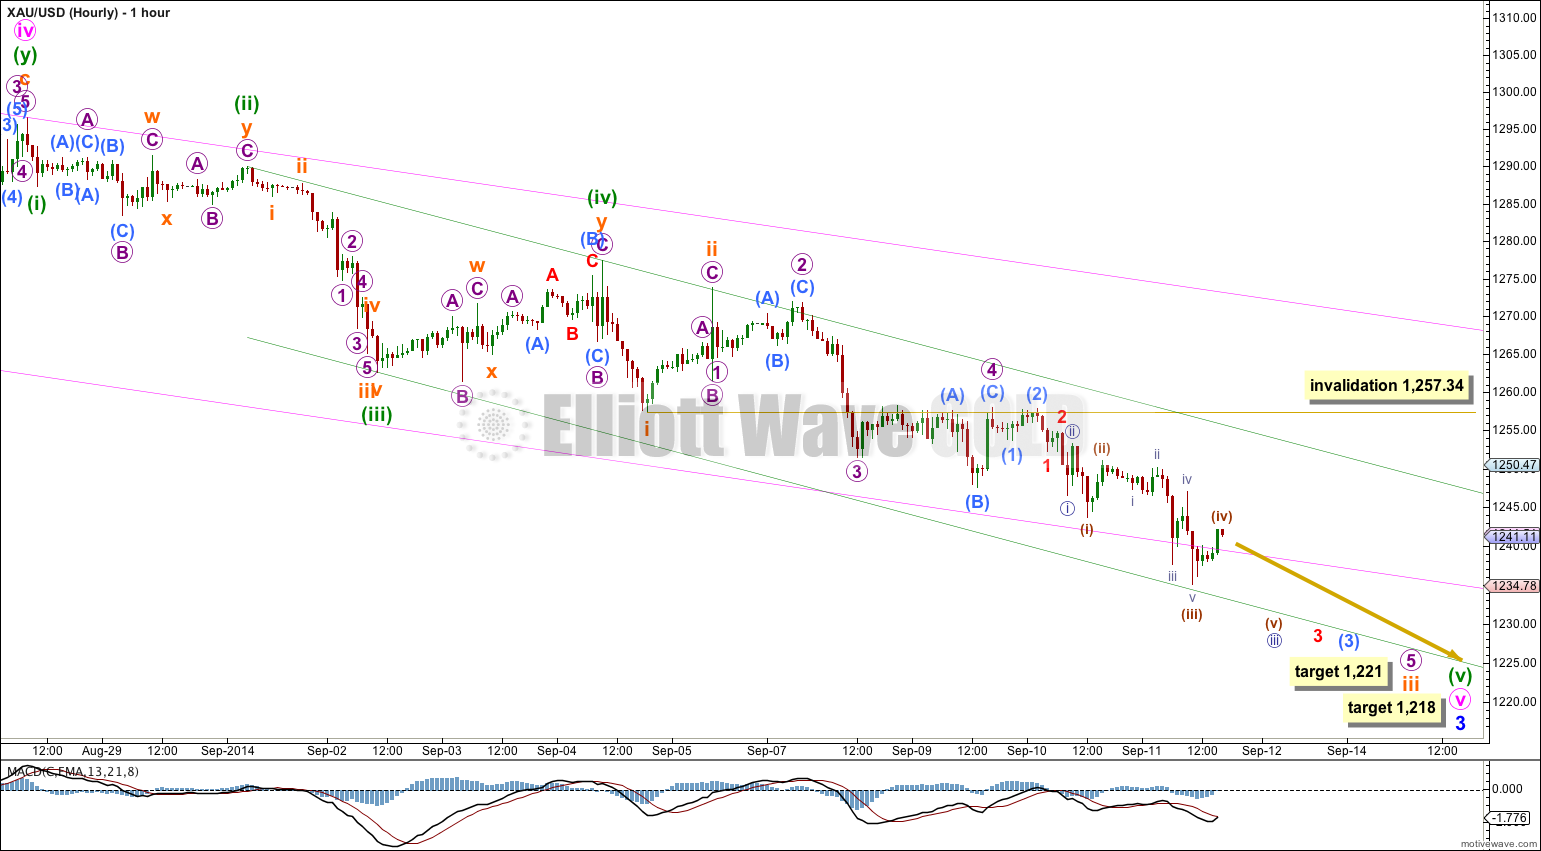
The structure is a little clearer today.
The middle of a third wave down within micro wave 5 has now passed and subdivides as an impulse.
Downwards movement has breached the lower edge of the pink channel copied over here from the daily chart, and is now finding support at the lower edge of the green channel. With the strongest portion, the middle, of micro wave 5 now passed I would expect this lower green trend line to now be breached.
Micro wave 5 is still incomplete. I would expect Friday to complete another red candlestick (or possibly a doji if the structure ends quickly). Along the way down three more small corrections for fourth waves need to complete, and each one may not move into its counterpart first wave price territory. Nano wave iv may not move above 1,246.52, minuscule wave 4 may not move above 1,252.30, and submicro wave (4) may not move above 1,253.74.
At 1,221 subminuette wave iii would reach 2.618 the length of subminuette wave i.
When subminuette wave iii is complete then subminuette wave iv should be a larger correction, and may last one or two days. Subminuette wave iv should show up on the daily chart as one or two green candlesticks or doji, most likely be a flat or triangle or combination, and may not move into subminuette wave i price territory above 1,257.34.
This analysis is published about 05:17 p.m. EST.
Lara, is it possible to give best estimate for intermediate (4) within primary 5–how high will it go?
Looking for best entry to ride primary 5 down to completion.
“In the first instance I expect it is extremely likely that primary wave 5 will move at least below the end of primary wave 3 at 1,180.40 to avoid a truncation. When intermediate waves (1) through to (4) within primary wave 5 are complete I will recalculate the target at intermediate degree because this would have a higher accuracy. I cannot do that yet; I can only calculate it at primary degree.”
No, it’s not possible. I don’t even know where intermediate wave (4) begins, let alone ends.
And before intermediate wave (4) begins there will be intermediate wave (3) down. Third waves are the holy grail of trading opportunities.
Hello Lara, I allowed myself to make a small change to your chart. What do you think?
In doing so the prices below do not come out from the channel drawing from wave 2 purple to wave 4 purple. This would mean, however, having to take off the first 1-2 series of waves that follow.
Thanks!!
the chart…