
Downwards movement continued as expected from last Elliott wave analysis. I have a new alternate wave count for you which differs at the weekly and daily chart level.
Summary: Downwards movement is incomplete. The short term target is 1,221 where a fourth wave correction which may show up on the daily chart may arrive. The target for the next larger correction is now only 1,218.
Click on charts to enlarge.
Main Wave Count.
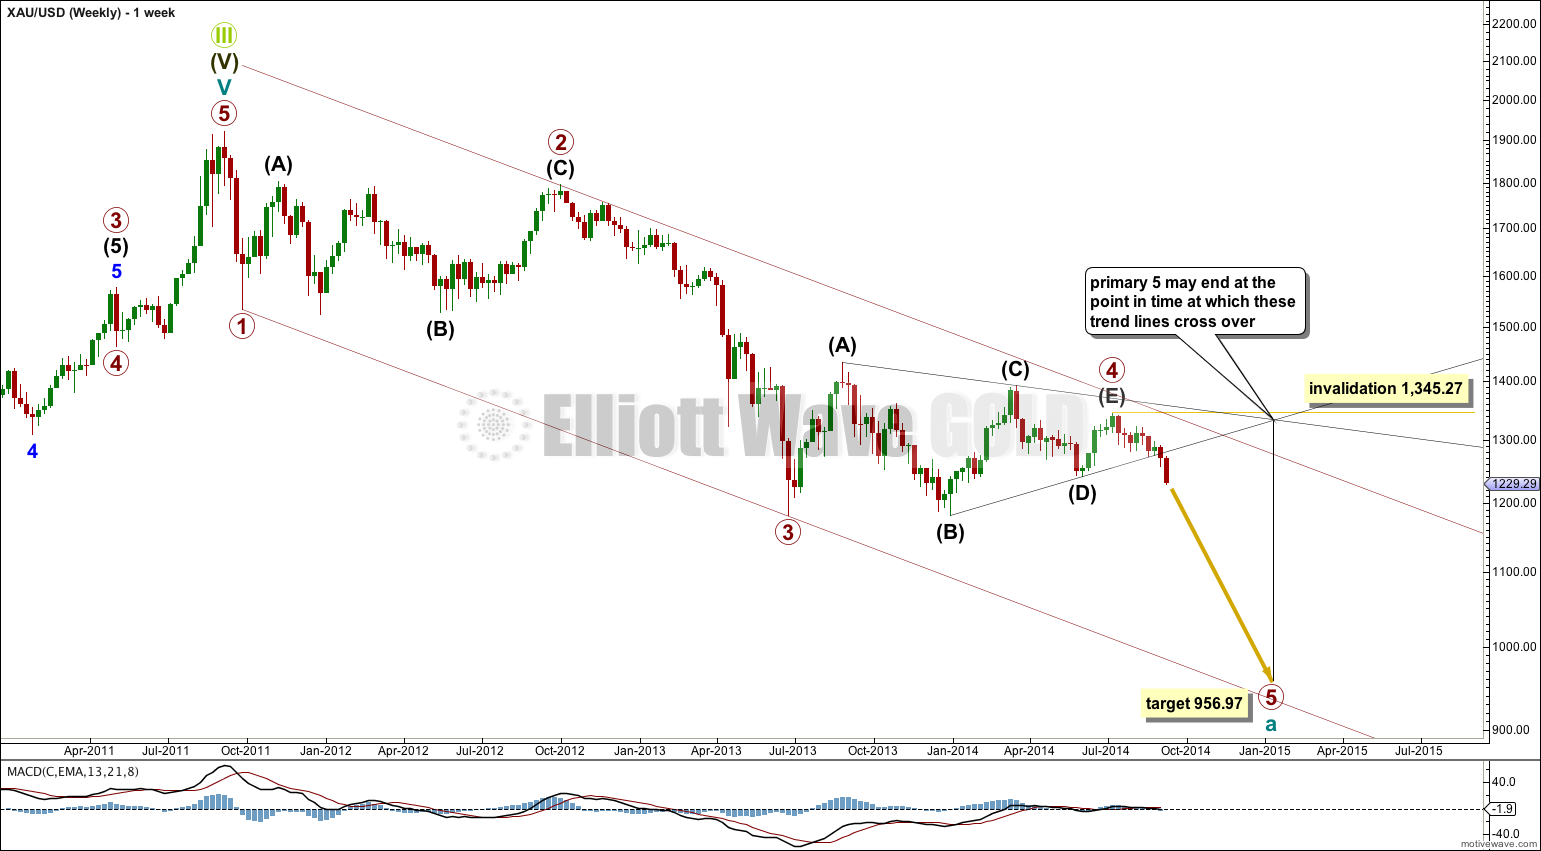
So far since the all time high at 1,921.15 in September 2011 Gold has moved lower in four waves. The final fifth wave down is underway.
Primary wave 3 is $12.54 short of 1.618 the length of primary wave 1. At 956.97 primary wave 5 would reach equality in length with primary wave 1. This is the most likely relationship between first and fifth waves, so this target has the highest probability.
Primary wave 2 was a deep 68% rare running flat correction. Primary wave 4 shows alternation in depth and structure with a shallow 27% regular contracting triangle.
Draw a trend channel about this downwards impulse on the weekly chart and copy it over to the daily chart: draw the first trend line from the lows of primary waves 1 to 3, then place a parallel copy on the high of primary wave 2. I would expect downwards movement for primary wave 5 to find support, and maybe end, at the lower trend line.
Extend the triangle trend lines of primary wave 4 outwards. The point in time at which they cross over may be the point in time at which primary wave 5 ends. This does not always work, but it works often enough to look out for. It is a rough guideline only and not definitive. A trend line placed from the end of primary wave 4 to the target of primary wave 5 at this point in time shows primary wave 5 would take a total 26 weeks to reach that point, and that is what I will expect. So far primary wave has lasted 9 weeks.
The black (B)-(D) trend line is clearly breached. I have confidence that primary wave 5 has begun. The black (B)-(D) trend line is now also clearly breached on the weekly chart. This is significant.
In the last few trading days it is downwards days which have mostly higher volume. From a traditional technical analysis point of view this indicates the main trend is most likely down.
At 956.97 primary wave 5 would reach equality in length with primary wave 1. Primary wave 3 is $12.54 short of 1.618 the length of primary wave 1, and equality between primary waves 5 and 1 would give a perfect Elliott relationship for this downwards movement.
However, when triangles take their time and move close to the apex of the triangle, as primary wave 4 has (looking at this on a weekly chart is clearer) the movement following the triangle is often shorter and weaker than expected. If the target at 956.97 is wrong it may be too low. In the first instance I expect it is extremely likely that primary wave 5 will move at least below the end of primary wave 3 at 1,180.40 to avoid a truncation. When intermediate waves (1) through to (4) within primary wave 5 are complete I will recalculate the target at intermediate degree because this would have a higher accuracy. I cannot do that yet; I can only calculate it at primary degree.
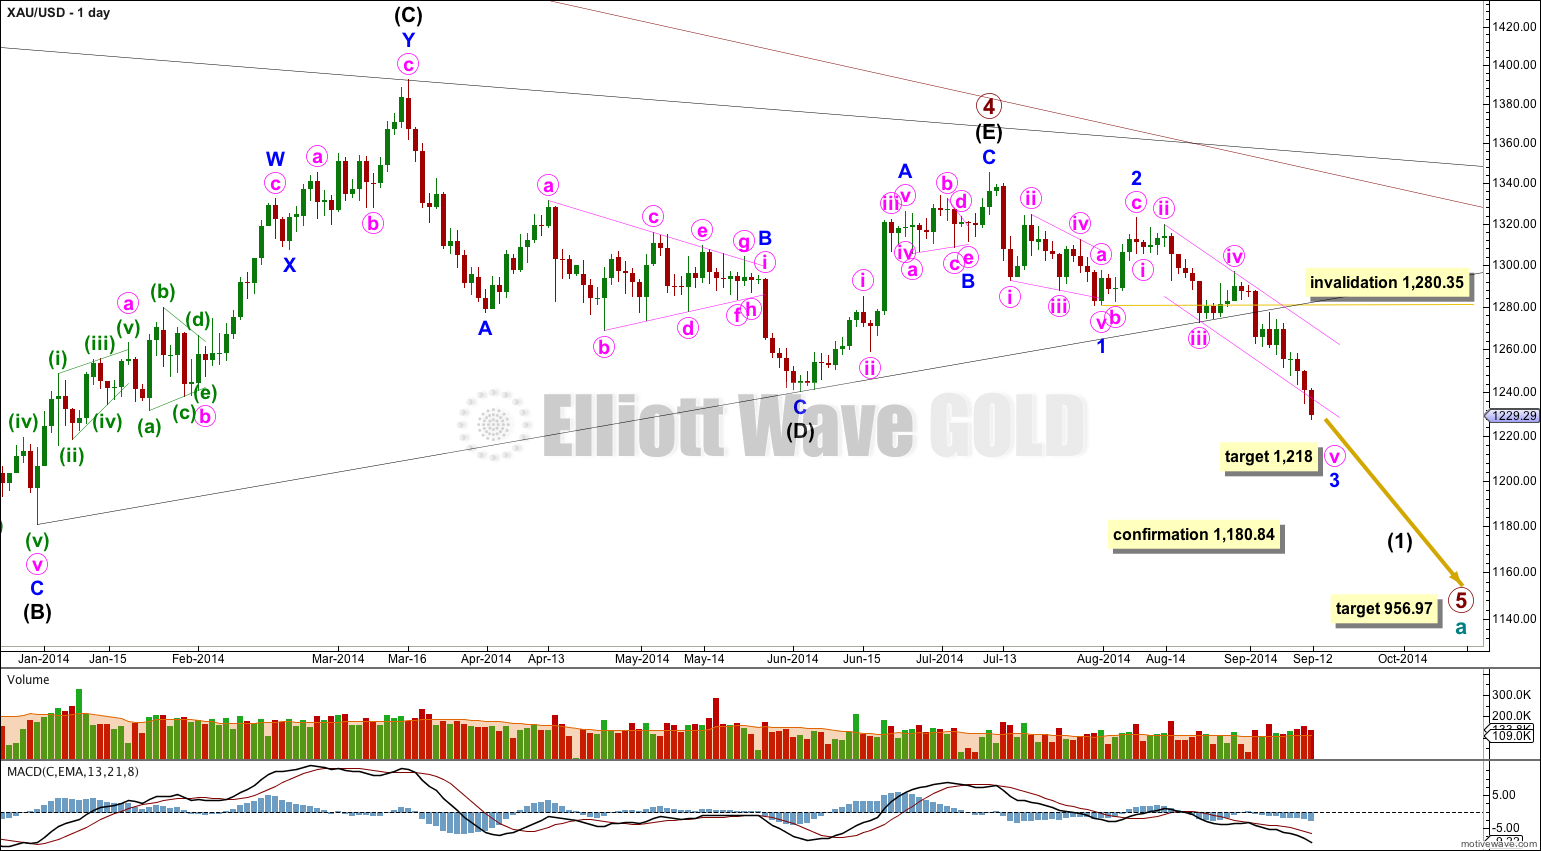
Draw a channel about minor wave 3 on the daily chart and copy it over carefully to the hourly chart: draw the first trend line from the highs labeled minute waves ii to iv, then place a parallel copy on the low labeled minute wave iii. Minute wave v has overshot the lower edge of this channel. Sometimes extended fifth waves behave like this for commodities.
At 1,218 minor wave 3 would reach 1.618 the length of minor wave 1.
Minor wave 3 is nearing its end. When it is done the subsequent upwards correction for minor wave 4 may not move back into minor wave 1 price territory above 1,280.35.
Movement comfortably below 1,180.84 would invalidate the new alternate below and provide further confidence in this main wave count.
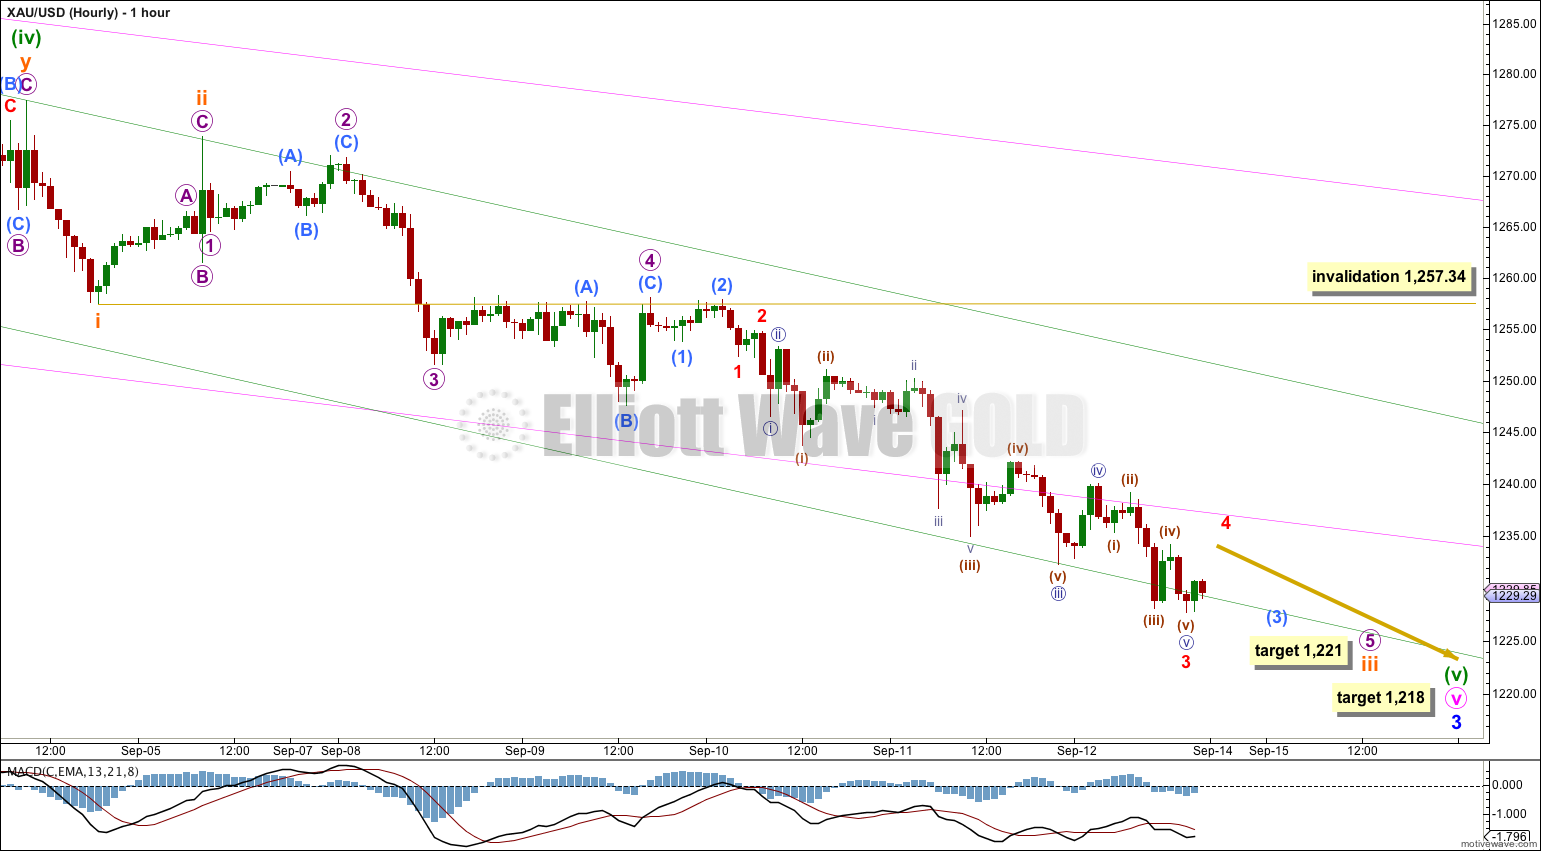
The structure requires more downwards movement to complete it. Along the way down to the end of subminuette wave iii I would expect to see two more small fourth wave corrections.
Each fourth wave correction may not move into its counterpart first wave price territory. So minuscule wave 4 may not move into minuscule wave 1 price territory above 1,252.30, and submicro wave (4) may not move into submicro wave (1) price territory above 1,253.74.
At 1,221 subminuette wave iii would reach 2.618 the length of subminuette wave i.
When subminuette wave iv finally arrives I would expect it to show up on the daily chart as at least one green candlestick or doji. Subminuette wave iv is most likely to be very choppy and overlapping; should be a sideways structure like a flat or triangle; is likely to be very shallow in relation to subminuette wave iii; and may not move into subminuette wave i price territory above 1,257.34.
When subminuette wave iv is over then one small final downwards wave for subminuette wave v is all that is needed to complete minor wave 3 in its entirety.
At 1,218 minor wave 3 would reach 1.618 the length of minor wave 1.
Draw the green channel about minute wave v on the daily chart using Elliott’s second technique: draw the first trend line from the highs of minuette waves (ii) to (iv), then place a parallel copy on the low of minuette wave (iii). Copy this green channel over to the hourly chart.
Micro wave 5 is really taking its time concluding. It may continue for another two or three days.
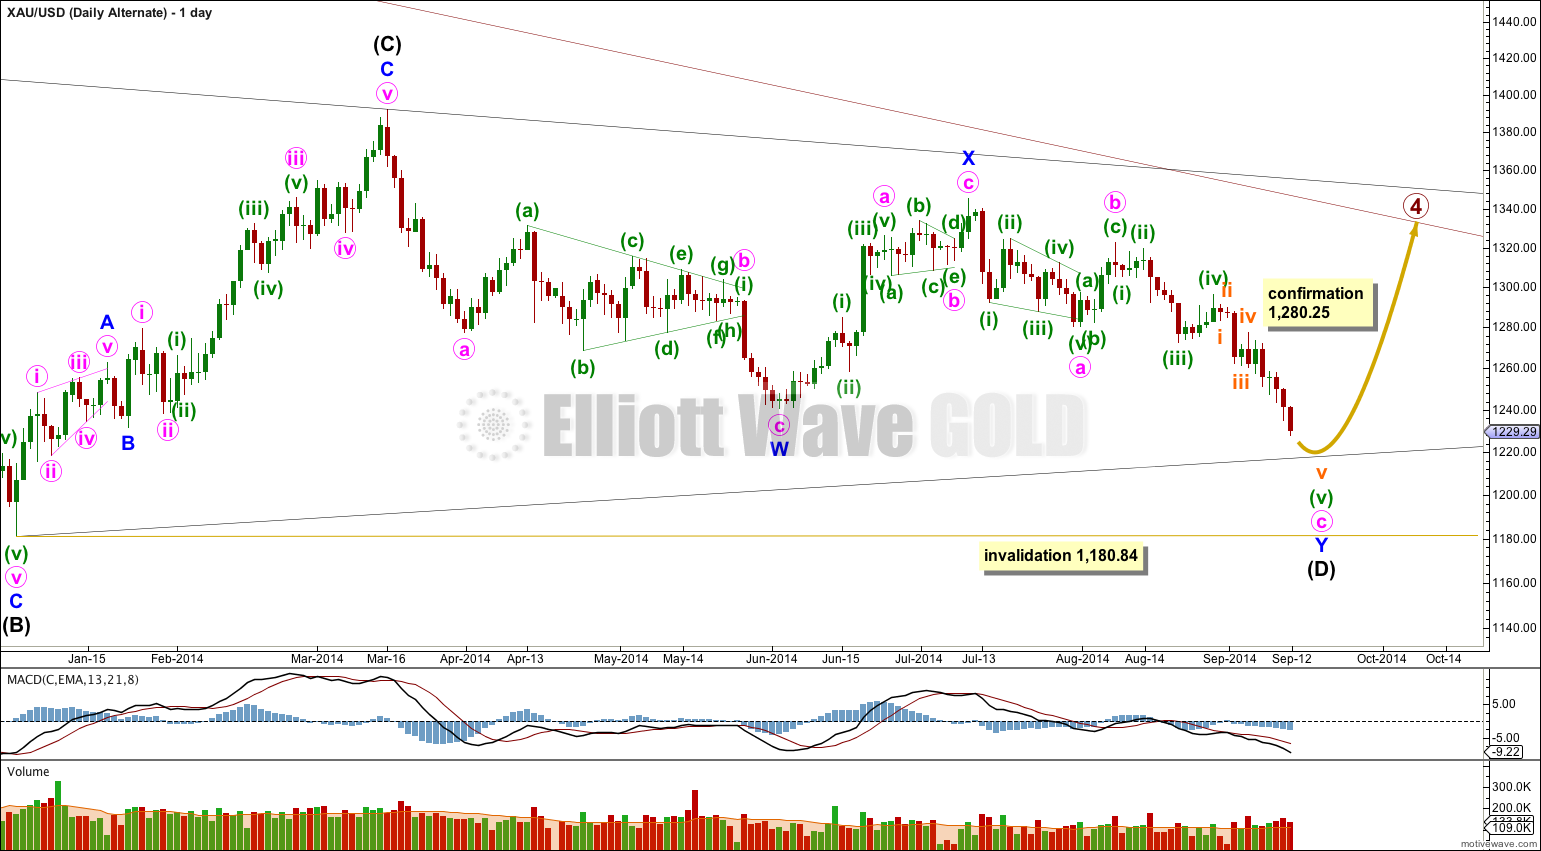
Alternate Wave Count.
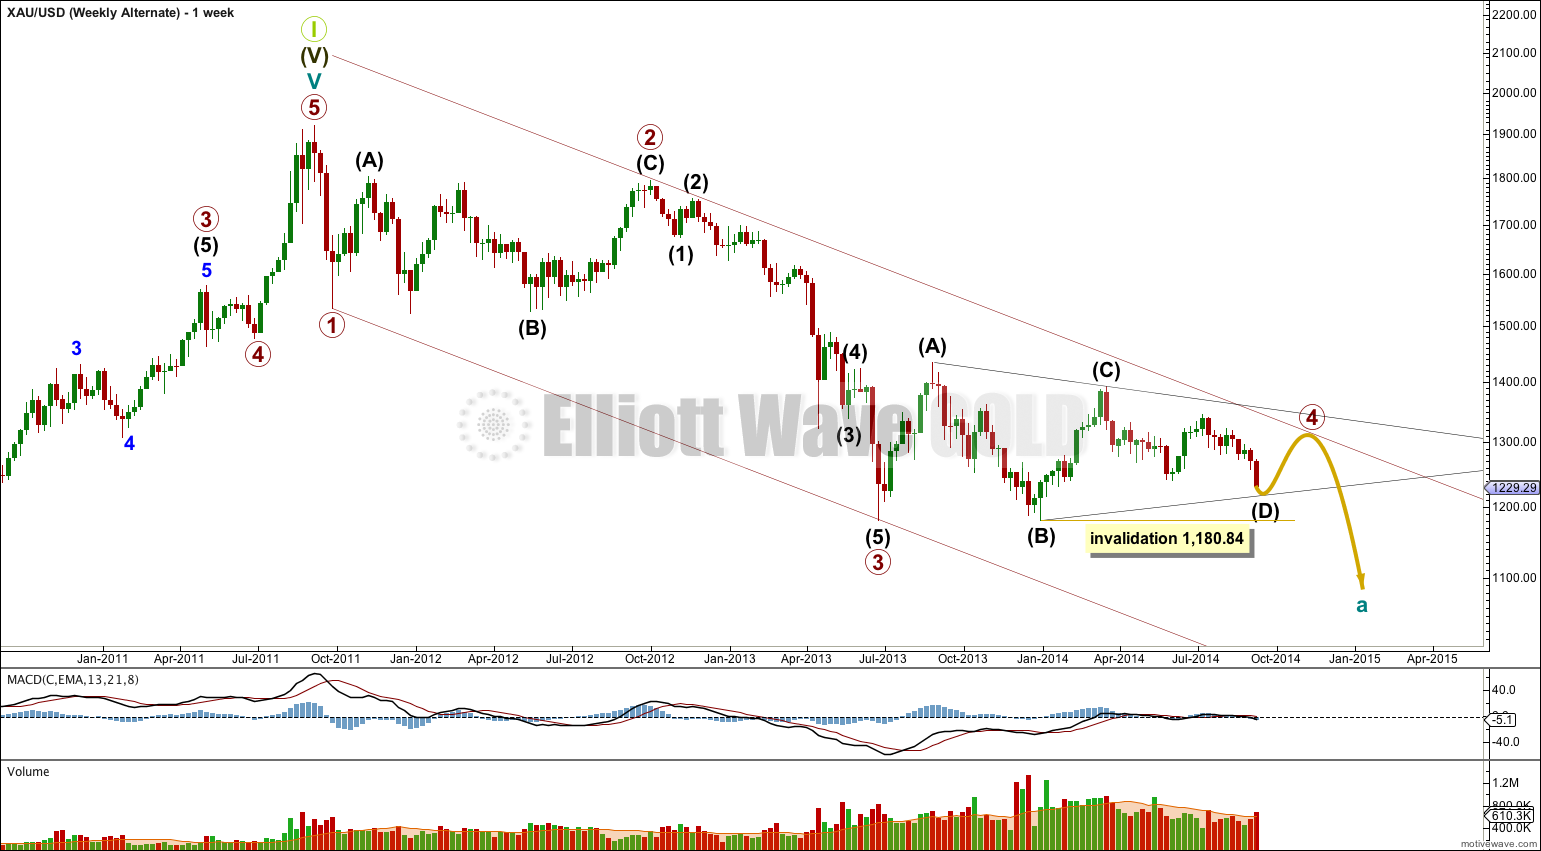
It has been suggested by a couple of members that intermediate wave (D) may be continuing. I have checked the subdivisions within the triangle and this is possible.
I would judge this wave count to have a very low probability only because of proportion between primary waves 2 and 4. The main wave count sees them almost exactly of the same duration, with primary wave 2 lasting 53 weeks and primary wave 4 lasting 54 weeks. This alternate would see primary wave 4 as much longer in duration than primary wave 2. It is the proportion between second and fourth waves within an impulse which gives the wave count what is called the “right look”. This alternate would still have the right look, but it would not look as good as the main wave count.
If intermediate wave (D) is continuing it can only be as a double zigzag. For a contracting triangle intermediate wave (D) may not move beyond the end of intermediate wave (B) below 1,180.84. For a barrier triangle intermediate wave (D) should end about the same level as intermediate wave (B), as long as the (B)-(D) trend line is essentially flat. In practice this means that intermediate wave (D) could end slightly below 1,180.84 and the wave count would remain valid. Unfortunately, this invalidation point is not black and white.
This alternate could see primary wave 4 end when price touches the upper edge of the maroon channel.
If intermediate wave (D) is a double zigzag, then intermediate wave (C) must be seen as a single zigzag because only one of the five subwaves of a triangle may be a double.
It is possible to see intermediate wave (C) as a zigzag, but to do so a rather obvious triangle must be ignored after the end of minor wave A. The main wave count sees a triangle in that position. I think this reduces the probability of this alternate.
Within intermediate wave (C) the subdivision within minuette wave (i) of minute wave iii of minor wave C is problematic. On the hourly chart this upwards wave subdivides as a double zigzag and does not fit well at all as a five wave structure. This is another reason why I would prefer a wave count which sees a triangle in that position because the subdivisions of those waves fit a triangle perfectly. This further reduces the probability of this alternate.
This alternate wave count does not diverge from the main wave count at this stage, and will not diverge for another one or two weeks. The main wave count expects downwards movement to complete minor wave 3 and this alternate expects downwards movement to complete minute wave c. Thereafter, the main wave count would expect upwards movement for minor wave 4 and this alternate wave count would expect upwards movement for intermediate wave (E). If at that stage price moves above 1,280.25 for that upwards movement then the main wave count would be invalidated and this alternate confirmed.
This analysis is published about 04:04 a.m. EST.
Exactly, the Fibonacci retracement will be along the length of minor wave 3.
Yes, I will have a probability for each Fibonacci ratio, and it will be shallow, because minor wave 2 was deep.
The most likely ratio would be 0.382, the next most likely 0.236 and finally 0.5 (although not a Fibonacci ratio).
So sorry, I am new to this. So when minor wave 3 ends around 1218, you will calculate Fibonacci retracement along the entire length of minor wave 3 from roughly around 1320? Is it possible to calculate an estimated probablity with each Fibonacci ratio, or to make and educated guess?
Thanks!
I cannot answer that question until subminuette wave iii is over, and it is not over yet.
Subminuette wave ii was very deep. So subminuette wave iv should be very shallow. When subminuette wave iii is over (when the structure is complete with two more fourth wave corrections and their following fifth waves down) then I will draw a Fibonacci retracement along the entire length of subminuette wave iii from 1,273.81 (the high labeled subminuette wave ii) to its end, and I would expect subminuette wave iv to reach up to the 0.236 or 0.382 Fibonacci ratio.
If the main wave count is correct and the price target of 1221 is correct, that is we bounce exactly at 1221 hypothetically, what price target range would you give for subminuette wave iv?
Thanks!