
While the US stock market was closed a very small red doji for Monday has not clarified the situation, but this sideways movement does fit the alternate hourly Elliott wave count better than the main hourly wave count.
Summary: The alternate hourly wave count has increased in probability. Both the main and alternate hourly wave counts have the same target at 1,346, but differ in the short term expectation. While price remains above 1,281.36 the main wave count will still be slightly preferred, and it expects the middle of a third wave up to begin. If price breaks below 1,281.36 I expect downwards movement to again touch the black (B)-(D) trend line on the daily chart before the third wave begins.
Click on charts to enlarge.
Main Wave Count
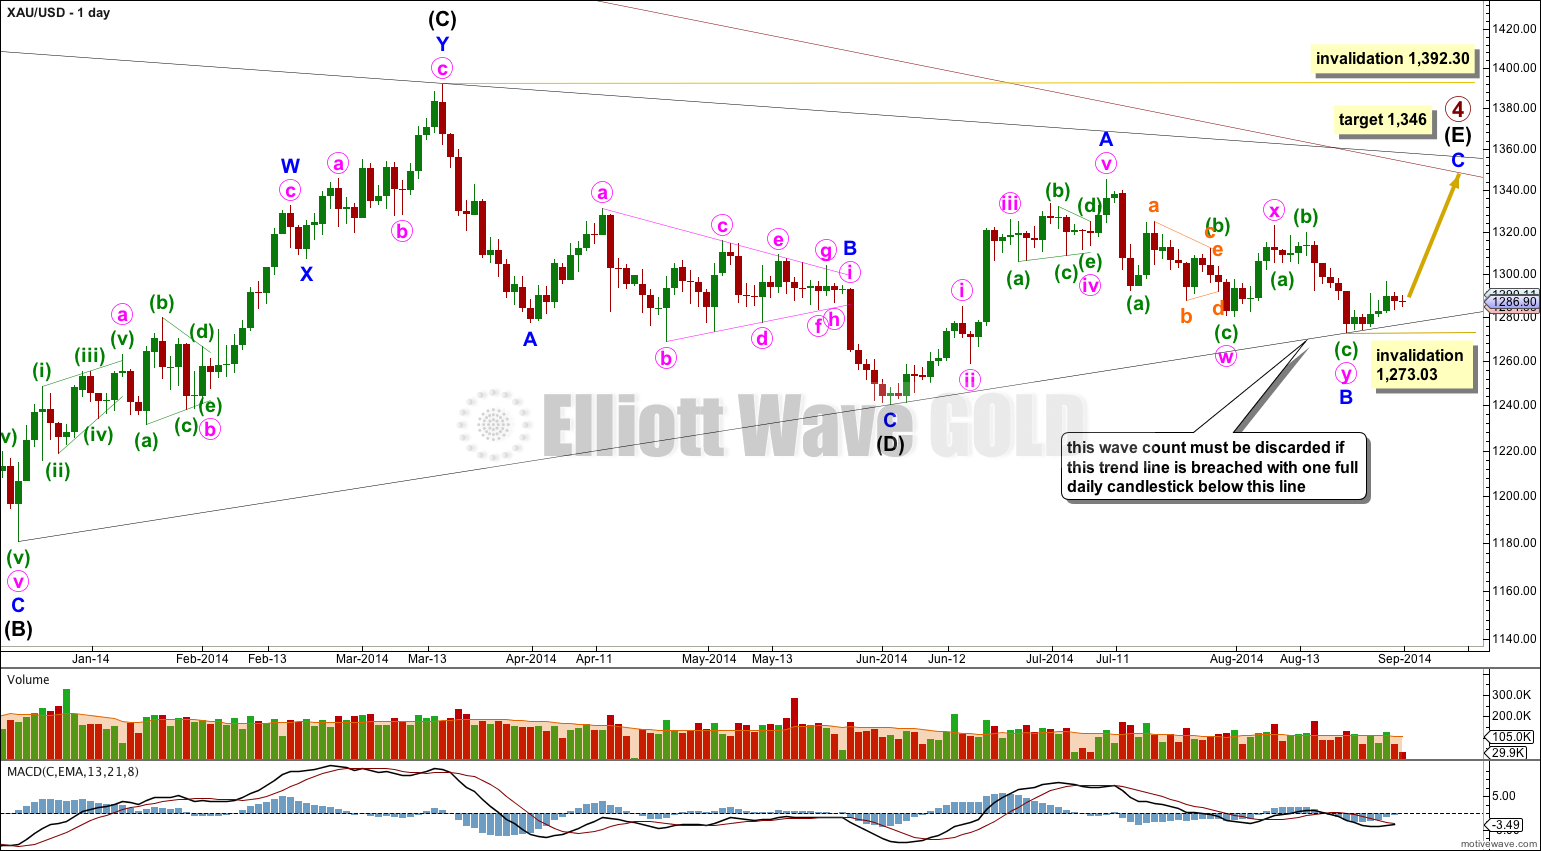
Primary wave 4 is an incomplete regular contracting triangle. Primary wave 2 was a deep 68% running flat correction. Primary wave 4 is showing alternation in depth and some alternation in structure.
Within the triangle of primary wave 4 intermediate wave (E) is unfolding as a zigzag: minor wave A is a five wave impulse and minor wave B downwards now fits as a completed double zigzag.
There are four nice examples of completed triangles on this daily chart. When triangles are complete the first movement out of them is most often quite swift and sharp. Importantly, this first movement does not hesitate at the B-D trend line and will plough straight through the trend line, which ceases to provide much if any support or resistance. It is significant that at this stage the (B)-(D) trend line is still providing strong support to downwards movement. This is one reason why I consider this main wave count to have a higher probability.
If minor wave C is to avoid a truncation it should move above the end of minor wave A at 1,345.22. At 1,346 it would do this, and may end when price comes to touch the upper edge of the maroon channel copied over here from the weekly chart. This may see minor wave C last a Fibonacci 13 days in total. Please note, this time expectation is a rough guideline only. Gold does sometimes exhibit Fibonacci durations, but not often enough to be relied upon.
The four examples of completed triangles here on the daily chart also show that the final subwave of a triangle most often ends comfortably short of the A-C trend line. The target at 1,346 would see this happen for primary wave 4.
Intermediate wave (E) may not move beyond the end of intermediate wave (C) above 1,392.30.
Within minor wave C no second wave correction may move beyond the start of its first wave below 1,273.03.
Hourly Wave Count – Main
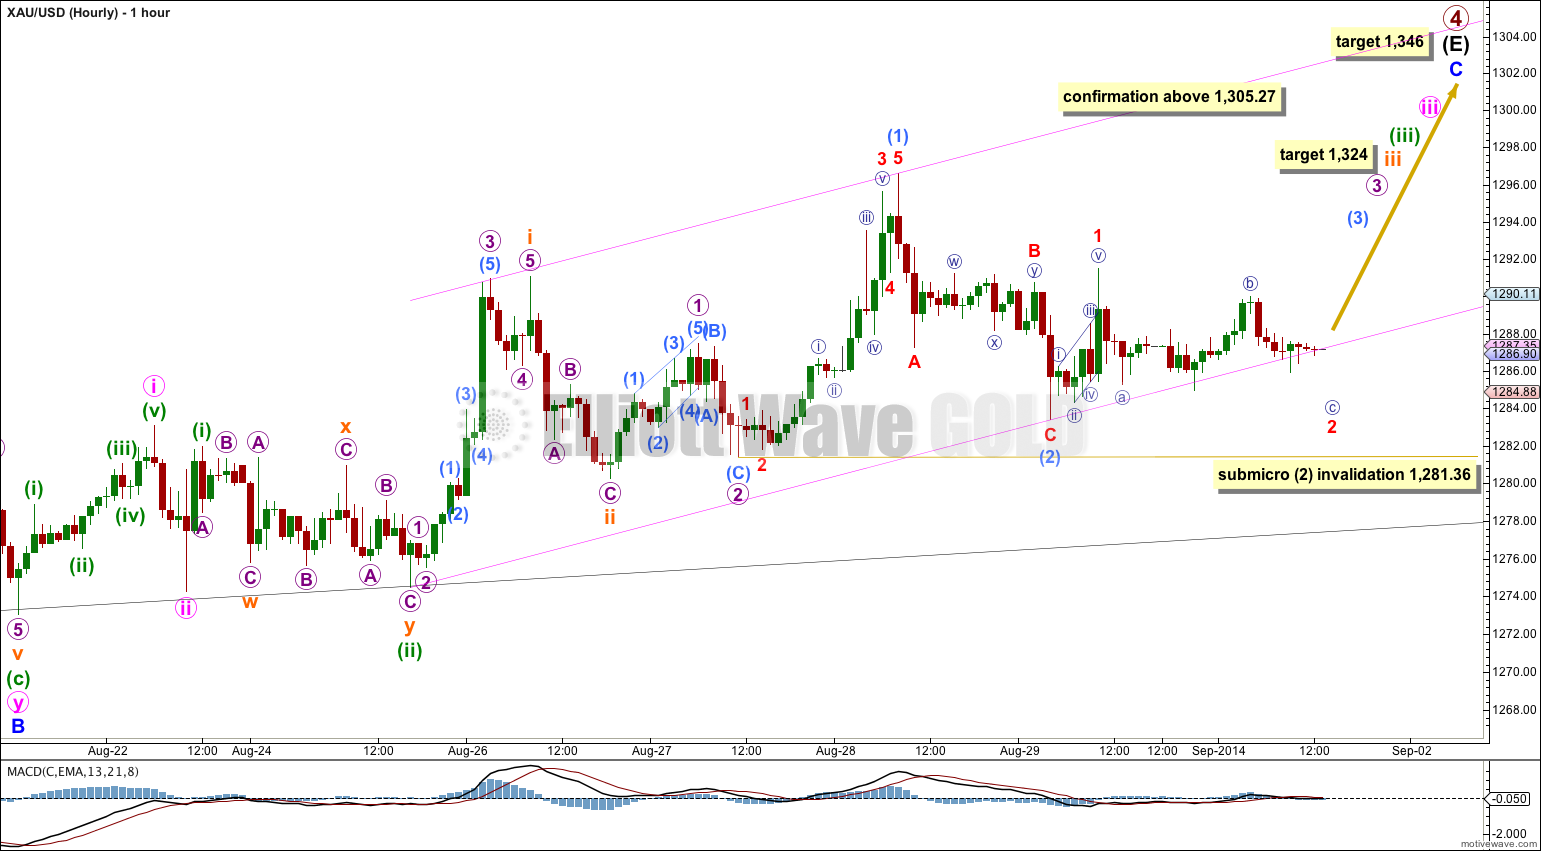
This wave count no longer has the best fit in terms of subdivisions; current sideways movement looks like a triangle which does not fit this main wave count because a triangle may not be the sole corrective structure for a second wave. However, this wave count still looks at the most common situation, an extending third wave, unfolding.
When third waves extend they necessarily begin with a series of overlapping first and second waves. This can sometimes put us off and may make us think that the third wave will not appear, and it can do that right before the third wave begins to move extremely strongly. Although momentum for submicro wave (1) has still not increased beyond that seen for subminuette wave i, I would not expect to see the strongest momentum until the middle of the third wave arrives, which is not here yet.
I have redrawn a best fit channel about this upwards movement. Another breach of the lower edge of this channel would again slightly reduce the probability of this wave count, and it requires a breach.
At 1,324 subminuette wave iii would reach 2.618 the length of subminuette wave i. This target may still be about three days away.
Submicro wave (2) may not move beyond the start of submicro wave (1) below 1,281.36.
Hourly Wave Count – First Alternate
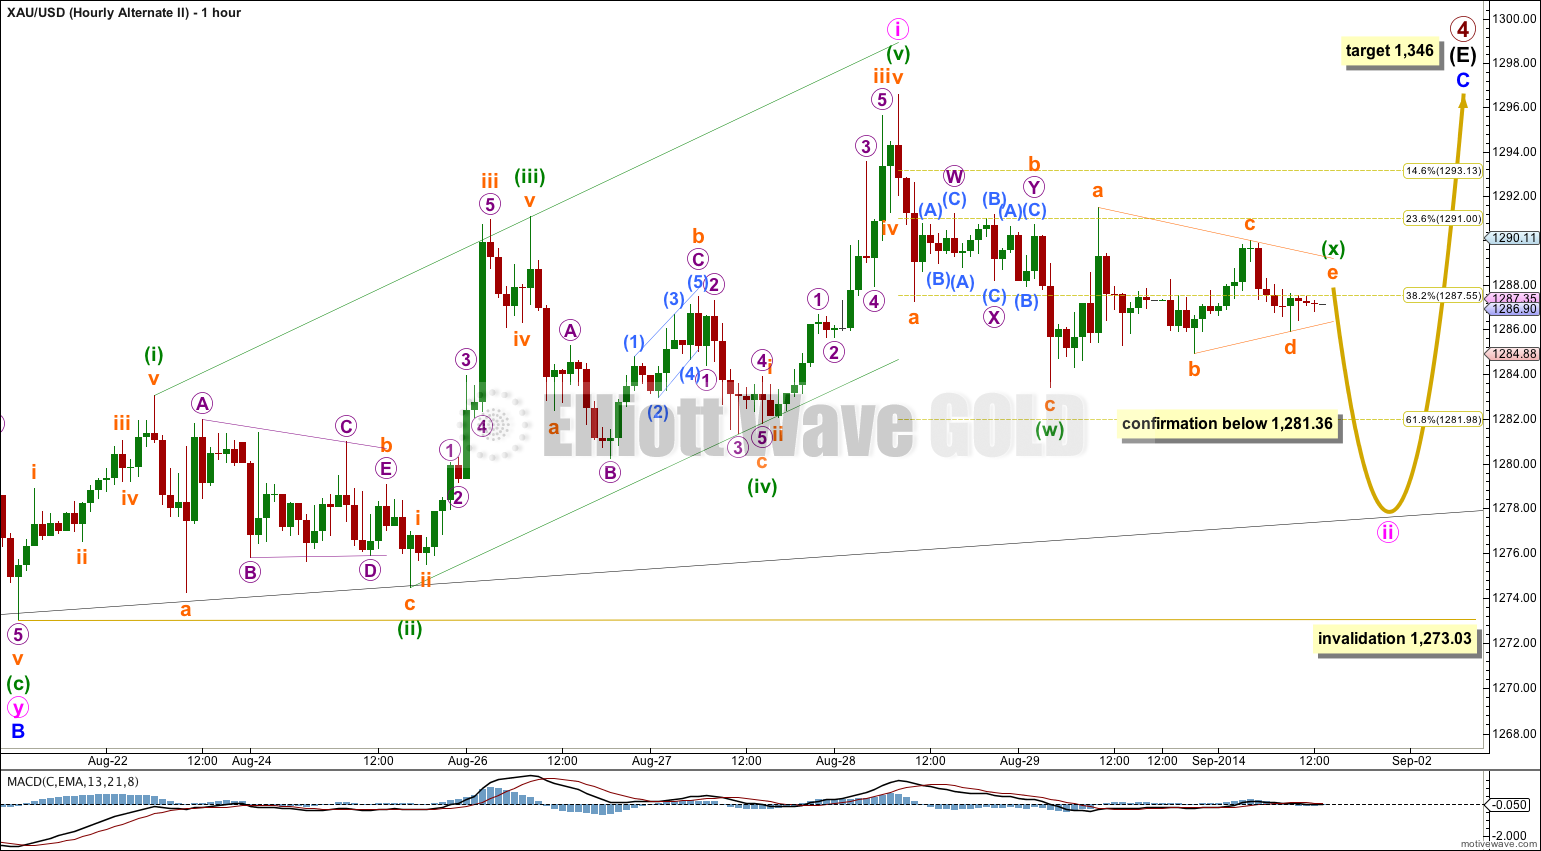
Minute wave i may have completed as a leading expanding diagonal, but this wave count has a few problems.
Within minuette wave (ii) subminuette wave b is an atypical looking barrier triangle because the A-C trend line does not have a clear enough slope.
Within subminuette wave b of minuette wave (iv) micro wave B must be seen as a three wave zigzag. On the five minute chart this movement subdivides better as a five wave impulse, which is what the main wave count sees it as. This further reduces the probability of this alternate.
Minuette wave (iv) did not move lower, and micro wave 5 within subminuette wave c is truncated. This further reduces the probability of this alternate.
Minuette wave (iv) is less than the common length of 0.66 to 0.81 the length of minuette wave (iii), at just 0.56. This also slightly reduces the probability of this alternate.
The biggest problem with this alternate still is the diagonal trend lines. They should clearly diverge for an expanding diagonal. The fact that they do not, they look closer to parallel, gives this structure overall an atypical look. This wave count looks forced.
If price moves below 1,281.36 this would be my preferred wave count, and at that stage I would expect it to be highly likely that price would move as low as the black (B)-(D) trend line on the daily chart.
Minute wave ii would most likely move deeper, and may be unfolding as a double zigzag to do so. I would expect it to touch the (B)-(D) trend line. Within the double zigzag minuette wave (x) looks like a typical regular contracting triangle which is close to completion. The final wave of subminuette wave e would most likely fall short of the A-C trend line, and when the triangle is done price should break out downwards for a short sharp wave to touch the black (B)-(D) trend line. That would complete a double zigzag for minute wave ii.
When first waves subdivide as diagonals they are commonly followed by very deep second wave corrections. Diagonals in first wave positions are not exactly rare, but they are not common either. Leading diagonals are almost always contracting, and the expanding variety is uncommon. These points reduce the probability of this wave count. Today I would judge it to have only about a 10-15% probability.
Hourly Wave Count – Second Alternate
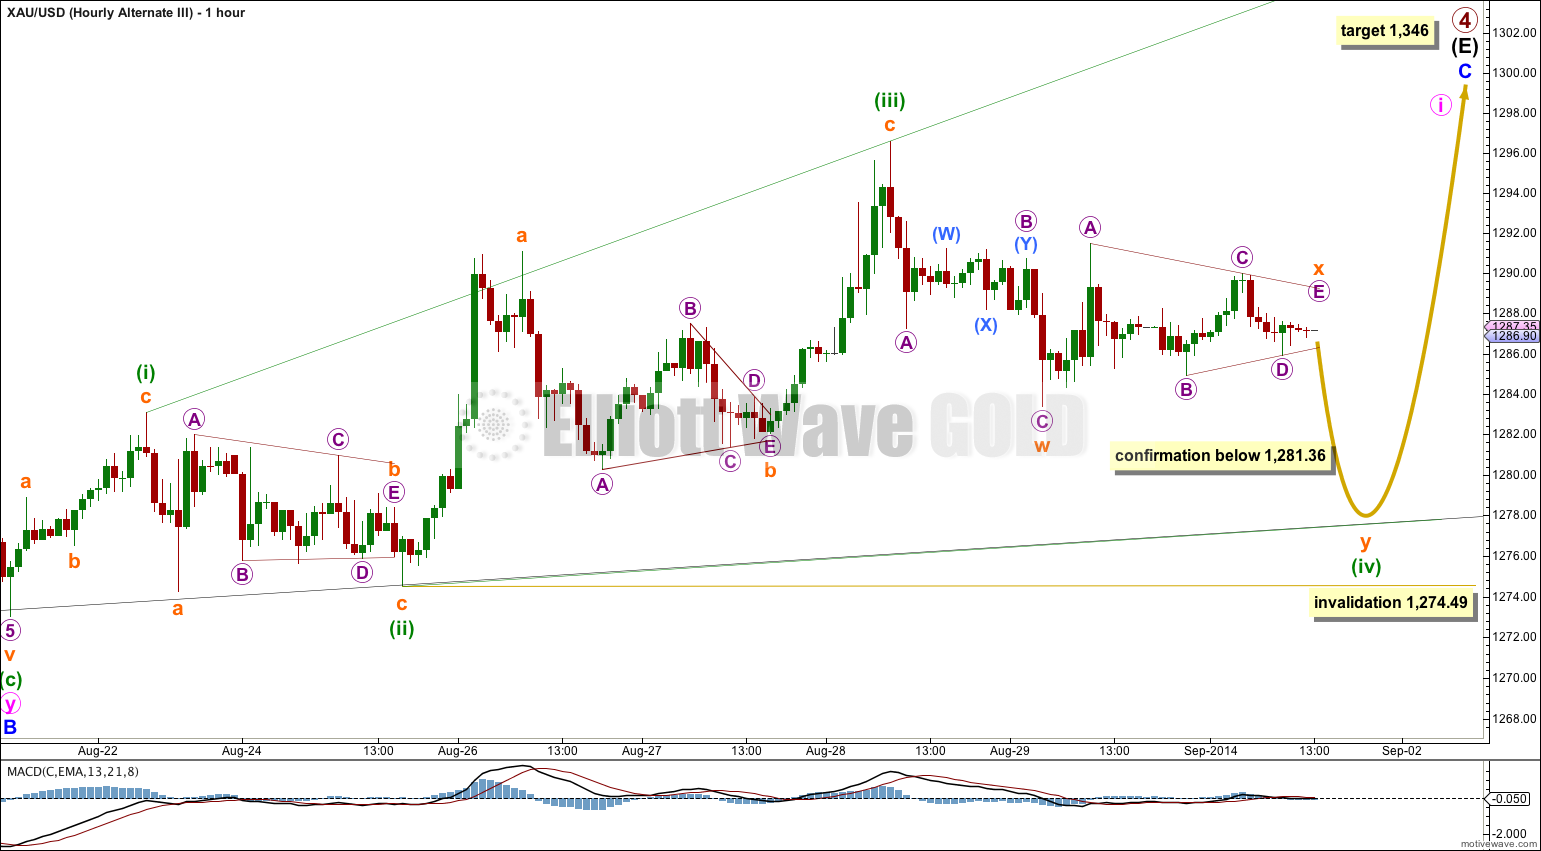
I have tried to find a better fit than the first two hourly wave counts, and an explanation for all this sideways movement. Joe Taverna from Elliott Trader has suggested to me that diagonal subwaves may subdivide as multiple zigzags, because multiple zigzags may take the place of single zigzags. He tells me he has seen diagonal subwaves do this, and as I respect his ability as an Elliotician I am willing to consider this possibility.
What if the leading diagonal is not complete and this downwards movement is a double zigzag for minuette wave (iv) of the diagonal? This may bring price back down to the (B)-(D) trend line.
The subdivisions for this idea mostly fit okay, but the triangle for subminuette wave b within minuette wave (ii) still looks wrong though.
Minuette wave (iv) may not move beyond the end of minuette wave (ii) below 1,274.49.
This wave count would expect a breakout from this sideways movement to the downside for one short sharp movement. Minuette wave (v) to follow that upwards must make a new high beyond the end of minuette wave (iii) at 1,296.60 because the fifth wave of a leading diagonal may not be truncated. That would complete a leading expanding diagonal for minute wave i, and should be followed by a very deep second wave correction again maybe back down to the (B)-(D) trend line.
Second Alternate Daily Wave Count
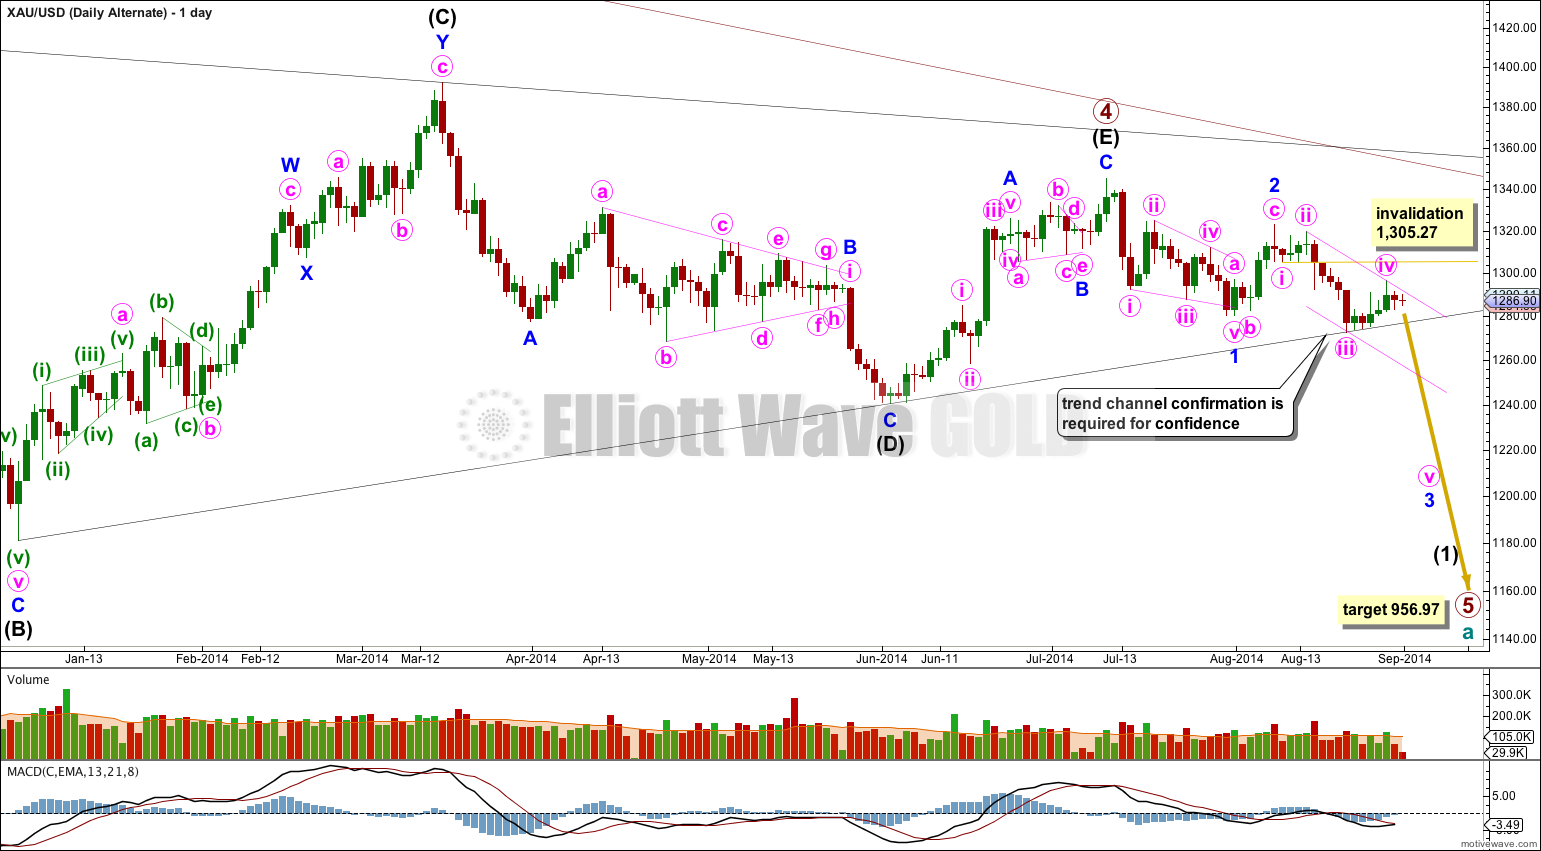
It is possible that primary wave 4 is over at the high of 1,345.22. This wave count still requires confirmation with a clear breach of the (B)-(D) trend line on this daily chart.
If primary wave 4 is over then primary wave 5 downwards would reach equality in length with primary wave 1 at 956.97. Primary wave 1 was a remarkably brief 3 weeks duration. I would expect primary wave 5 to last some months, and is already longer than one month.
The only structure which fits for minor wave 1 is a leading contracting diagonal. While leading diagonals are not rare, they are not very common either. This slightly reduces the probability of this wave count.
Within diagonals the second and fourth waves are commonly between 0.66 to 0.81 the prior wave. Here minute wave ii is 0.61 the length of minute wave i, just a little shorter than the common length, slightly reducing the probability of this wave count. Minute wave iv is 0.66 the length of minute wave iii, just within the common length.
Leading diagonals in first wave positions are normally followed by very deep second wave corrections. Minor wave 2 is deep at 65% the length of minor wave 1, but this is not “very” deep. This again very slightly reduces the probability of this wave count.
The biggest problem I have with this wave count and the main reason for it still being an alternate is the leading diagonal following the end of the triangle for primary wave 4. When triangles end the first piece of movement out of the triangle is almost always very strong and swift. Diagonals are not strong and swift movements. To see a first wave out of a triangle subdividing as a diagonal is highly unusual and does not at all fit with typical behaviour.
Also, price found strong support at the (B)-(D) trend line, which should have ceased to provide any support or resistance if the triangle was over. This is unusual and further reduces the probability of this alternate wave count. At this stage I would judge this alternate to have only about a 5% probability. I expect it to be invalidated within the next 48 hours.
Within minor wave 3 minute wave iv may not move into minute wave i price territory above 1,305.27.
A clear breach of the lower (B)-(D) trend line of the primary wave 4 triangle would provide full and final confirmation of this alternate. A full daily candlestick below that trend line would provide me with 100% confidence in this wave count.
Draw a channel about minor wave 3 here on the daily chart using Elliott’s first technique and copy it over to the hourly chart: draw the first trend line from the lows labeled minute waves i to iii, then place a parallel copy on the high labeled minute wave ii.
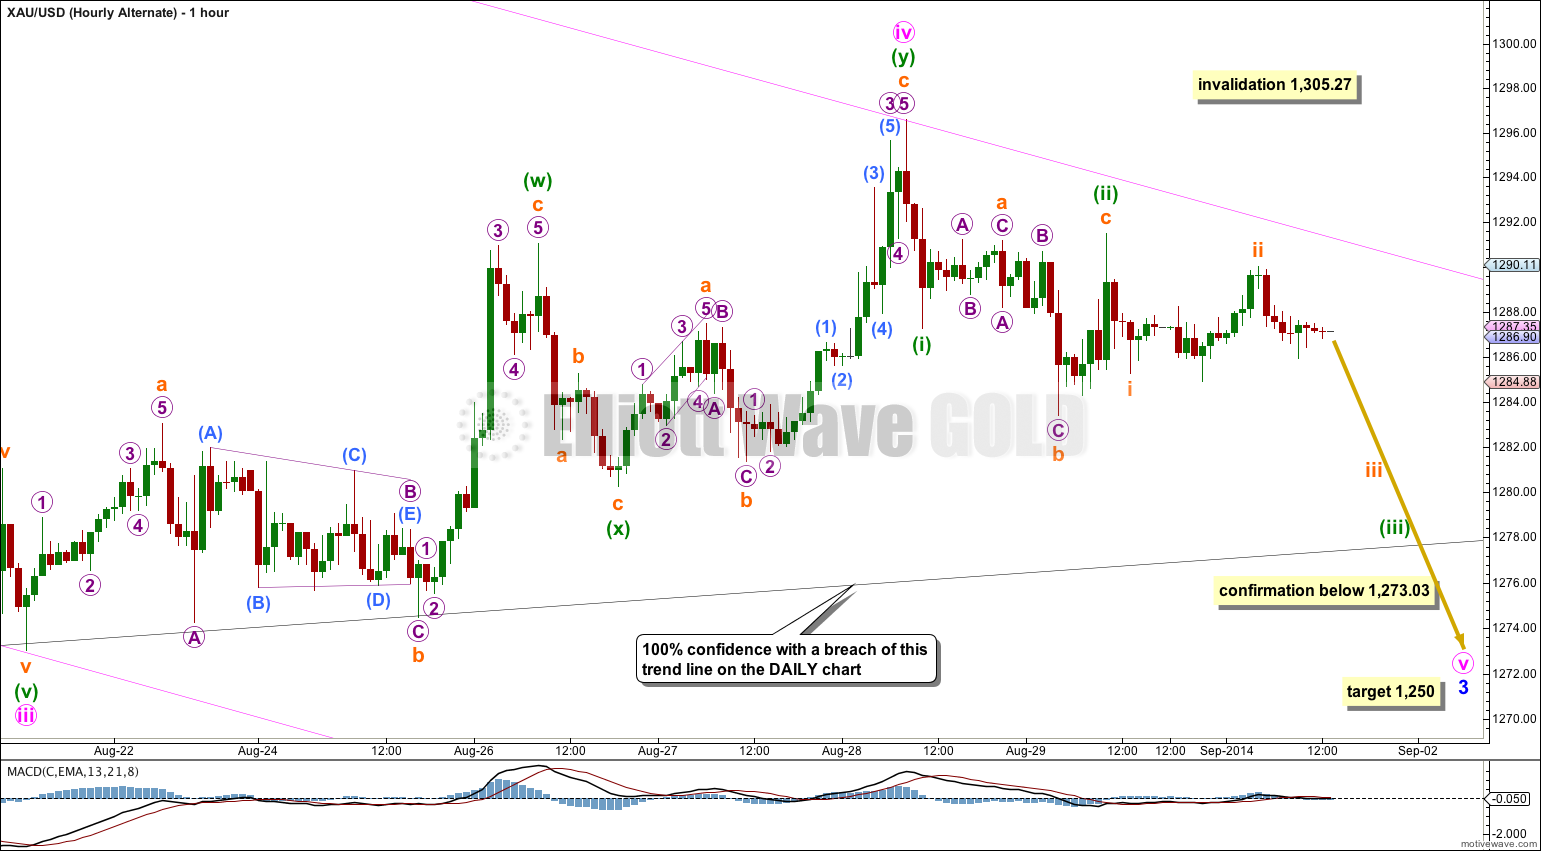
Minute wave ii was a deep combination and minute wave iv is also now a deep correction as a double zigzag. The deepening of this correction further reduces the probability of this alternate today.
At 1,250 minute wave v would reach equality in length with minute wave iii. Both minute waves iii and v would be extended.
This wave count requires confirmation initially with a new low below 1,273.03. Thereafter, I would wait for one full daily candlestick below the black (B)-(D) trend line on the daily chart before I would have full confidence in the idea that primary wave 5 has begun.
I would only take this wave count seriously with some confirmation.
This analysis is published about 05:48 p.m. EST.
If we have one more day with a full candlestick below that black (B)-(D) trend line, then thats it for that old main wave count. At this point in time, it looks really unlikely.
Hi, sorry, I know I said I’d do it yesterday.
I will definitely get Silver and GDX done today, Oil tomorrow or the day after.
Hi everybody , It looks bad but Lara’s blue ABC is still intact , unless the level of black (D) , say 1240 , is broken . May I suggest this , using her first chart , a Daily . From Lara’s blue A down , the orange Triangle can be counted 12345 , an “a” . Today’s fall is also in 5 waves down . , a “c” ., to reach blue B , as long as 1240 is not broken . So there is still a blue C rally to expect , as in Lara’s chart . Blue B can be lower , the lower TL of the Triangle can be redrawn , only if 1240 is not broken , for that will destroy the Triangle geometry . I am also learning EW , becos it can give “predictive” insight and very descriptive . Lara is very good in her work , and has very good insight and judgement , which is required no matter how objective others can claim for EW .. She has been correct on Gold almost all the time , an impossible feat . I’m ready to bail out of the Gold Miners , looking for a bounce should the final C wave fails to take off , but I will still trust Lara’s judgement a lot and rely on inputs of her analysis . IF gold proves to move inversely to the USD , then there is a good chance the USD will pull back any time , it has reached the fifth count , tho it keeps subdividing/extending . . Russia maybe invading the Ukraine . Thank you , Raymond
Just to clarify, I said Lara was an amazing elliottician and I will continue to be a member. Her info is invaluable. I didn’t mean any harsh criticism toward her or anyone. My only point was the members were being swayed to be long by an EW count. However, gold never closed above 200dma even when it traded above it intraday. This was a big clue in my eyes and for this reason I was never long.
I am glad you weren’t long Chapstick, but I don’t see the logic of using the 200 DMA unless the market is in an unbroken trend and you want to enter on pullbacks. The market moved above and below the 200 DMA repeatedly since February this year (the EMA and even more so the SMA). It could equally have moved back above it. That is quite typical in consolidations. If someone waits until the market moves across a moving average, he usually misses a good proportion of the move. Case in point: mid June this year, but also any time between July 2013 and mid Feb 2014, anyone would have missed out on some huge rallies. It was entirely plausible that we were due for another decent rally up to the top of the triangle.
I believe that the rigorous analysis that Lara provides is really really good – even if the primary and alternate counts resolve themselves differently. The meaning of probabilities assigned to the counts should be correctly understood. When something has a probability of 60% vs 40%, it does not mean that if the outcome with 60% probability did not come true that it implies that the analysis is wrong. It merely means that an outcome with a lower probability happened. It is like when you roll a dice, the probability of getting any one of the six outcomes is one-sixth (16.667%, since each outcome is equally likely). However, after the dice is rolled, the outcome you eventually get was only 16.67% before the dice was rolled, and yet it happened. I guess what I am trying to point out is to not get so fixated with the probability of main and alternate counts. Lara’s analysis, where it is truly indispensable is that she presents a very very through, well researched picture of what the wave counts can be – and it is up to me to assess what to make of those counts. It is of great benefit to me at the end of the day to look at her wave counts and quickly understand what is going on and I am free to make my own inferences from it, without having the luxury of spending time on figuring out all the possible wave counts. No one else I know has such a thorough daily analysis on gold (EW or regular TA). Neither EW of regular TA promises to “predict” the future with 100% accuracy. Both EW and regular TA are “models” that can be used to understand what is going on – nothing more.
.. Sorry if I am repeating myself, but I just thought I should say this given the reactions being expressed about the main/alternate counts in the comments section. Thank you, Lara!
Hi Lara,
would it be possible to get an update on Silver and Oil please.
Thank you very much.
Kindly
Ursula
Well… so much for B-D trendline. We are breaking down badly this morning!
Has the 5th wave down started?? It looks like we are in it.
Is it decisevly broken? The day isn’t over yet, I don’t mean to be a jerk but to the people telling her how to conduct her business … Why are u even here? Lol let me shut up
We are here because we are not experts in Elliott Wave! We are not telling her what to do, we are suggesting improvements. There’s a big difference and it is a free country. I could ask, why is there even a comments page? And yes, it is broken down. Big time.
I hear ya Steve… I don’t need any urgent clarification (thank god :)) but I take it that if it was to close the day above the trend line she still might lean towards the main count???
Of course, I can’t speak for Lara, but this is my take on it:
If it closed on the line, it would still favour the alternate. The low so far was about 13 points below that line (actual price levels will differ according to the data provider).
A clear rejection of the breakdown would favour the main count with a close near or above the previous day’s close, but that’s at least 25 points above today’s current low…. very unlikely IMHO.
Anything between the two would be much more ambiguous but would probably still favour the alternate, conditional on what happens in the next few days.
Intraday, triangles go all over the place but they are much more reliable when they are trend continuations like this one.
thumb up
Yep. Agreed.
I’m working on an alternate… but with price so far below that trend line it looks like the breakout has been down.
Thanks for your input Steve, I am always hoping to see members share and help each other when I’m not around. That usually happens when I’m sleeping (I’m GMT +13 hrs).
That’s okay, I’m not taking any comments here as anyone telling me what to do, I’m taking it as constructive feedback and just… questions. Yes, its decisively broken. Yes we’re most likely in a downtrend. No, I don’t have 100% confidence in that statement… yet. I will have if the next daily candlestick is below that black (B)-(D) trend line.
I’m really pleased to see members using the comments sections to communicate with each other. The idea is you can all help each other out, you all understand EW, and there are a few highly experienced CMT members here with a wealth of knowledge to share.
Lara, I’m going to say it again since you never commented on it before but it sure looks like the main daily wave count has run out of time. I wanted it to kiss the upper weekly trendline from 2011 one last time above $1350-$1360, but time has run out unless there is a truncation. We should have an answer on Sept 4th when the ECB speaks. I do believe your alternate counts have panned out more than your main counts of late. You are an amazing elliottician and there’s only one criticism I hope you take seriously for future analysis of S&P 500 and gold. I think it would be extremely beneficial to supplement your analysis with classic TA. You are a CMT level 1 which is great, but it’s never mentioned in your analysis other than MACD divergences. For example, I’m not sure how anyone can be bullish on gold until it closes above the 200dma. I know you want so badly to have the last and final wave up so it has the right look, but most times that last and final wave never happens in any market or the final kiss of a trendline. By the way, you’ve done a great job identifying where you would get bearish on gold.
I’m not seeing it, running out of time that is. It can still get up there if it has a nice strong third wave. Or maybe it will be slightly truncated.
I’m only CMT I, and I’ve not been reading for CMT for long. I quite simply do not have the confidence in my more traditional TA skills to use them publicly.
I am using trend lines differently, I know its a small thing but in the whole field of TA I think trend lines are one of the absolute best ways to confirm trend changes and show support and resistance.
I’m really not that hot on using oscillators and indicators, and when you ask me to use more traditional TA in my analysis I’m assuming that’s most likely what you mean. I’m fine with much of the stuff I’ve learned so far but oscillators and indicators is my weakest area. I’m not going to use that publicly until I’m confident I’m not going to get it wrong.
Either way it looks like we have the answer before sept 4th…which is the count I suspected was correct all along
Yes, indeed we do!
Thats the problem with probability. I can look at all the clues to try and judge the probability of a wave count, and every time a banana the low probability wave count will surprise us when it turns out to be correct. Because… it had a low probability! That doesn’t mean it can’t happen.
Just one more day…. if the next daily candlestick remains below that black (B)-(D) trend line then I’ll have 100% confidence Gold is in a multi week to multi month downwards trend.
Chapstick, I doubt that TA will help. Now that the triangle has been decisively broken, the alternate wave count has been confirmed. But I do not believe that Lara would have known to call the alternate the main count and vice versa (at least in this instance) even if she did use TA. That is why it is valid to have both a main count and an alternate count. Perhaps it is better to just consider both to be equally possible. But that doesn’t negate the exercise with Elliott Wave (or the value of Lara’s current method), as you have identified here (as you got a good entry by following the alternate count).
Personally, I gave up using technical analysis a long time ago, because I believe it is as much if not even more open to interpretation than Elliott Wave as a predictor of future price action. My view is that the market can do almost anything,.. it just follows an ordered path along the way. Technical analysis is prone to error because what happened in the past doesn’t always repeat in the future (and 50% of the time it does exactly the opposite). We could equally have had a move up to the top of the triangle as we could have had a breakdown from it and this picture wasn’t clear until it actually broke down (even though momentum was slowing).
Sometimes it does help to look at momentum, I agree. For example, I had a much stronger sense that it was going lower before the breakdown of June 2013, largely because of slowing momentum. It was much less clear in this instance. But who knows, maybe even in June 2013 it would have been equally plausible to have seen a “higher double bottom” form just after the break of the lower triangle on the week of the Fed announcement? I am sure there were plenty who thought so at the time, which is why the market broke down so hard, through so many stops.
Whether you side with the main or the alternate, it is down to your gut feel (technical analysis, intuitive sense, grasp of the big picture, fundamental interpretation or whatever you might call it) about which side you take. But at the end of the day, it is often luck, fate or divine intervention rather than preparation, analysis and intelligence which help you chose the right direction. That’s why it is so difficult to make money in trading and such a blessing when we do. Choosing the right entry and exit points, though, is a different matter: a matter of skill, preparation and discipline.
I have long been putting the case that it is important to have both a bullish and a bearish case presented and that is what Lara has for the most part been doing (though less explicitly than she has done with ElliottWave StockMarket) and that I believe is what she should continue to do. If she has an opinion about which side is more probable from her experience, then that is helpful, but we shouldn’t expect to regard it as more than an informed opinion. On the other hand, her analysis about which price levels the market might reach in either instance are invaluable. That, I think is the real value of Elliott Wave.
Lara, on a final note, my recommendation / request is that you adopt a dual stance more formally, where you present the bullish and bearish case each time (though still presenting your views of the probabilities and providing any alternates hourly counts which may arise under each heading).
Just a quick word to anyone who missed this move: don’t worry, there will be another opportunity to take a trade in the next few days. The best thing to do is sit tight and wait for the right set-up.
I happen to think that Lara’s use of MACD is really great. Rather than delving into standard technical analysis, she is really wise in using only few tools that effectively aid in her Elliott wave reading.
Lara is doing a great job in rigorous application of classical Elliott wave formalism. If she departs from that rigorous approach and starts introducing other technical analysis ideas willy nilly, her predictions may actually get worse not better.
In my opinion, Elliott waves is so difficult and so open to misinterpretation, it is hard enough doing it alone.
One thing I observed. When Lara’s short term Elliott wave reading becomes overly complex and even convoluted, the bigger picture may be wrong.
I believe that is what happened this time. Her main count was not working out well. And it may be happening that her ‘5% chance’ scenario ( daily alternative ) is the correct one.