
Summary: This correction is still incomplete. An adjustment to the hourly charts for recent movement sees all three possibilities of a flat, triangle and combination still open. I expect Gold to continue to be range bound until Thursday. The breakout when it comes should be downwards.
Click on charts to enlarge.
Main Wave Count
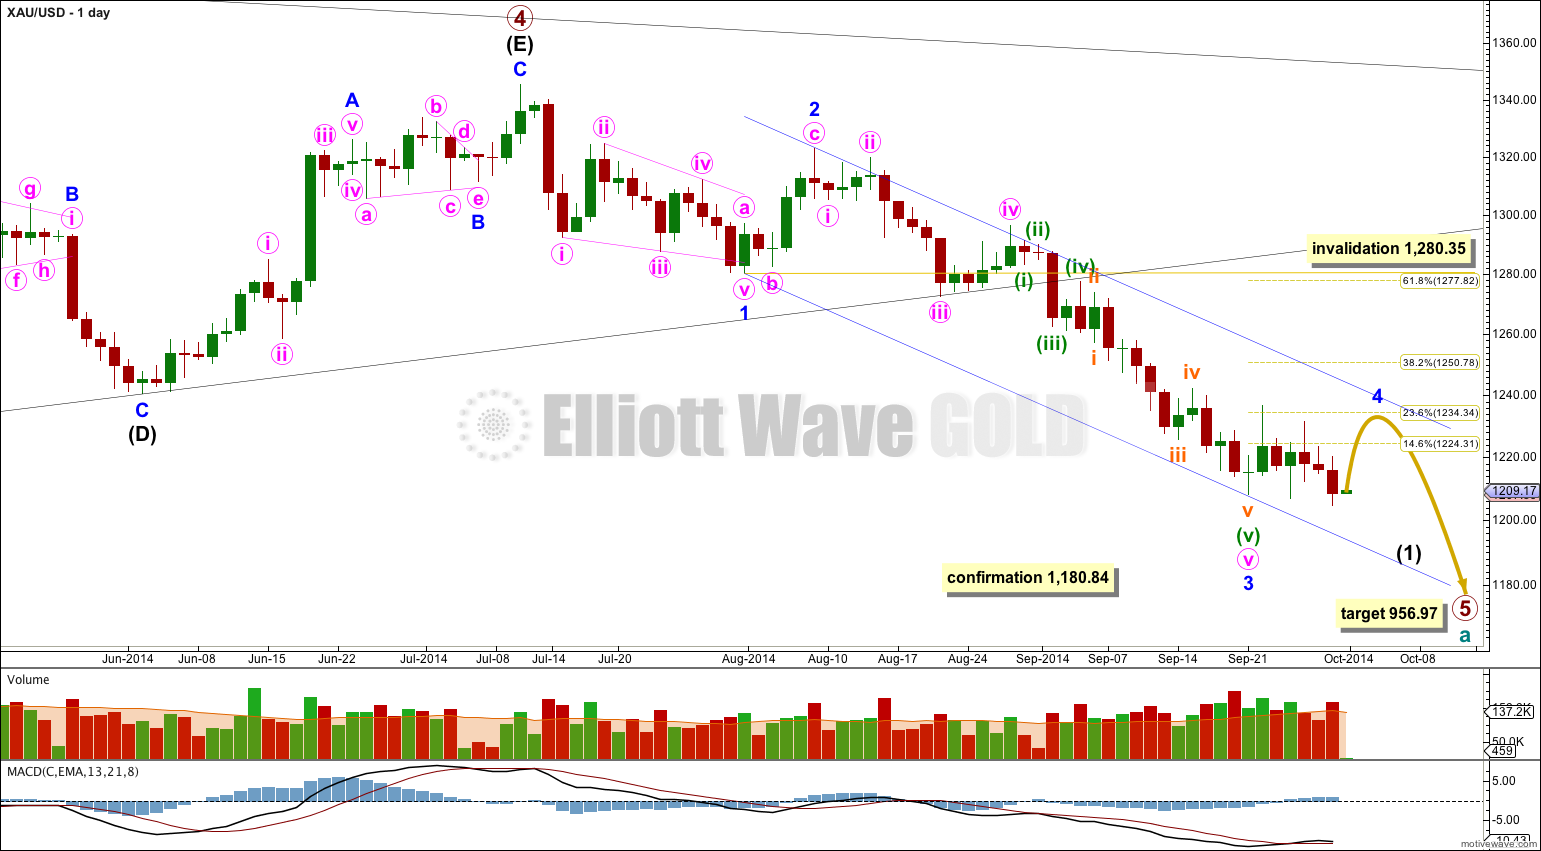
On the weekly chart extend the triangle trend lines of primary wave 4 outwards. The point in time at which they cross over may be the point in time at which primary wave 5 ends. This does not always work, but it works often enough to look out for. It is a rough guideline only and not definitive. A trend line placed from the end of primary wave 4 to the target of primary wave 5 at this point in time shows primary wave 5 would take a total 26 weeks to reach that point, and that is what I will expect. Primary wave 5 has begun its 12th week.
At 956.97 primary wave 5 would reach equality in length with primary wave 1. Primary wave 3 is $12.54 short of 1.618 the length of primary wave 1, and equality between primary waves 5 and 1 would give a perfect Elliott relationship for this downwards movement.
However, when triangles take their time and move close to the apex of the triangle, as primary wave 4 has (looking at this on a weekly chart is clearer) the movement following the triangle is often shorter and weaker than expected. If the target at 956.97 is wrong it may be too low. In the first instance I expect it is extremely likely that primary wave 5 will move at least below the end of primary wave 3 at 1,180.40 to avoid a truncation. When intermediate waves (1) through to (4) within primary wave 5 are complete I will recalculate the target at intermediate degree because this would have a higher accuracy. I cannot do that yet; I can only calculate it at primary degree.
Minor wave 3 is $9.65 longer than 1.618 the length of minor wave 1. This variation is less than 10% the length of minor wave 3 and so I would consider it an acceptable Fibonacci ratio. Just.
Movement comfortably below 1,180.84 would provide further confidence in this main wave count as at that stage an alternate idea which sees primary wave 4 as continuing would be invalidated.
I have drawn a Fibonacci retracement the length of minor wave 3. Minor wave 4 has so far reached up to the 0.236 at 1,234.34. If minor wave 4 continues as a triangle this will be its maximum depth. If it continues as a flat correction then it may yet move higher to the 0.382 at 1,250.78 Fibonacci ratio. If it continues as a combination then about the 0.236 Fibonacci ratio will be close to its maximum depth.
Draw a channel about intermediate wave (1): draw the first trend line from the lows labeled minor waves 1 to 3, then place a copy on the high labeled minor wave 2. If it completes as a flat correction minor wave 4 may find resistance and may end about the upper edge of this blue channel. If it overshoots the channel it should find some resistance at the upper blue trend line before breaking above it.
There is a nice morning doji star on this daily chart which supports this wave count. A morning doji star is a bottom reversal pattern, indicating the prior bear trend of minor wave 3 should change to a new trend. This new trend may be either upwards or sideways, and the wave count expects it is sideways.
There are still three structural possibilities for this fourth wave correction: a flat, a triangle or a combination. If fourth wave correction continues for another two days / sessions it may end in a total Fibonacci eight days, this Thursday. This expectation is the same for all three hourly wave counts.
All three hourly wave counts below are viable and all three scenarios must be considered. At this stage I do not favour either of the three hourly wave counts. All expect Gold to remain range bound in a consolidation phase probably for two more days at least.
Hourly Wave Count – Triangle
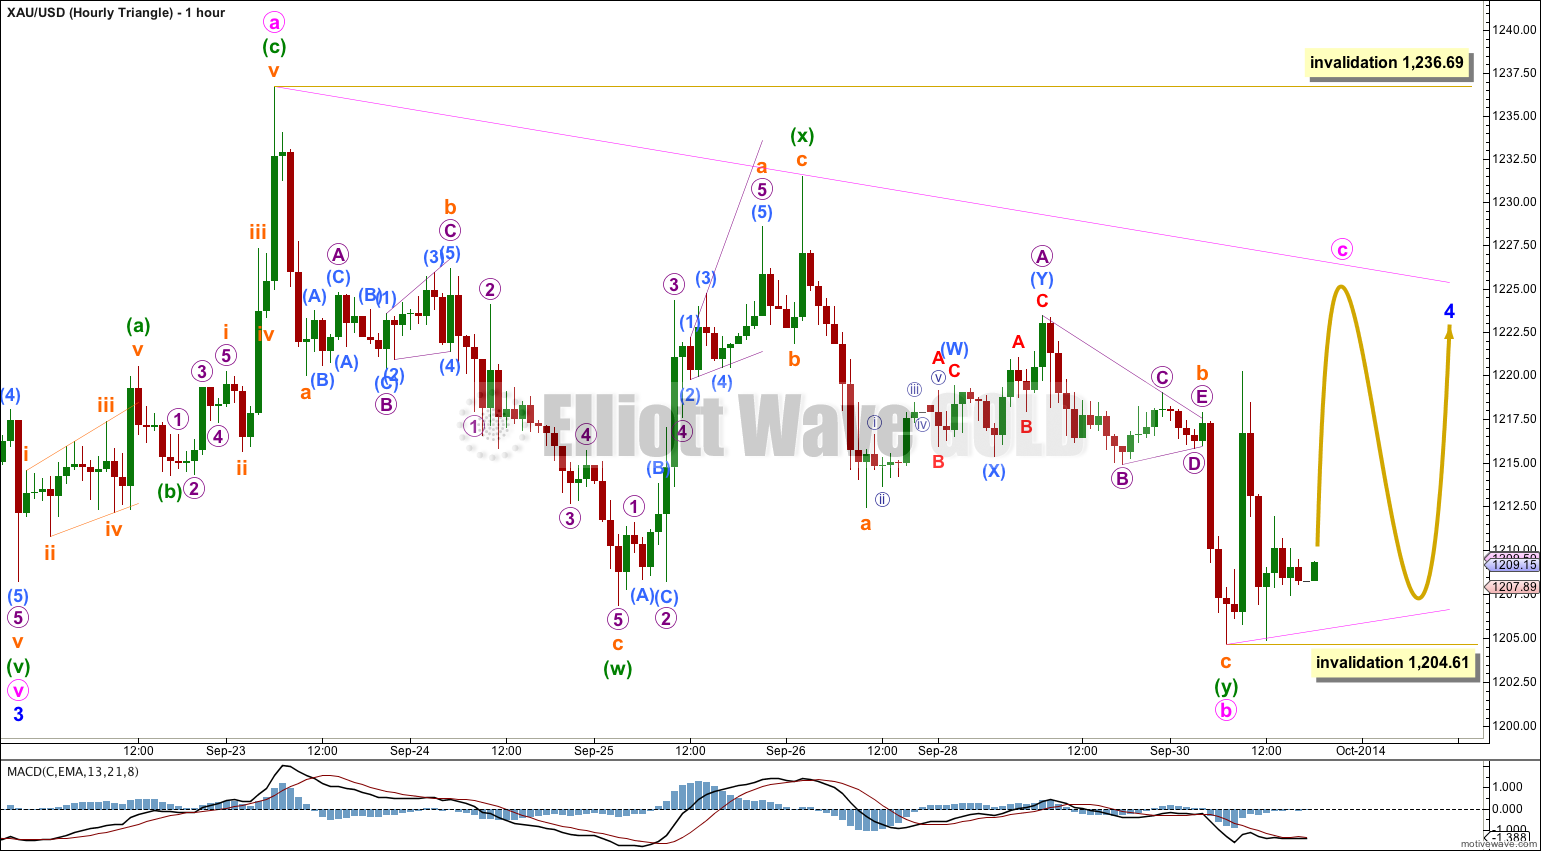
Minor wave 4 may still be unfolding as a triangle.
Within a triangle one of the subwaves is often a more complicated and time consuming double zigzag. This may have been minute wave b.
Minute wave b is a 113% correction of minute wave a. The triangle would be a running contracting or barrier triangle.
Within both a contracting and barrier triangle minute wave c may not move beyond the end of minute wave a above 1,236.69. Minute wave c would be very likely to end at the upper pink trend line drawn from the end of minute wave a to the end of minuette wave (x) within minute wave b as it is very common for the subwaves within triangles to touch the triangle trend lines.
Within a contracting triangle minute wave d may not move beyond the end of minute wave b below 1,204.61.
Within a barrier triangle minute wave d may end about the same level as minute wave b at 1,204.61. In practice this means minute wave d may end slightly below 1,204.61 as long as the b-d trend line remains essentially flat. This lower invalidation point is not black and white. This is the only Elliott wave rule which has any grey area.
Minute wave e may not move beyond the end of minute wave c and is most likely to end short of the a-c trend line.
Only one of the five subwaves of a triangle may be a more complicated double. This means all the remaining triangle subwaves of c, d and e must be simple A-B-C corrective structures, and they are most likely to be single zigzags. This triangle could end in just two more days, or it could take a little longer.
Hourly Wave Count – Combination
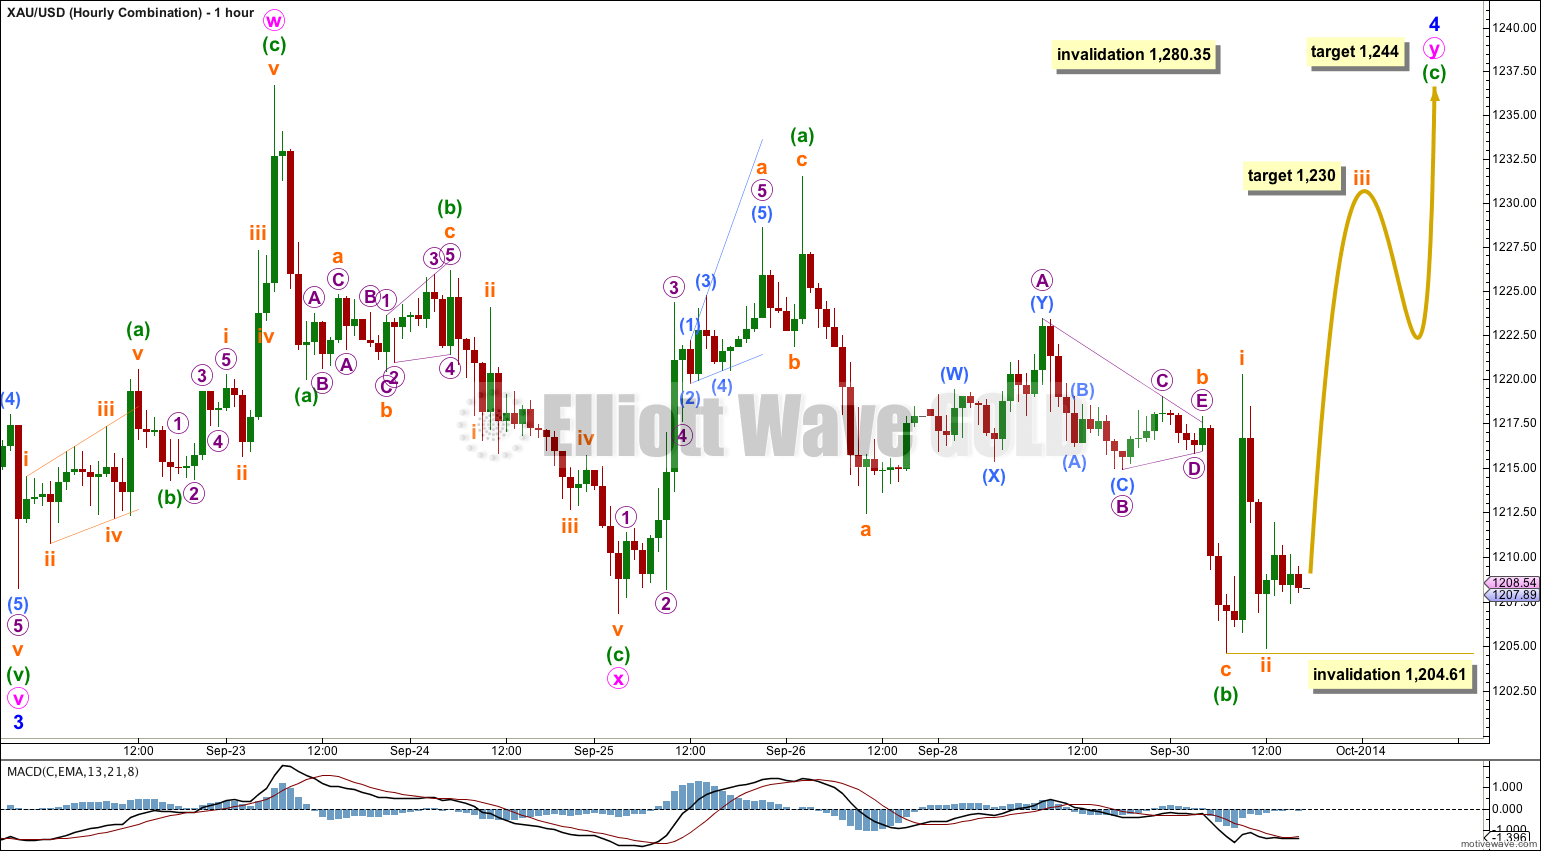
At this stage a combination is also entirely possible, and with the duration of minuette wave (b) this idea is now taking on a more typical look.
It is my experience over the years that when one expects a triangle is unfolding it is always necessary to consider a combination alongside it. Often what you think is a triangle completing turns out to be a combination, as the triangle invalidates itself just before the structure ends.
The first structure in the double combination was a zigzag labeled minute wave w. The double is joined by a three, a zigzag, in the opposite direction labeled minute wave x. The second structure in the double combination is a flat correction labeled minute wave y.
Within the flat correction minuette wave (b) is a 109% correction of minuette wave (a) and so the flat is an expanded flat. Expanded flats most commonly have C waves which are 1.618 the length of their A waves. At 1,244 minuette wave (c) would reach 1.618 the length of minuette wave (a).
Within minuette wave (c) at 1,230 subminuette wave iii would reach 1.618 the length of subminuette wave iv.
Subminuette wave ii may not move beyond the start of subminuette wave i below 1,204.61.
The purpose of double combinations is to move price sideways and take up time. The second structure in the double normally ends close to the end of the first structure. At 1,244 minute wave y would end reasonably close to 1,236.69.
Hourly Wave Count – Flat
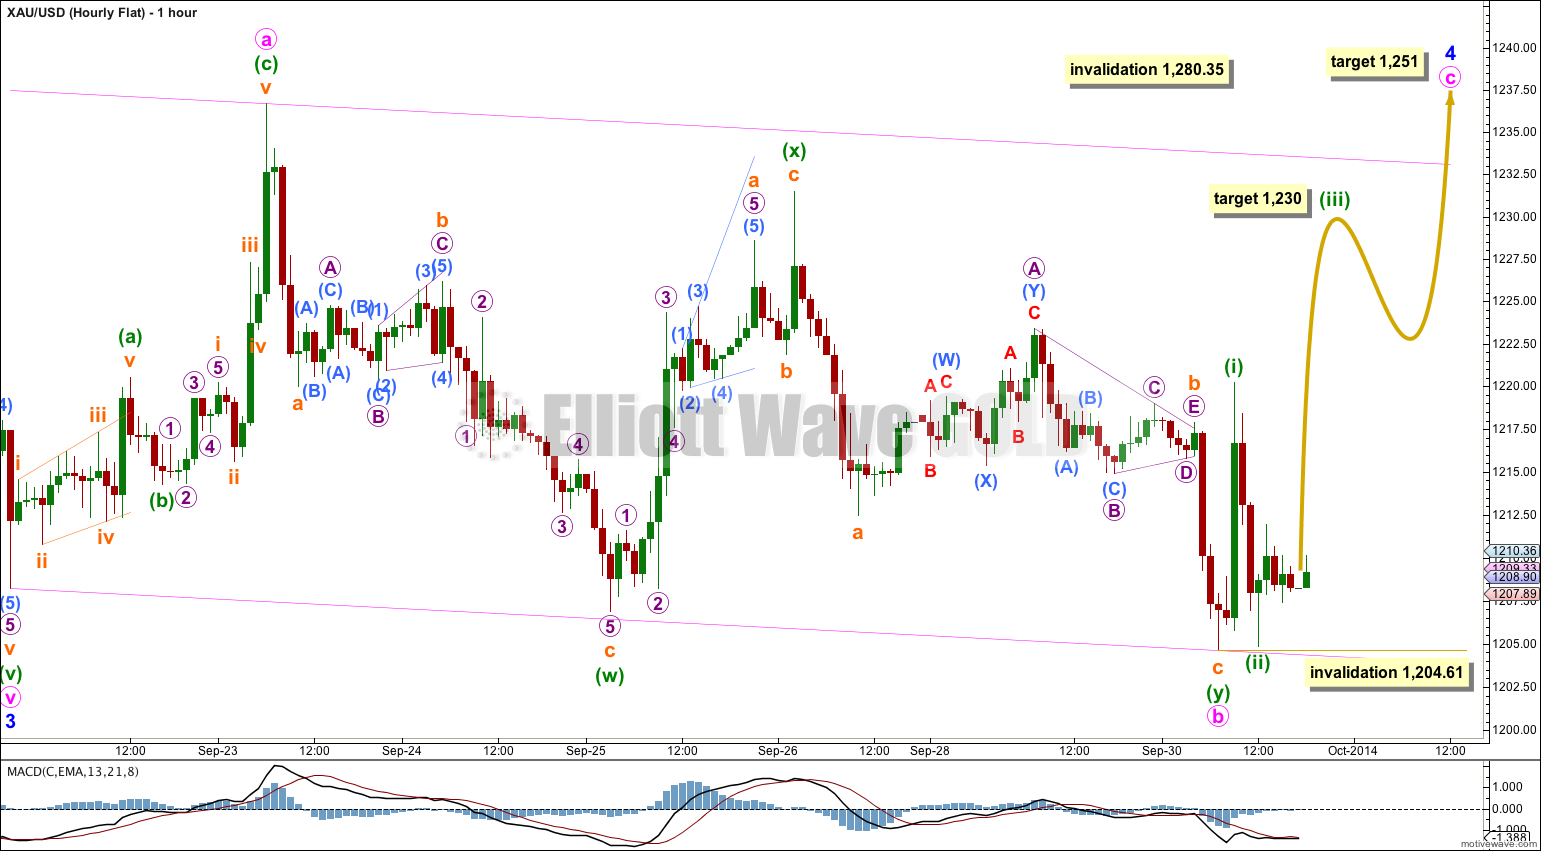
A flat correction for minor wave 4 is still possible, with a time consuming double zigzag for minute wave b within it.
Minute wave b is a 113% correction of minute wave a so this is an expanded flat correction. At 1,251 minute wave c would reach 1.618 the length of minute wave a and minor wave 4 would reach up to the 0.382 Fibonacci ratio of minor wave 3.
Minute wave c could complete within two more days or sessions, or it may require a little longer. Within minute wave c at 1,230 minuette wave (iii) would reach 1.618 the length of minuette wave (i).
Within minute wave c minuette wave (ii) may not move beyond the start of minuette wave (i) below 1,204.61.
This analysis is published about 06:30 p.m. EST.
I think the next analysis elaborated on this.
Thursday was an expectation, but it has not been met. Its still in a consolidation phase.
Range bound till Thursday: then breakout will b downside. ? means tomorrow is the last day for gold to go up? 1250 was the tgt? price can go up on Friday as well or we have to short on Thursday high?? plz elaborate thanks
I hope you didn’t jinx yourself by posting 3 wave counts with the same invalidation point. You don’t do it often, but I remember the last time you did it a few months back…all 3 were invalidated.
LOL
so far so good….
and TBH I didn’t notice that I’d done that until after I’d prepared all three charts….
but that last wave down with the triangle in the middle is such a clear three, it seemed clear it had to go up after that.