
Analysis is a little earlier than usual today.
Price remains below the black (B)-(D) trend line on the daily chart. I expect Wednesday’s session will close below this line providing full confirmation of this wave count.
Summary: Despite a green candlestick for Wednesday’s session the structure to the downside is incomplete. A small fourth wave correction should end within a few hours and be followed by another wave down to the target 1,218 which may be met in a few days time. If Wednesday’s session ends with a candlestick fully below the black (B)-(D) trend line on the daily chart I will have 100% confidence that Gold is in a primary degree trend downwards.
Click on charts to enlarge.
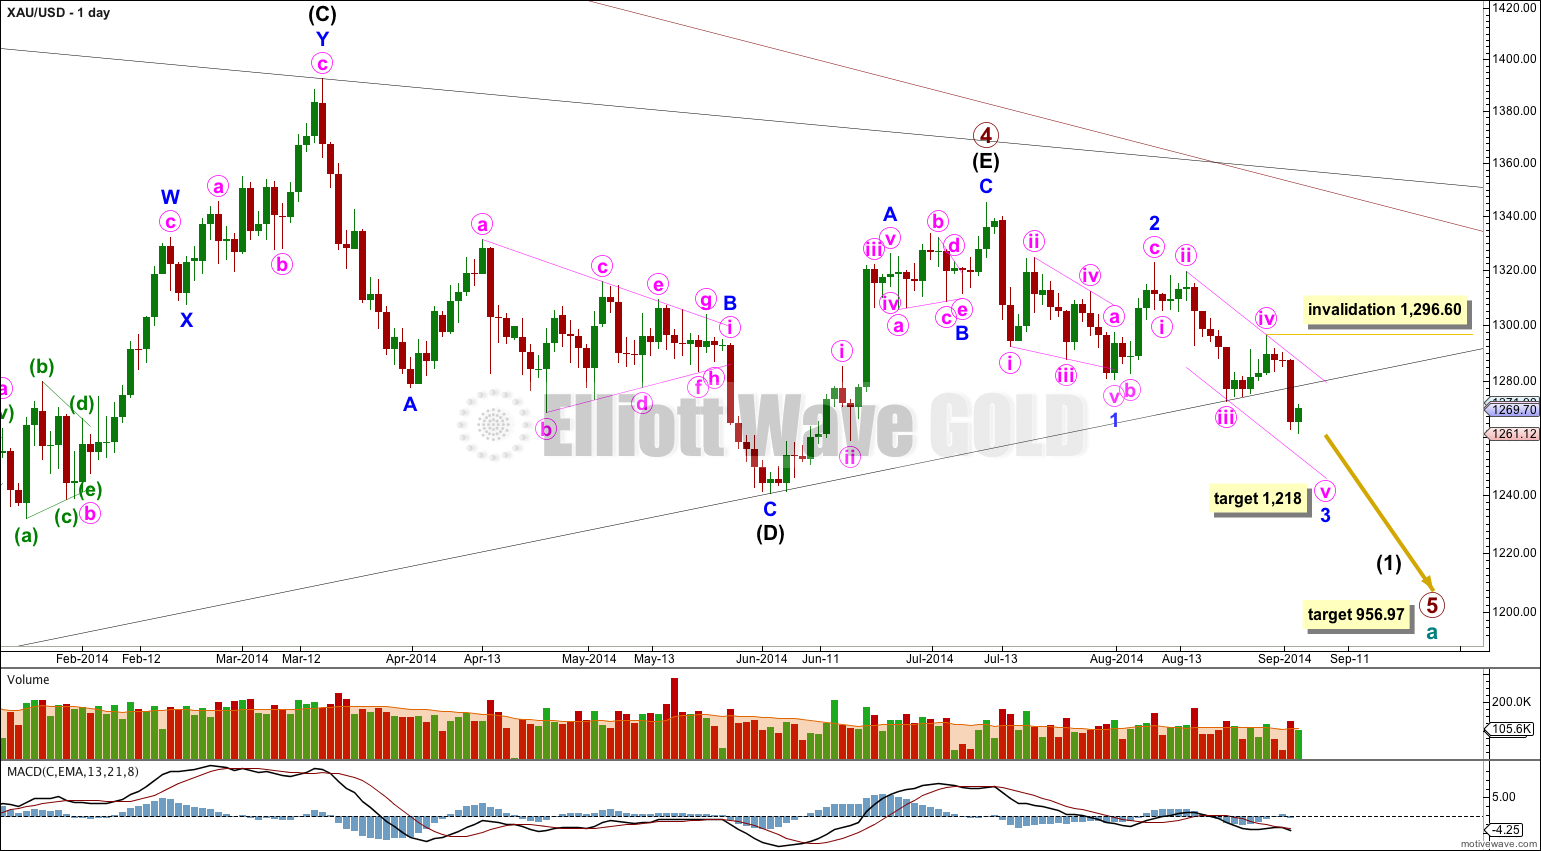
The black (B)-(D) trend line is clearly breached. If Wednesday’s candlestick closes below the black trend line I will have 100% confidence that primary wave 4 is over and primary wave 5 has begun.
At 956.97 primary wave 5 would reach equality in length with primary wave 1. Primary wave 3 is $12.54 short of 1.618 the length of primary wave 1, and equality between primary waves 5 and 1 would give a perfect Elliott relationship for this downwards movement.
However, when triangles take their time and end as the contracting trend lines come close to touching as primary wave 4 has (looking at this on a weekly chart is clearer) the movement following the triangle is often shorter than expected. If the target at 956.97 is wrong it may be too low. In the first instance I expect it is extremely likely that primary wave 5 will move at least below the end of primary wave 3 at 1,180.40 to avoid a truncation. When intermediate waves (1) through to (4) within primary wave 5 are complete I will recalculate the target at intermediate degree because this would have a higher accuracy.
Minor wave 1 is a leading contracting diagonal. This was followed by a somewhat deep correction, a zigzag for minor wave 2.
At 1,218 minor wave 3 would reach 1.618 the length of minor wave 1.
There is already a close ratio of 2.618 between minute waves i and iii within minor wave 3, so we may not see a Fibonacci ratio between minute wave v and either of i or iii.
This target expects an extended fifth wave for minute wave v to complete minor wave 3, which is common for Gold and commodities.
Within minute wave v no second wave correction may move beyond its start above 1,296.60.
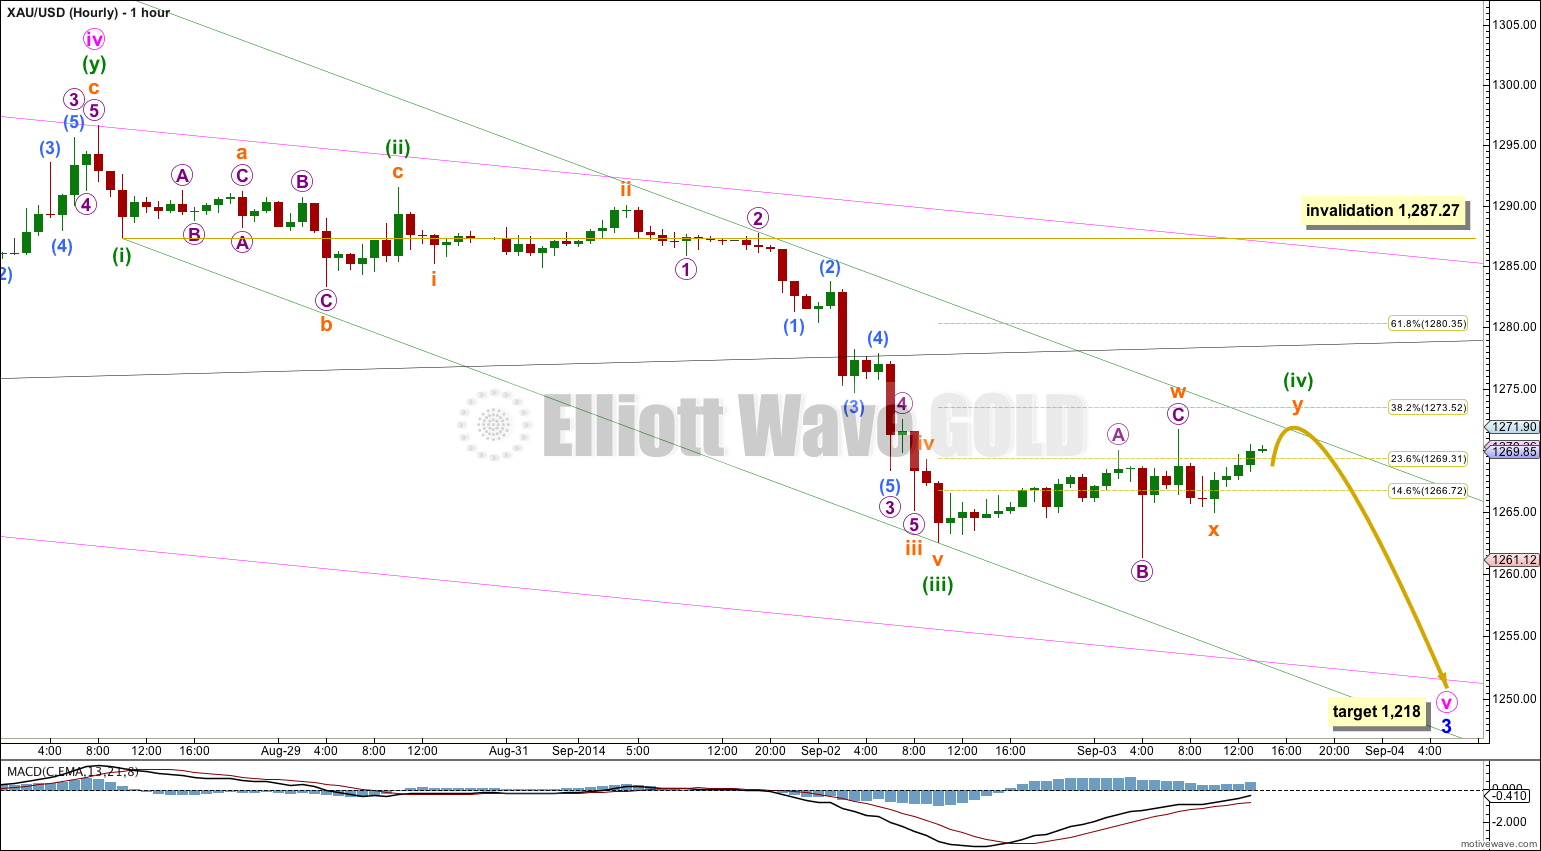
Sideways and upwards movement for Wednesday’s session is showing clearly on the daily chart as a green candlestick. I do not think this is a micro degree correction and have moved some of this labeling within this movement up one degree. If this correction is within minuette degree then its counterpart second wave also shows on the daily chart as a small red doji.
There is no Fibonacci ratio between minuette waves (i) and (iii). I would expect to see a Fibonacci ratio for the upcoming minuette wave (v) and either of (i) or (iii). When I know where minuette wave (iv) has ended I will add to the target calculation at a second wave degree, so it may widen to a small zone or it may change.
Ratios within minuettte wave (iii) are: subminuette wave iii is 1.48 short of 4.236 the length of subminuette wave i, and subminuette wave v is just 0.5 longer than equality in length with subminuette wave i.
Ratios within subminuette wave iii are: there is no Fibonacci ratio between micro waves 3 and 1, and micro wave 5 is just 0.01 short of 0.382 the length of micro wave 3.
Ratios within micro wave 3 are: there is no Fibonacci ratio between submicro waves (3) and (1), and submicro wave (5) is 0.73 short of 1.618 the length of submicro wave (1), and also 0.55 longer than equality with submicro wave (3).
Minuette wave (ii) was a relatively shallow 45% expanded flat correction; within it subminuette wave b is a 199% correction of subminuette wave a, and subminuette wave c has no Fibonacci ratio to subminuette wave a.
Minuette wave (iv) may be completing as a double combination, showing some structural alternation with the expanded flat of minuette wave (ii).
Minuette wave (iv) is incomplete. It may turn out to be a relatively deep correction and could reach up to the 0.618 Fibonacci ratio of minuette wave (iii) at 1,280.35. If it takes its time getting there this may also be where price could come up to touch the black (B)-(D) trend line.
If price gets up that high I would expect it to find extremely strong resistance at the black (B)-(D) trend line, I would not expect this trend line to be breached. We may be about to see a typical throwback.
I have drawn a best fit parallel channel about minute wave v (green trend lines). In the first instance I would look to see if minuette wave (iv) finds resistance at the upper edge of this channel. If it overshoots the upper green trend line the channel will have to be redrawn.
Minuette wave (iv) may not move into minuette wave (i) price territory above 1,287.27.
This analysis is published about 02:25 p.m. EST.
Lara, I have the trendline two points lower than in your chart, so that (most of) the price consolidation at the breakdown in the early hours of the 2nd were resting on the line, rather than below the line… making it at around 1276 at the moment on your chart.
Hard to tell exactly where as some continuous contracts at some data providers moved to the December Contract, while others moved onto the September Contract, meaning the price jumped two points at options expiry at the end of July.
I use IQFeed and they have two contracts, GC and QGC. QGC is the one which remained consistent since before Dec 2013, therefore that’s the one I use to determine where the line should be (as from that date it joins all the data points).
… but if today’s high holds, the market disagrees with me.
True, different data will give slightly different trend lines… On motive wave on my daily chart the candlestick for Thursday almost touches the trend line. On the hourly chart I can see a small gap.
I’m using my FXCM data feed for Gold data.
Either way, that was a pretty good throwback! I sure hope members managed to profit from that!
When do expect primary 5 to end roughly?
Thanks!
http://elliottwavegold.com/2014/09/gold-elliott-wave-technical-analysis-2nd-september-2014/
Another 18 weeks. Read the historic analysis linked to here for an explanation of why.