
A throwback up to the (B)-(D) trend line was expected from yesterday’s Elliott wave analysis, which is exactly what happened. Price came extremely close to the trend line before sharply turning back downwards.
Summary: The first target for downwards movement to end is now able to be calculated at a low wave degree and has a higher probability, at 1,231. If price keeps dropping below this point the next target for it to end is at 1,221 – 1,218. Downwards movement may end in two or three days time.
Click on charts to enlarge.
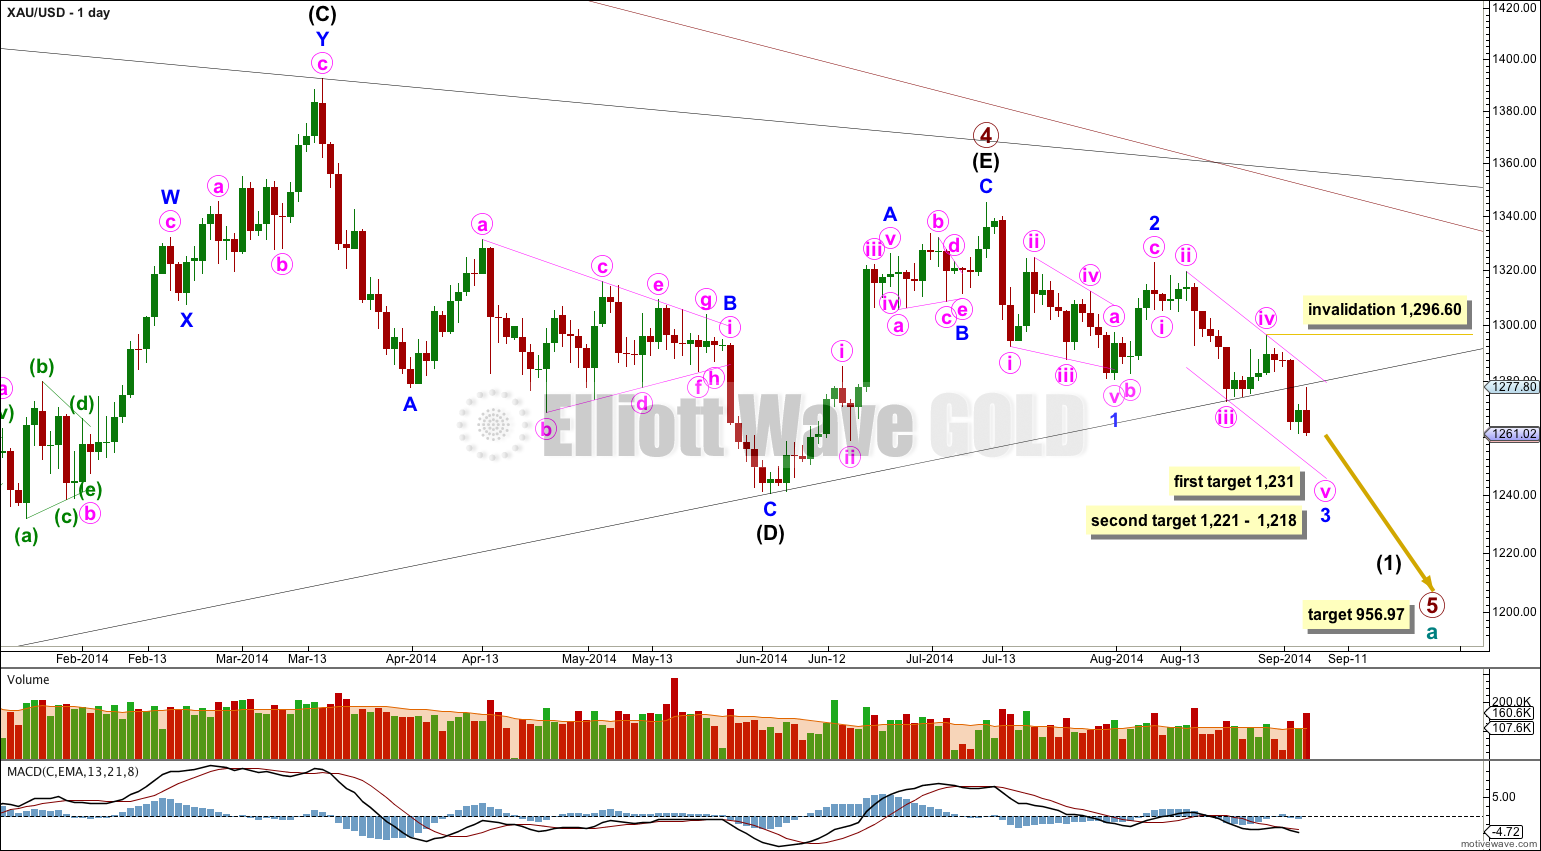
The black (B)-(D) trend line is clearly breached. There are now two clear daily candlesticks below this black trend line and so I have confidence that primary wave 5 has begun.
At 956.97 primary wave 5 would reach equality in length with primary wave 1. Primary wave 3 is $12.54 short of 1.618 the length of primary wave 1, and equality between primary waves 5 and 1 would give a perfect Elliott relationship for this downwards movement.
However, when triangles take their time and end close to the apex of the triangle, as primary wave 4 has (looking at this on a weekly chart is clearer) the movement following the triangle is often shorter and weaker than expected. If the target at 956.97 is wrong it may be too low. In the first instance I expect it is extremely likely that primary wave 5 will move at least below the end of primary wave 3 at 1,180.40 to avoid a truncation. When intermediate waves (1) through to (4) within primary wave 5 are complete I will recalculate the target at intermediate degree because this would have a higher accuracy. I cannot do that yet; I can only calculate it at primary degree.
Minor wave 1 is a leading contracting diagonal. This was followed by a somewhat deep correction, a zigzag for minor wave 2.
At 1,218 minor wave 3 would reach 1.618 the length of minor wave 1. At 1,221 minute wave v within minor wave 3 would reach 1.618 the length of minute wave iii. If price drops through the first target, or if when it gets there the structure is incomplete, then I would use this second target zone. The first target is calculated at minuette wave degree on the hourly chart.
This target expects an extended fifth wave for minute wave v to complete minor wave 3, which is common for Gold and commodities.
Within minute wave v no second wave correction may move beyond its start above 1,296.60.
Draw a channel about minor wave 3 on the daily chart and copy it over carefully to the hourly chart: draw the first trend line from the highs labeled minute waves ii to iv, then place a parallel copy on the low labeled minute wave v. Expect downwards movement for minute wave v to find support, and maybe end, at this lower pink trend line.
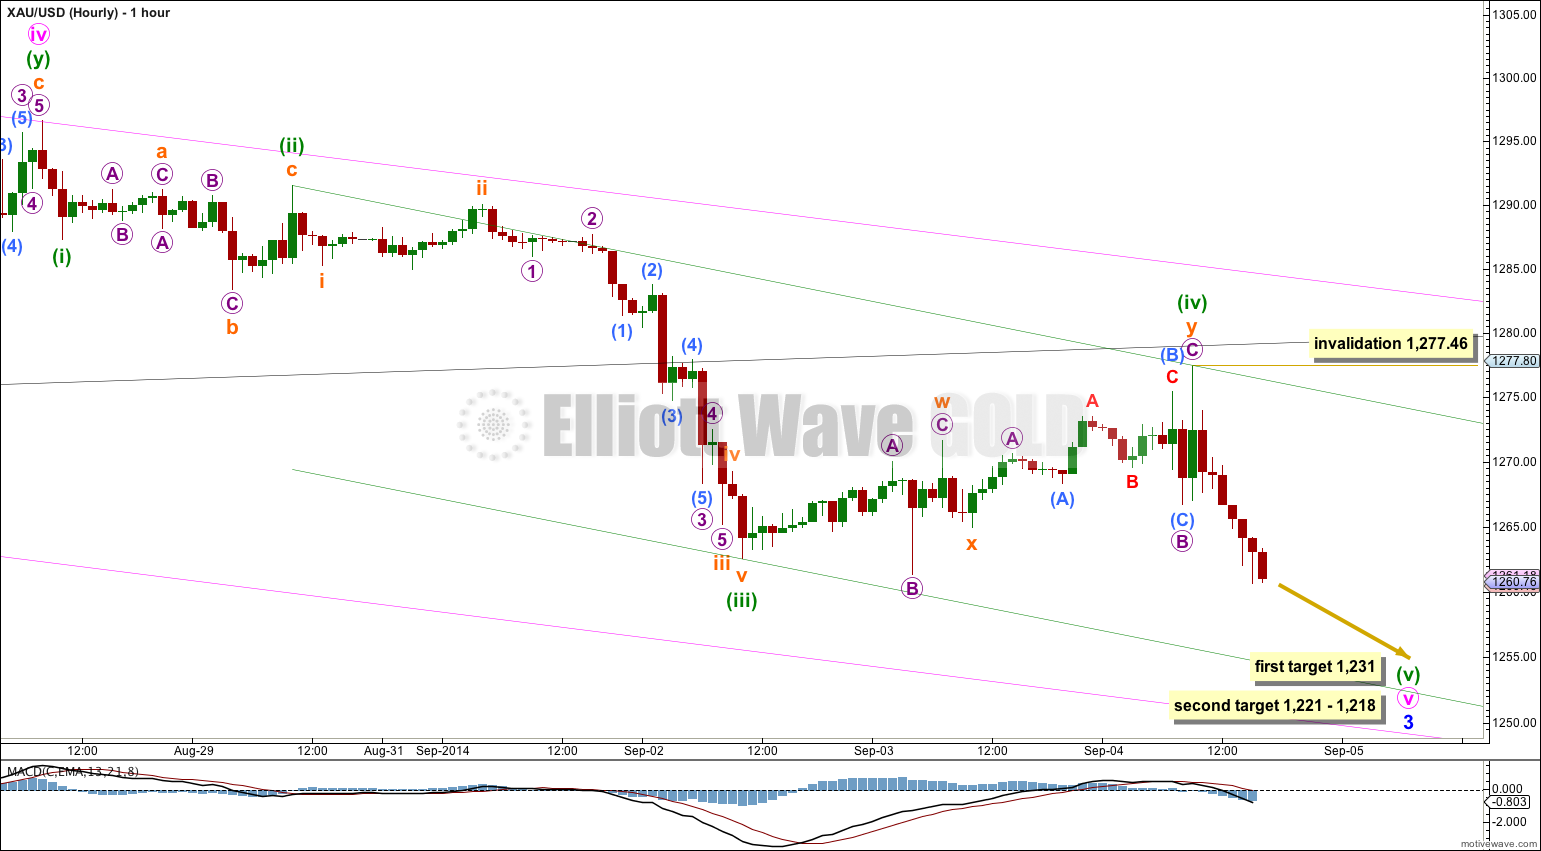
On my FXCM data feed minuette wave (iv) came close to, but did not touch, the black (B)-(D) trend line. This is a fairly typical throwback.
I have redrawn the parallel channel about minute wave v: draw the first trend line from the highs labeled minuette waves (ii) to (iv), then place a parallel copy on the low labeled minuette wave (iii). In the first instance I would expect the lower edge of this channel to provide some support for downwards movement, but if minuette wave (v) is a typical extended fifth wave price may break below that trend line.
After that I would look to the lower edge of the pink channel copied over here from the daily chart to provide some support to downwards movement.
At 1,231 minuette wave (v) would reach 1.618 the length of minuette wave (iii). Because there is no Fibonacci ratio between minuette waves (i) and (iii) I would expect it is very likely we shall see a Fibonacci ratio between minuette wave (v) and either of (i) or (iii). This first target has a higher probability for this reason.
The second target zone of $3 has a lower probability. There is already a close Fibonacci ratio between minute waves i and iii, so we may not see a Fibonacci ratio for minute wave v to either of i or iii. Minor wave 3 may not exhibit a close Fibonacci ratio to minor wave 1. This second target zone may be too low. However, if price keeps going lower below the first target then this next area would be my expectation for downwards movement to end in the mid term.
So far within minor wave 3 minute wave i lasted 1 day, minute wave ii lasted 3 days, minute wave iii lasted 5 days, and minute wave iv lasted 5 days. All these durations are Fibonacci numbers. If minute wave lasts another three days it may end in a total Fibonacci 8. If minute wave v lasts only two more days then minor wave 3 in its entirety may last a total Fibonacci 21 days. So my expectation is for the target to be met in two or three days time.
This analysis is published about 05:15 p.m. EST.
One question to Lara///
On the SILVER you say invalidation 19.907=4 wave WHY? invalidation
the invalidation point allows for the degree within minute wave v to be all moved down one degree, if it turns out to be an extended fifth wave. no second wave correction may move beyond its start.
//////////////////////////
what you think about it
That wave count makes no sense to me.
You need to show how it fits into a bigger picture. There is too much on that chart which is unlabeled.
Elliott wave is fractal in nature, and each fractal must correctly fit into a larger fractal, and the subdivisions (lower fractals) must be correct. At all degrees.
It looks like you’re seeing a large leading diagonal unfolding, but your first wave within that is a leading diagonal? Within leading diagonals first waves may only be zigzags or impulses. So if I’m interpreting your chart correctly, that is an invalid wave count.
the big picture
what you say?
Hi Lara, a few things supporting gold here. I am bearish but I wanted to ask you what invalidated a wavecount where ABCD here is 3 wave correction to the down side?
Pic attached (I hope)
Because of a breach of the (B)-(D) trend line. If the triangle was still continuing that trend line should not be breached like this.