
Downwards movement continues as expected. Upwards corrections are finding resistance at the upper edge of the small green channel on the hourly chart, as expected.
The Elliott wave count remains the same.
Summary: The short term target at 1,241 may be met within 24 hours now. Thereafter, a small upwards correction may last a day or two. The mid term target remains the same at 1,231, with a second lower possibility at 1,221 – 1,218.
Click on charts to enlarge.
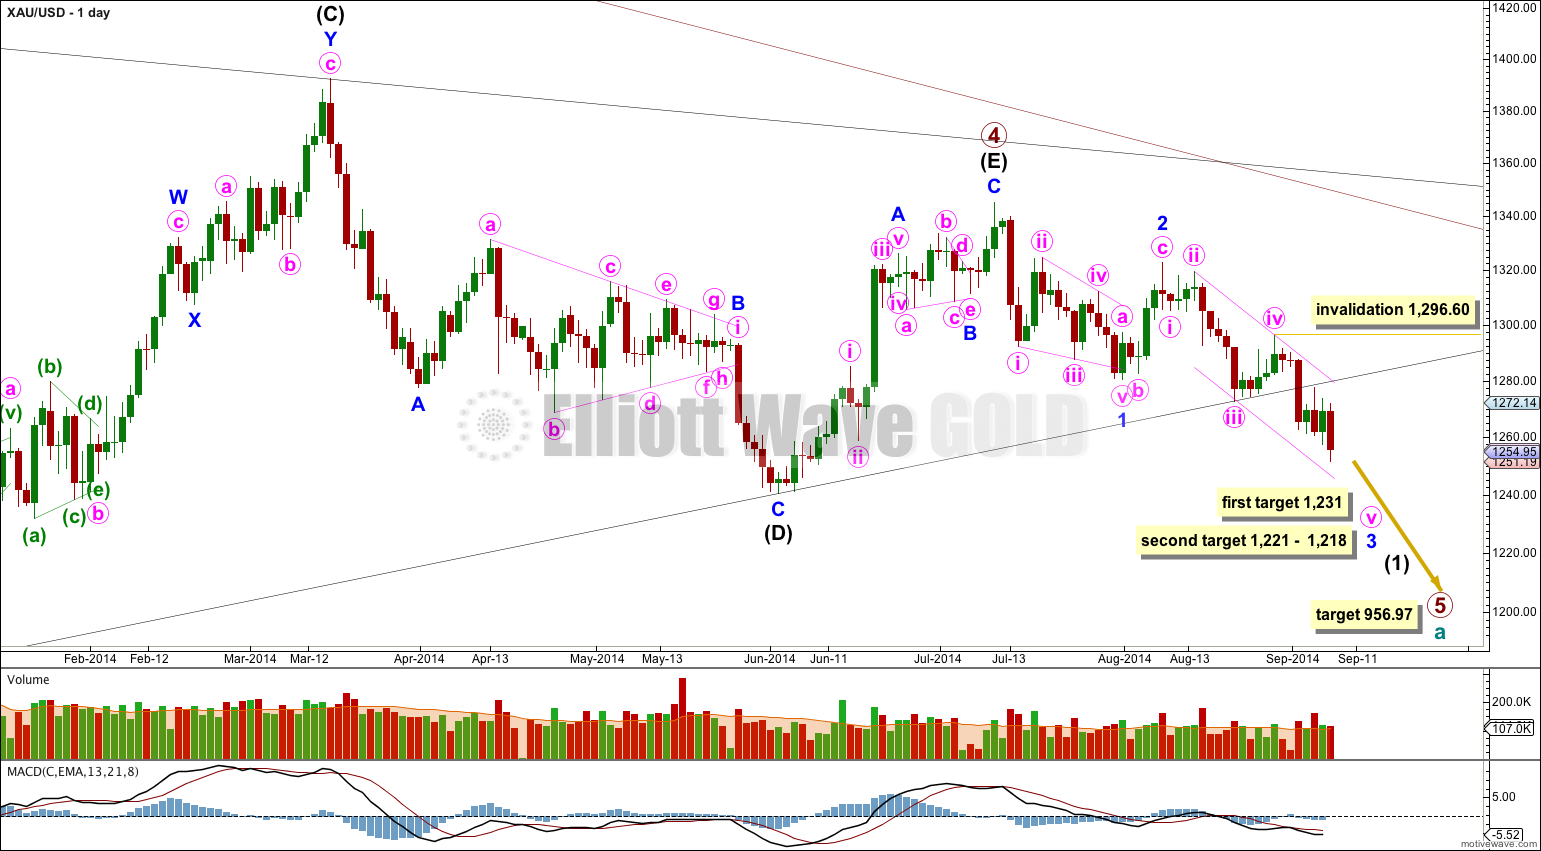
The black (B)-(D) trend line is clearly breached. There are now four clear daily candlesticks below this black trend line and so I have confidence that primary wave 5 has begun. The black (B)-(D) trend line is now also clearly breached on the weekly chart. This is significant.
In the last few trading days it is downwards days which have clearly higher volume. From a traditional technical analysis point of view this indicates the main trend is most likely down.
At 956.97 primary wave 5 would reach equality in length with primary wave 1. Primary wave 3 is $12.54 short of 1.618 the length of primary wave 1, and equality between primary waves 5 and 1 would give a perfect Elliott relationship for this downwards movement.
However, when triangles take their time and move close to the apex of the triangle, as primary wave 4 has (looking at this on a weekly chart is clearer) the movement following the triangle is often shorter and weaker than expected. If the target at 956.97 is wrong it may be too low. In the first instance I expect it is extremely likely that primary wave 5 will move at least below the end of primary wave 3 at 1,180.40 to avoid a truncation. When intermediate waves (1) through to (4) within primary wave 5 are complete I will recalculate the target at intermediate degree because this would have a higher accuracy. I cannot do that yet; I can only calculate it at primary degree.
On a weekly chart extend the triangle trend lines of primary wave 4 outwards. The point in time at which they cross over may be the point in time at which primary wave 5 ends. This does not always work, but it works often enough to look out for. It is a rough guideline only and not definitive. A trend line placed from the end of primary wave 4 to the target of primary wave 5 at this point in time shows primary wave 5 would take a total 26 weeks to reach that point, and that is what I will expect. So far it is in its ninth week.
Minor wave 1 is a leading contracting diagonal. This was followed by a somewhat deep correction, a zigzag for minor wave 2.
Within minute wave v no second wave correction may move beyond its start above 1,296.60.
Draw a channel about minor wave 3 on the daily chart and copy it over carefully to the hourly chart: draw the first trend line from the highs labeled minute waves ii to iv, then place a parallel copy on the low labeled minute wave iii. Expect downwards movement for minute wave v to find support, and maybe end, at this lower pink trend line.
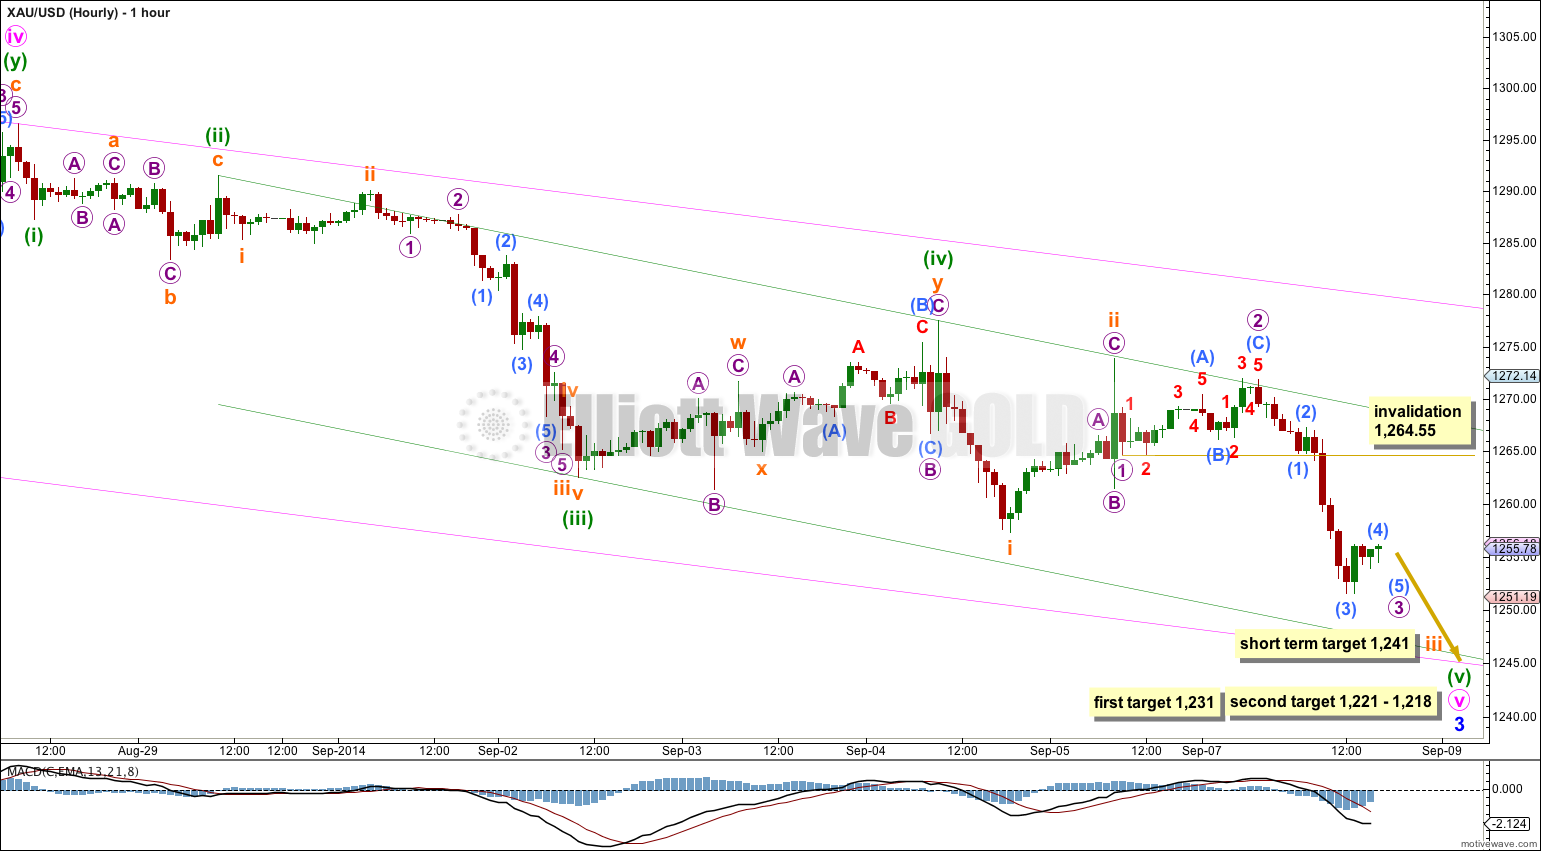
Because subminuette wave ii within minuette wave (v) shows up clearly on the daily chart, I expect that minuette wave (v) is extending. When subminuette wave iv arrives I would expect it is highly likely to also show up on the daily chart.
So far price remains contained within the small channel drawn on the hourly chart about minute wave v. Draw this green channel using Elliott’s second technique: draw the first trend line from the highs labeled minuette waves (ii) to (iv), then place a parallel copy on the low labeled minuette wave (iii). Minuette wave (v) may breach the lower edge of this channel as sometimes strong extended fifth waves in commodity markets do this.
At 1,241 subminuette wave iii would reach 1.618 the length of subminuette wave i. This target looks like it should be met within 24 hours now.
When subminuette wave iii is complete I will expect a shallow sideways correction for subminuette wave iv to show alternation with subminuette wave ii. Subminuette wave iv is very likely to show on the daily chart as at least one green candlestick or doji.
At 1,231 minuette wave (v) would reach 1.618 the length of minuette wave (iii). Because there is no Fibonacci ratio between minuette waves (i) and (iii) it is very likely that minuette wave (v) will exhibit a Fibonacci ratio to either of minuette waves (i) or (iii). This first higher target has the better probability.
If price keeps dropping through this first target, or if when it gets there the structure is incomplete, then the second lower probability target would be used.
At 1,218 minor wave 3 would reach 1.618 the length of minor wave 1. At 1,221 minute wave v within minor wave 3 would reach 1.618 the length of minute wave iii.
Within suminuette wave iii micro wave 4 may not move into micro wave 1 price territory above 1,264.55.
This analysis is published about 05:20 p.m. EST.
There’s too much more downwards movement now after it, this continuing downwards movement is not part of minor wave 4.
If minuette wave (v) ends at 1,257 where I have subminuette wave i only within it ending, than that means the entire structure of minor wave 3 would have to be over there and subsequent movement down would have to be minor wave 4. That looks all wrong.
Also… minor wave 3 has to move far enough below the end of minor wave 1 which is at 1,280.35 to allow room for upwards movement for minor wave 4 which may not move back into minor wave 1 price territory.
Im surprised breaking down out of such a long triangle it hasn’t really picked up steam yet….i hope this thing doesnt try to pull some fake out move
Hi Lara, in your hourly chart, you labeled, the minimum at 1257, as wave i orange. What is the reason that you do not consider it as a wave 5 green? Is it because the following wave ii orange did not exceed the upper trend channel?
Thanks in advance