
At this stage I expect Silver should end this first wave down next week. The short term target is 18.335. Thereafter, a second wave correction should unfold which may be very deep.
Click on charts to enlarge.
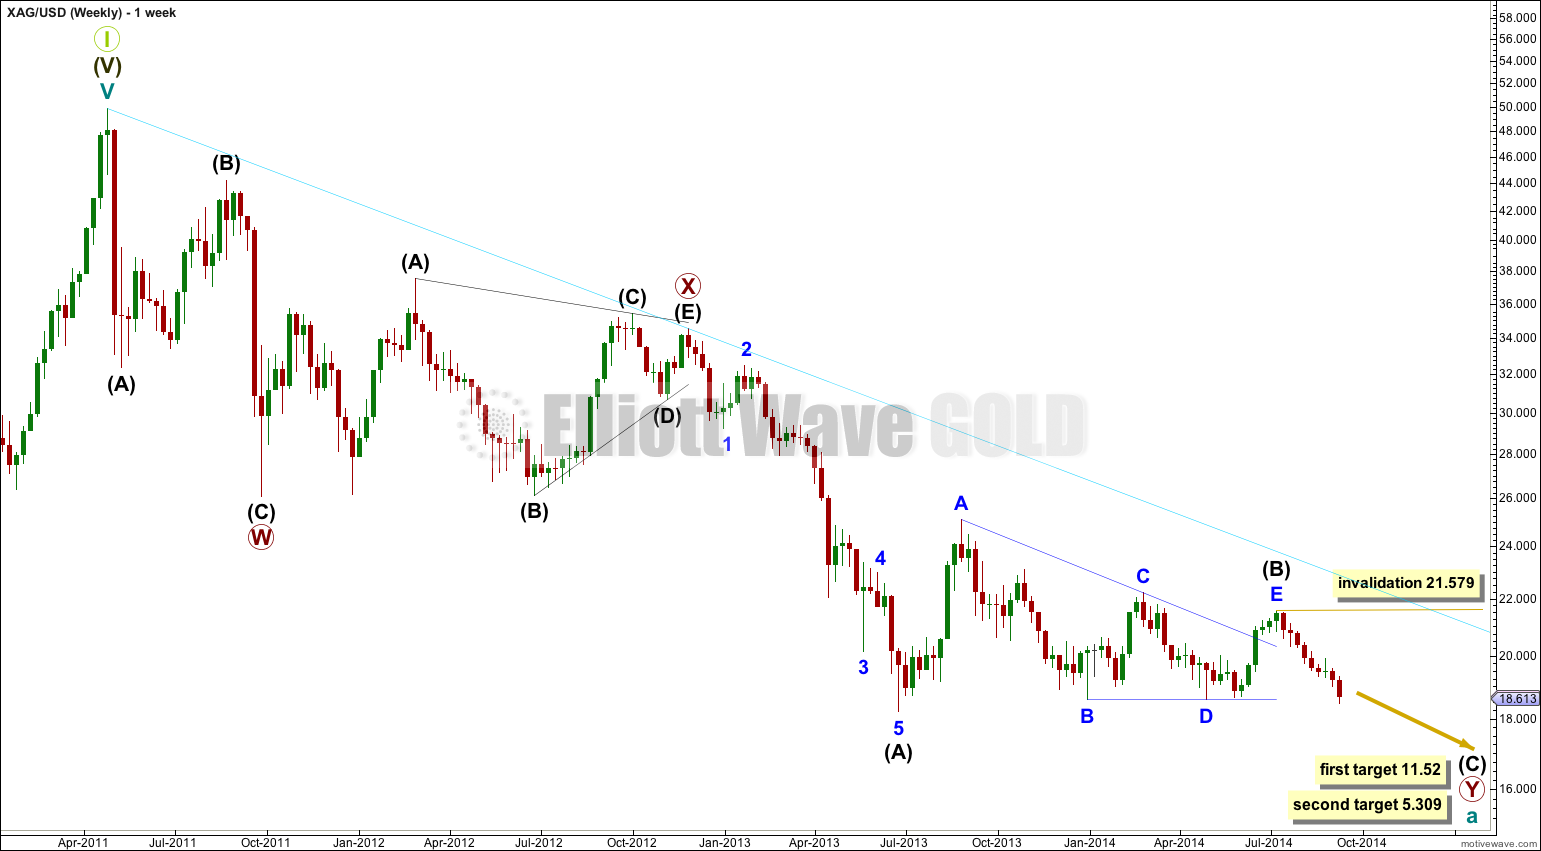
Downwards movement subdivides so far as an incomplete double zigzag. This cannot be an impulse if the movement which I have labeled primary wave X is correct as a triangle because a triangle may not be the sole structure in a second wave position.
The first zigzag in the double is labeled primary wave W. The double is joined by a “three”, a triangle, in the opposite direction labeled primary wave X.
The second zigzag for primary wave Y is moving price lower to deepen the correction, and so this structure has a typical double zigzag look in that it has a clear slope against the main trend.
Within primary wave Y the triangle for intermediate wave (B) is now a complete barrier triangle. Movements following triangles, and particularly barrier triangles, have a tendency to be relatively short and brief (more common), or sometimes they are a very long extension. The higher target has a higher probability for this reason.
Within primary wave Y at 11.52 intermediate wave (C) would reach 0.618 the length of intermediate wave (A). At 5.309 intermediate wave (C) would reach equality in length with intermediate wave (A).
Within primary wave Y intermediate wave (A) lasted 30 weeks, and intermediate wave (B) lasted exactly a Fibonacci 54 weeks. I would expect intermediate wave (C) to end in a total 21 or 34 weeks. So far it has lasted 9 weeks and may yet continue towards the target for a further 12 or 25 weeks, if it exhibits a Fibonacci duration. However, please note, Silver does not reliably exhibit Fibonacci durations nor do its waves reliably exhibit Fibonacci ratios to each other in terms of duration. This expectation of another 12 or 25 weeks can only be a rough guideline.
For July, August and September the strongest volume is on down days. This traditional technical analysis supports the Elliott wave count.
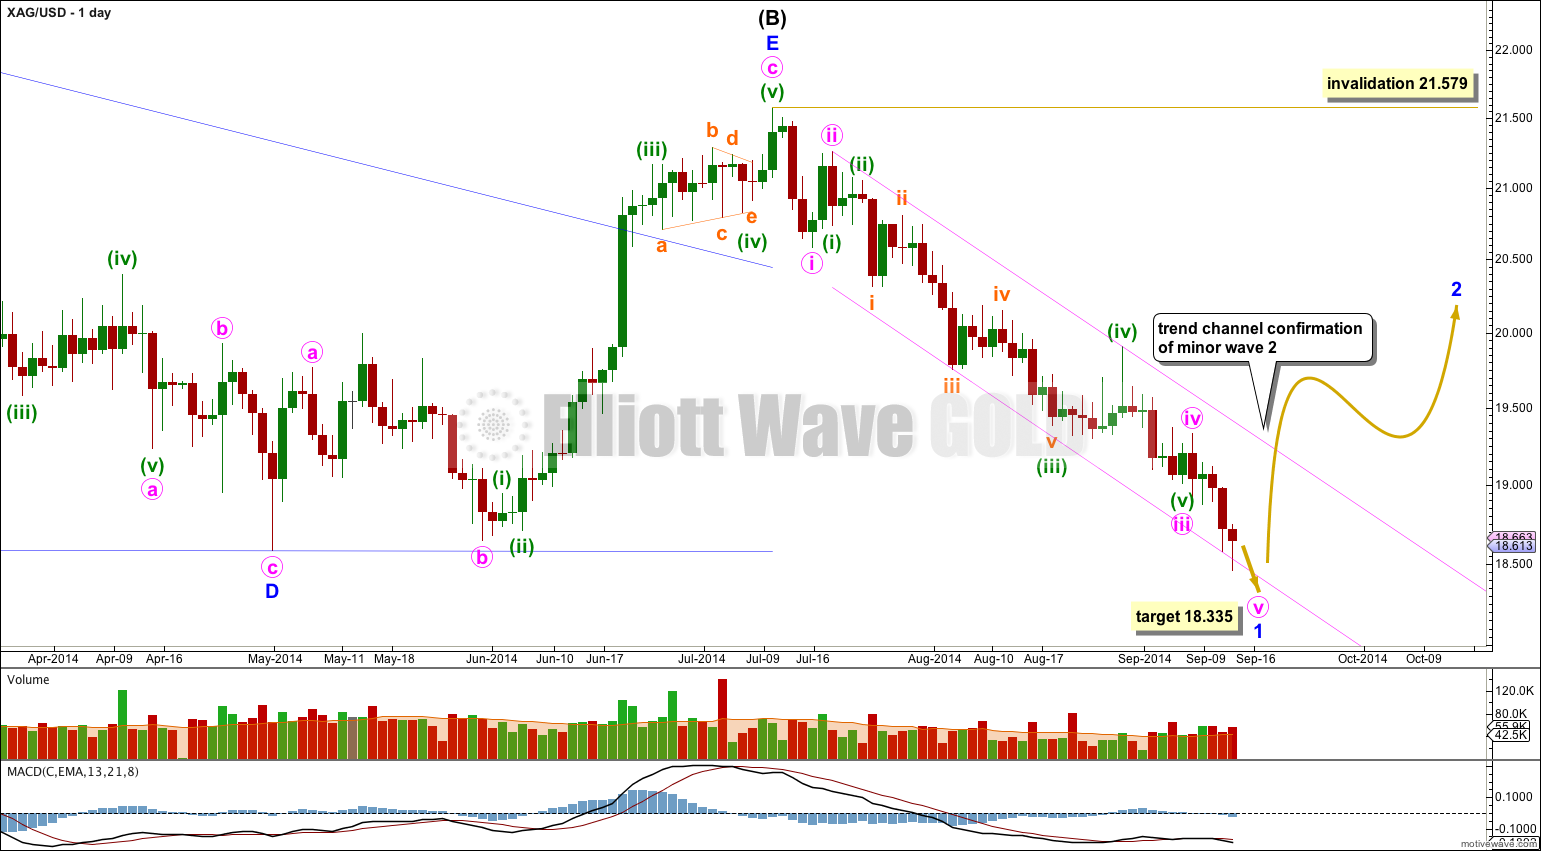
The triangle for intermediate wave (B) is very likely to be complete. It is a barrier triangle: the B-D trend line is essentially flat (in fact, minor wave D ends very slightly below the end of minor wave B by 0.004).
Intermediate wave (C) downwards should subdivide as a five wave structure, either an impulse (most likely) or an ending diagonal (less likely). At this stage it is far too early to tell which structure may unfold although an impulse does look to be what is happening.
Minor wave 1 is almost complete, and it is unfolding as a simple impulse.
Within minor wave 1 there is no adequate Fibonacci ratio between minute waves i and iii. This makes it more likely we shall see a Fibonacci ratio exhibited for minute wave v to either of i or iii. At 18.335 minute wave v would reach equality in length with minute wave i. As this is the most common relationship for a fifth wave this target has the highest probability.
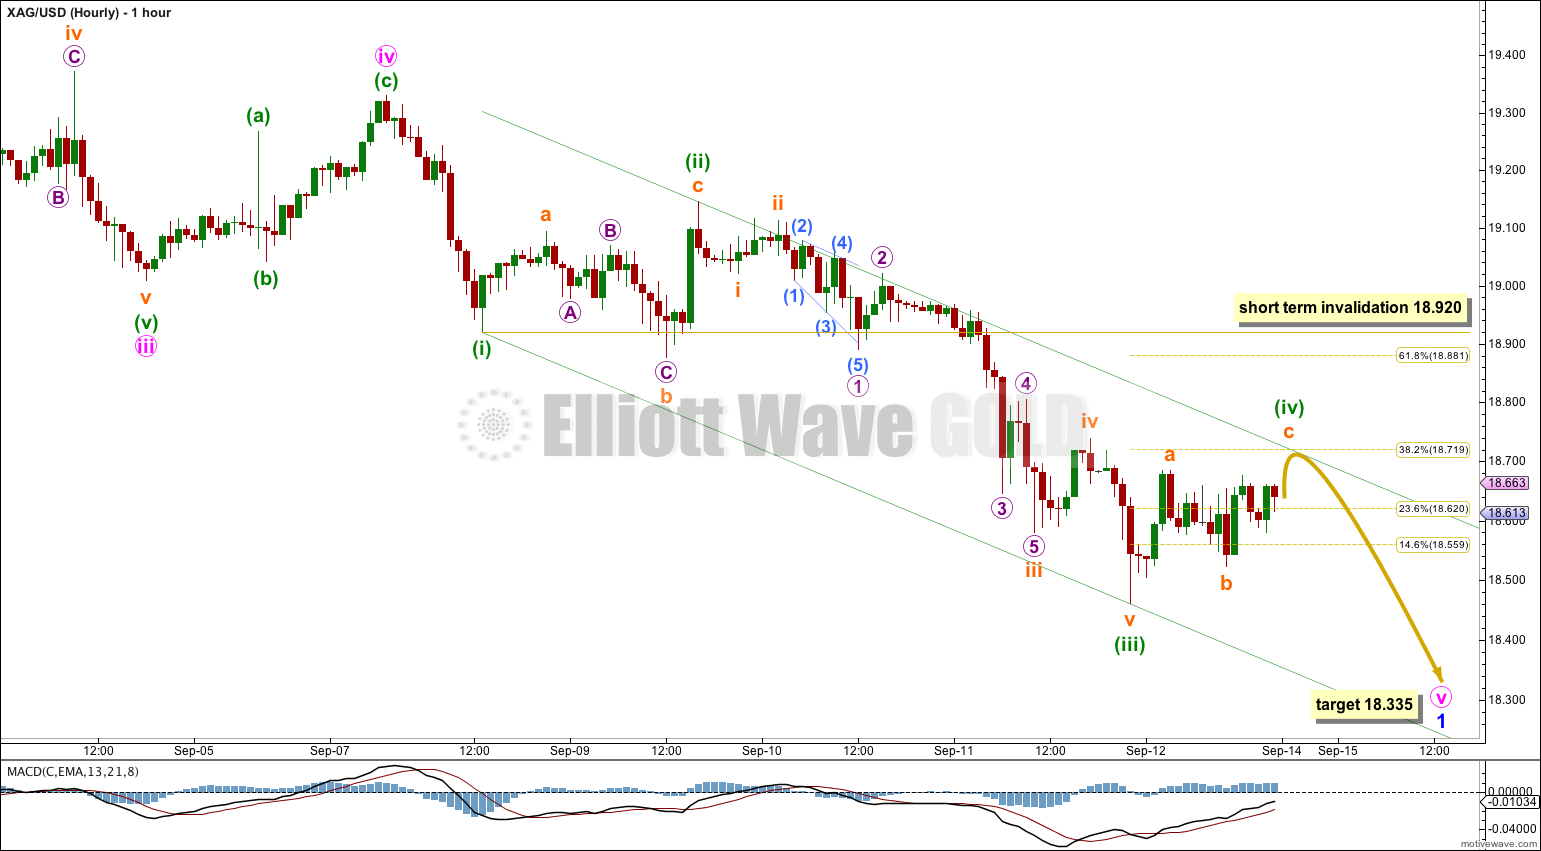
Ratios within minute wave iii are: there is no adequate Fibonacci ratio between minuette waves (i) and (iii), and minuette wave (v) is 0.053 longer than 1.618 the length of minuette wave (i).
Ratios within minuette wave (iii) are: there is no adequate Fibonacci ratio between subminuette waves i and iii, and subminuette wave v is 0.019 longer than equality with subminuette wave i.
Minor wave 1 does not fit nicely into a channel drawn using either of Elliott’s techniques so I have drawn a best fit channel instead. When this channel is very clearly breached by a full daily candlestick above the upper pink trend line and not touching it then I would have confidence that minor wave 1 is over and minor wave 2 is underway. I would expect minor wave 2 to most likely be deep, maybe reaching up to the 0.618 Fibonacci ratio of minor wave 1.
Minor wave 2 may not move beyond the start of minor wave 1 above 21.579.
Only the final fifth wave downwards is required to complete the structure for minor wave 1.
Minute wave v is incomplete. This downwards wave fits nicely so far into a channel drawn using Elliott’s first technique: draw the first trend line from the lows labeled minuette waves (i) to (iii), then place a parallel copy on the high labeled minuette wave (ii). In the first instance I would expect minuette wave (iv) to find resistance at the upper edge of that channel, and it may end there. Sometimes though fourth wave corrections are not contained within the channel which is why Elliott had a second technique to use when they breach the channel.
Minuette wave (ii) was a relatively deep 55% expanded flat correction. Minuette wave (iv) may be completing as a more shallow zigzag. It may end about the 0.382 Fibonacci ratio of minuette wave (iii) at 18.719.
Minuette wave (iv) may not move into minuette wave (i) price territory above 18.920.
When there is one more wave down to new lows, which may be minuette wave (v), then subsequent movement above 18.920 would provide price confirmation that minor wave 1 is over because at that stage upwards movement could not be a continuation of minuette wave (iv), so minute wave v and minor wave 1 would have to be over.
I think we just began wave 2 on Tuesday.
I’ll be updating Silver today.
Silver got busted way below the target mentioned… IS it still in w3 of 1? or ready to move up for wave 2