
Downwards movement was not expected. I had expected upwards movement to show an increase in momentum.
Summary: This third wave up should still show a further increase in momentum. The short term target which should be met within a couple of days is 1,245. The mid term target may be met by the end of next week at 1,266.
Click on charts to enlarge.
Main Wave Count
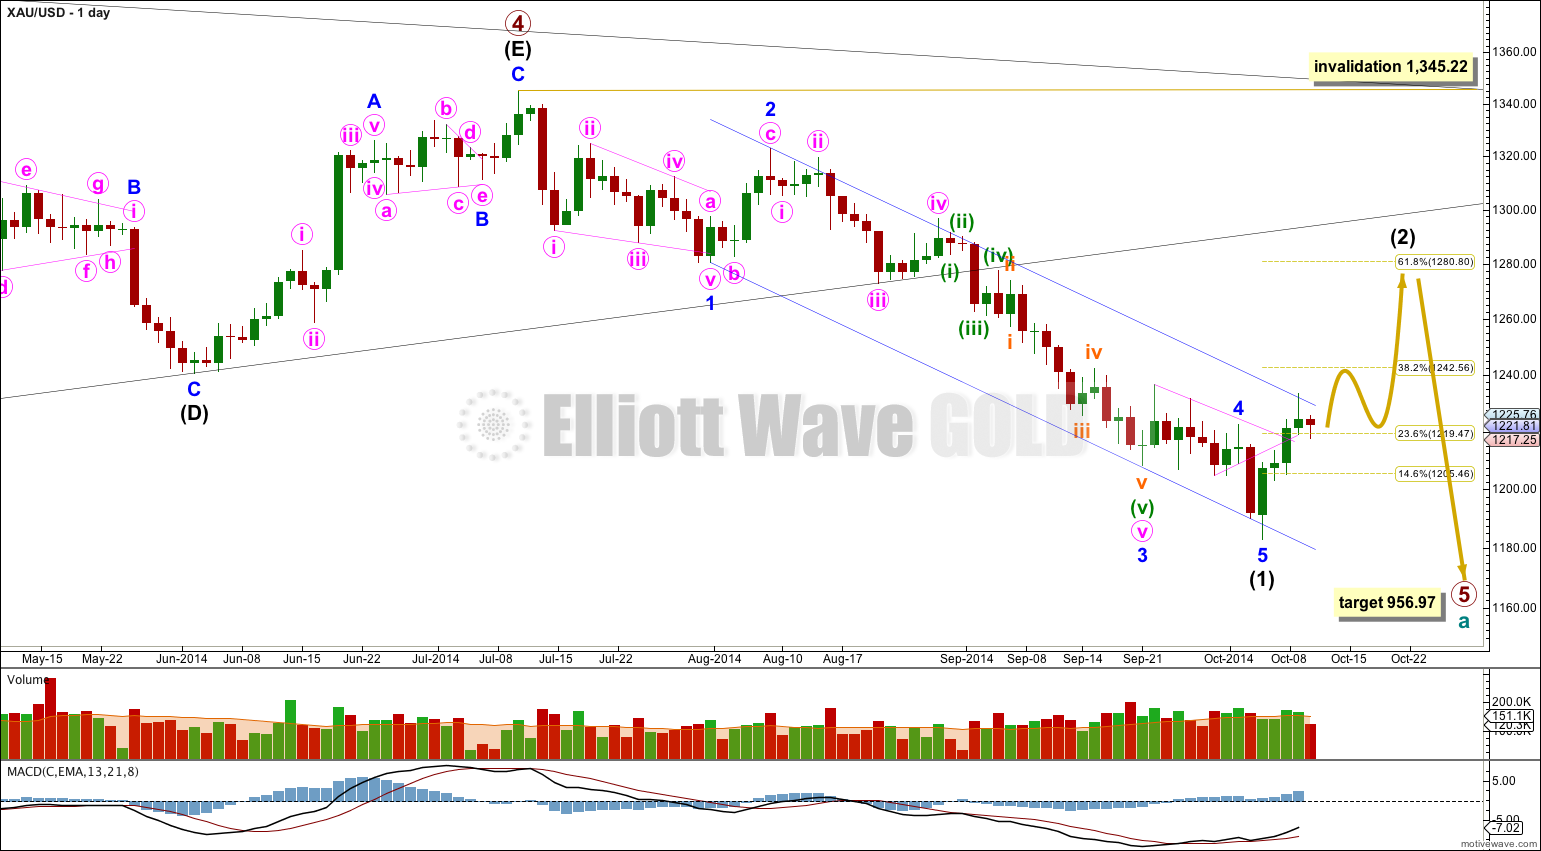
On the weekly chart extend the triangle trend lines of primary wave 4 outwards. The point in time at which they cross over may be the point in time at which primary wave 5 ends. This does not always work, but it works often enough to look out for. It is a rough guideline only and not definitive. A trend line placed from the end of primary wave 4 to the target of primary wave 5 at this point in time shows primary wave 5 would take a total 26 weeks to reach that point, and that is what I will expect. Primary wave 5 is ending its 13th week.
At 956.97 primary wave 5 would reach equality in length with primary wave 1. Primary wave 3 is $12.54 short of 1.618 the length of primary wave 1, and equality between primary waves 5 and 1 would give a perfect Elliott relationship for this downwards movement.
However, when triangles take their time and move close to the apex of the triangle, as primary wave 4 has, the movement following the triangle is often shorter and weaker than expected, and this is my main reason for presenting the alternate wave count to you. If the target at 956.97 is wrong it may be too low. In the first instance I expect it is extremely likely that primary wave 5 will move at least below the end of primary wave 3 at 1,180.40 to avoid a truncation. When intermediate waves (1) through to (4) within primary wave 5 are complete I will recalculate the target at intermediate degree because this would have a higher accuracy. I cannot do that yet; I can only calculate it at primary degree.
Movement comfortably below 1,180.84 would provide further confidence in this main wave count as at that stage an alternate idea which sees primary wave 4 as continuing as a barrier triangle would be invalidated.
Draw a channel about intermediate wave (1): draw the first trend line from the lows labeled minor waves 1 to 3, then place a copy on the high labeled minor wave 2. The slight overshoot of the lower edge of this channel indicates minor wave 5 may be over there. Intermediate wave (2) should breach the upper edge of this channel.
Intermediate wave (2) may end close to a Fibonacci ratio of intermediate wave (1). Only because second waves are more commonly deep than shallow is the 0.618 ratio at 1,280.80 slightly favoured. But it does not have to be this deep. When I know where minor waves A and B within this correction have ended then a target should be calculated using the ratio between minor waves A and C.
Intermediate wave (2) is most likely to be a zigzag, but it may also be one of several other possible corrective structures. While the first 5-3-5 up unfolds no second wave correction nor B wave may move beyond its start below 1,183.06.
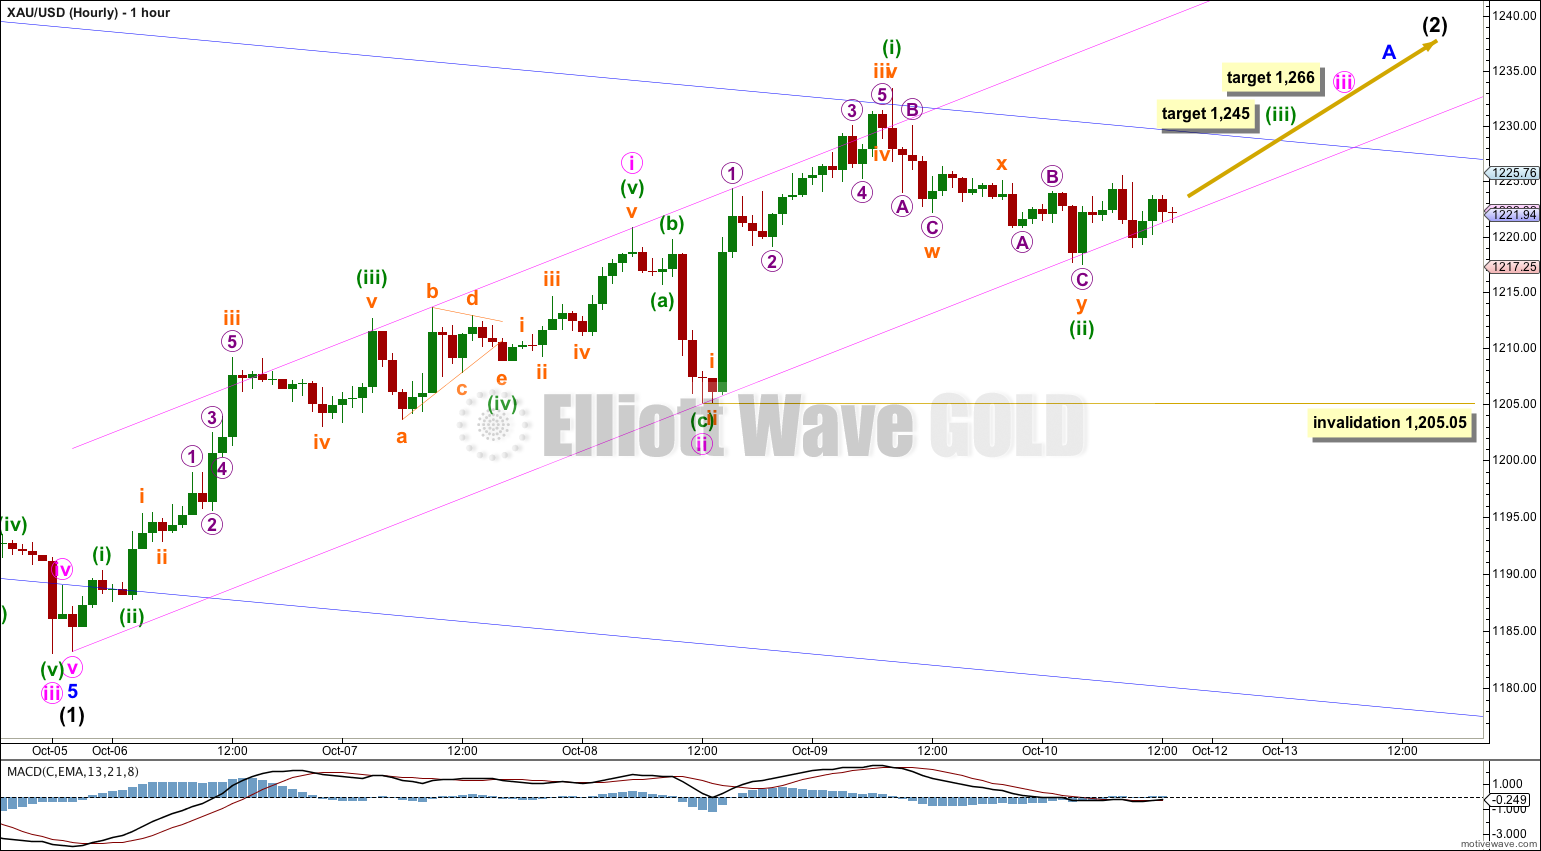
Minute wave iii is still incomplete.
I have considered (and charted) the possibility that upwards movement from the low labeled minute wave ii is actually a continuation of minute wave ii as an expanded flat correction. I had expected to present this idea as an alternate today. But when I try to fit the subdivisions for that idea it quite simply does not work. The upwards wave labeled minuette wave (i) fits as a five wave impulse, but does not fit well as a corrective structure. The downwards wave labeled minuette wave (ii) fits nicely as a double zigzag, but it will not fit at all as a five wave structure. The alternate idea I tried to chart would have to see minuette wave (i) up as a B wave, and minuette wave (ii) down as a first wave within a C wave. I cannot present this idea if it does not fit.
This gives me a little more confidence today that the wave count which I am presenting to you is most likely correct, and minute wave iii is an incomplete impulse. Because minute wave iii is showing its subdivisions now clearly on the daily chart it looks like it will be a typical extended third wave, and so I am recalculating the target. At 1,266 minute wave iii would reach 1.618 the length of minute wave i.
Within minute wave iii at 1,245 minuette wave (iii) would reach equality in length with minuette wave (i). Minuette wave (iii) should show an increase in upwards momentum beyond that seen for minute wave i.
For this wave count the base channel about minute waves i and ii should continue to provide support for corrections along the way up. If this channel is clearly breached by at least one full hourly candlestick below the lower edge, and not touching that trend line, then this wave count would decrease in probability. At that stage the alternate hourly chart below should be seriously considered.
Within minute wave iii minuette wave (ii) may not move beyond the start of minuette wave (i) below 1,205.05.
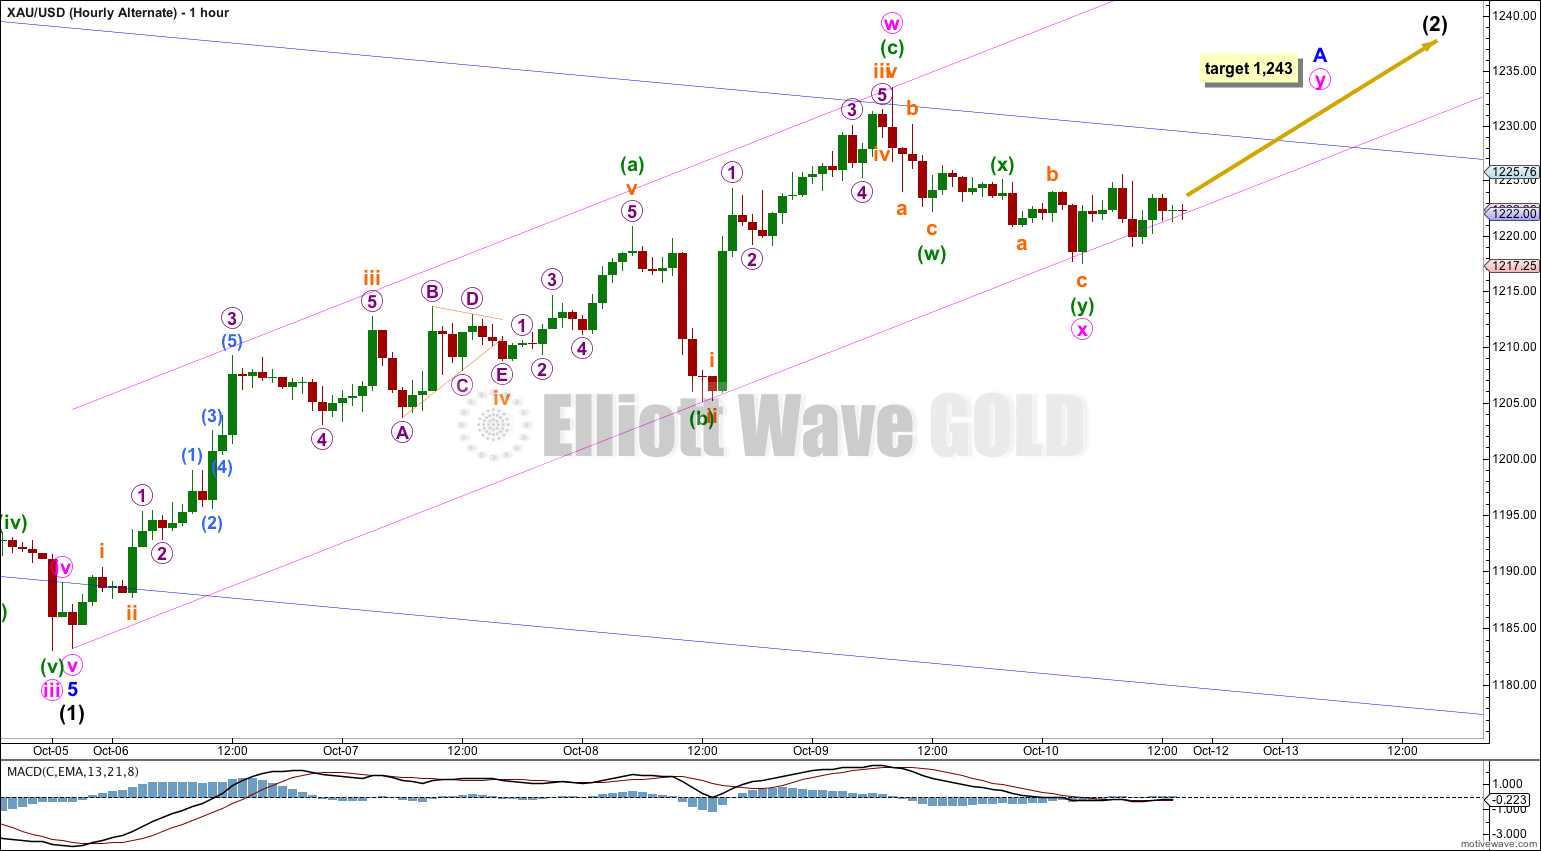
Intermediate wave (2) is most likely to be a single or double zigzag (which is what the main hourly wave count expects to see) but it does not have to be.
Within a zigzag minor wave A should subdivide as a five wave structure.
However, there are other possibilities for intermediate wave (2). It may be a flat or a combination. If it is a flat correction then within it minor wave A may subdivide as a three wave structure (any corrective structure excluding a triangle). This alternate wave count looks at the possibility that minor wave A is an incomplete double zigzag.
Because of the size of an intermediate degree correction I am not yet considering the possibility that minor wave A could already be complete. That would be a remarkably brief minor degree wave.
If minor wave A is a three then so far it only fits as a double zigzag, which is incomplete. This alternate idea expects the same direction next, but it does not have to see an increase in upwards momentum.
The purpose of double zigzags is to deepen the correction when the first zigzag does not move price deep enough. Double zigzags have a clear slope for this reason. Minute wave y should move price comfortably higher than minute wave w. Double zigzags do not normally exhibit Fibonacci ratios to each other. The target at 1,243 is an expectation that minor wave A may end about the 0.382 Fibonacci ratio of intermediate wave (1) only because this is a somewhat common place for A waves of second wave corrections to end.
For this alternate there can be no lower invalidation point. However, because double zigzags should have a clear slope their X waves tend to be brief and shallow. Minute wave x should not move lower.
Alternate Wave Count
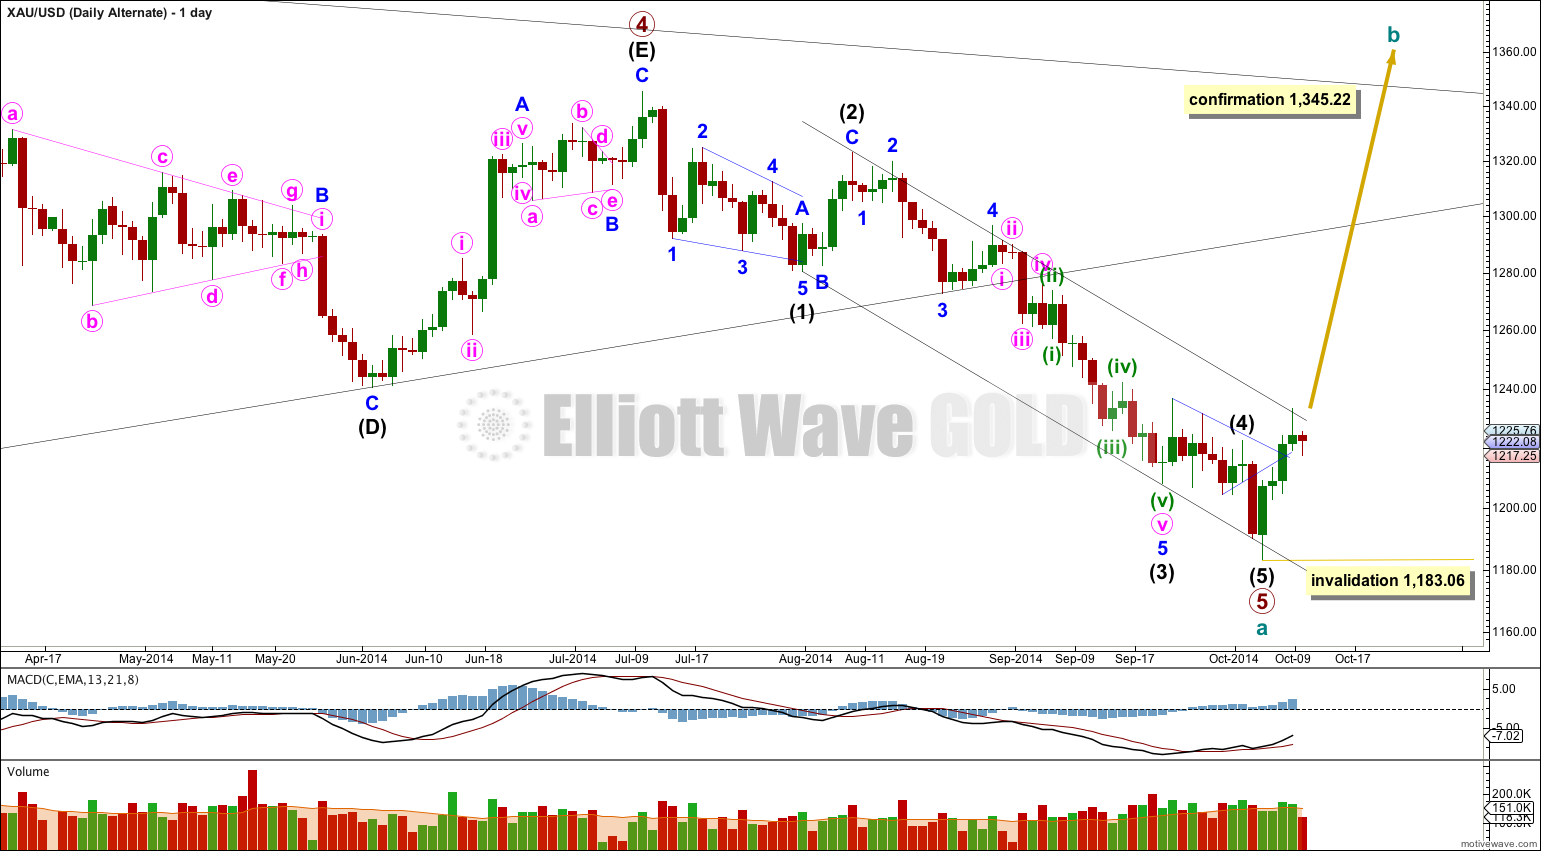
By simply moving the degree of labeling within primary wave 5 downwards all up one degree it is possible that primary wave 5 and so cycle wave a are over.
This wave count is reduced in probability by a small truncation. Primary wave 5 would be truncated by $2.66. The truncation is small though, so this wave count must be considered.
Movements out of triangles are often more brief and weak than expected, sometimes they are surprisingly brief.
If price breaks out of the upper edge of the parallel channel about cycle wave a this would be first indication that this wave count is correct. This trend channel confirmation would come before price confirmation above 1,345.22.
The first movement upwards for cycle wave b should be a five wave structure. Within it no second wave correction may move beyond the start of its first wave below 1,183.06.
Movement above 1,345.22 would invalidate the main wave count and so confirm this alternate.
* Note 1: this idea also works for Silver and GDX, and there it works without any truncation. I will update Silver and GDX with this alternate idea next time I publish analysis of those markets.
* Note 2: It is still possible that primary wave 4 is an incomplete barrier triangle. Although this is a technical possibility, on the weekly chart it looks wrong. The lack of proportion between primary waves 2 and 4 is my main reason for not charting this possibility for you at this time.
This analysis is published about 03:38 p.m. EST.
Hello Lara,
Is that possible that the current correction is not intermediate wave 2 but intermediate wave 4?
I guess it’s possible… but the subdivisions for intermediate (3) would be problematic, and intermediate wave (2) would be where minor wave 2 was, and it lasted only five days. So far intermediate wave (4) is just beginning its sixth day…. it would be disproportionate.
So possible, but I think it has a very low probability. Movement above 1,280.35 would invalidate the idea.