
Today the situation is remarkably unclear, even after about two weeks of confidence with this second Elliott wave correction. I have three scenarios for you today.
Summary: It is most likely that this second wave correction is incomplete. If price breaks above 1,255.40 the target for upwards movement to end is 1,277 – 1,281. But if price breaks below 1,231.78 the minimum target for downwards movement is 1,190.04.
Click on charts to enlarge.
Main Wave Count
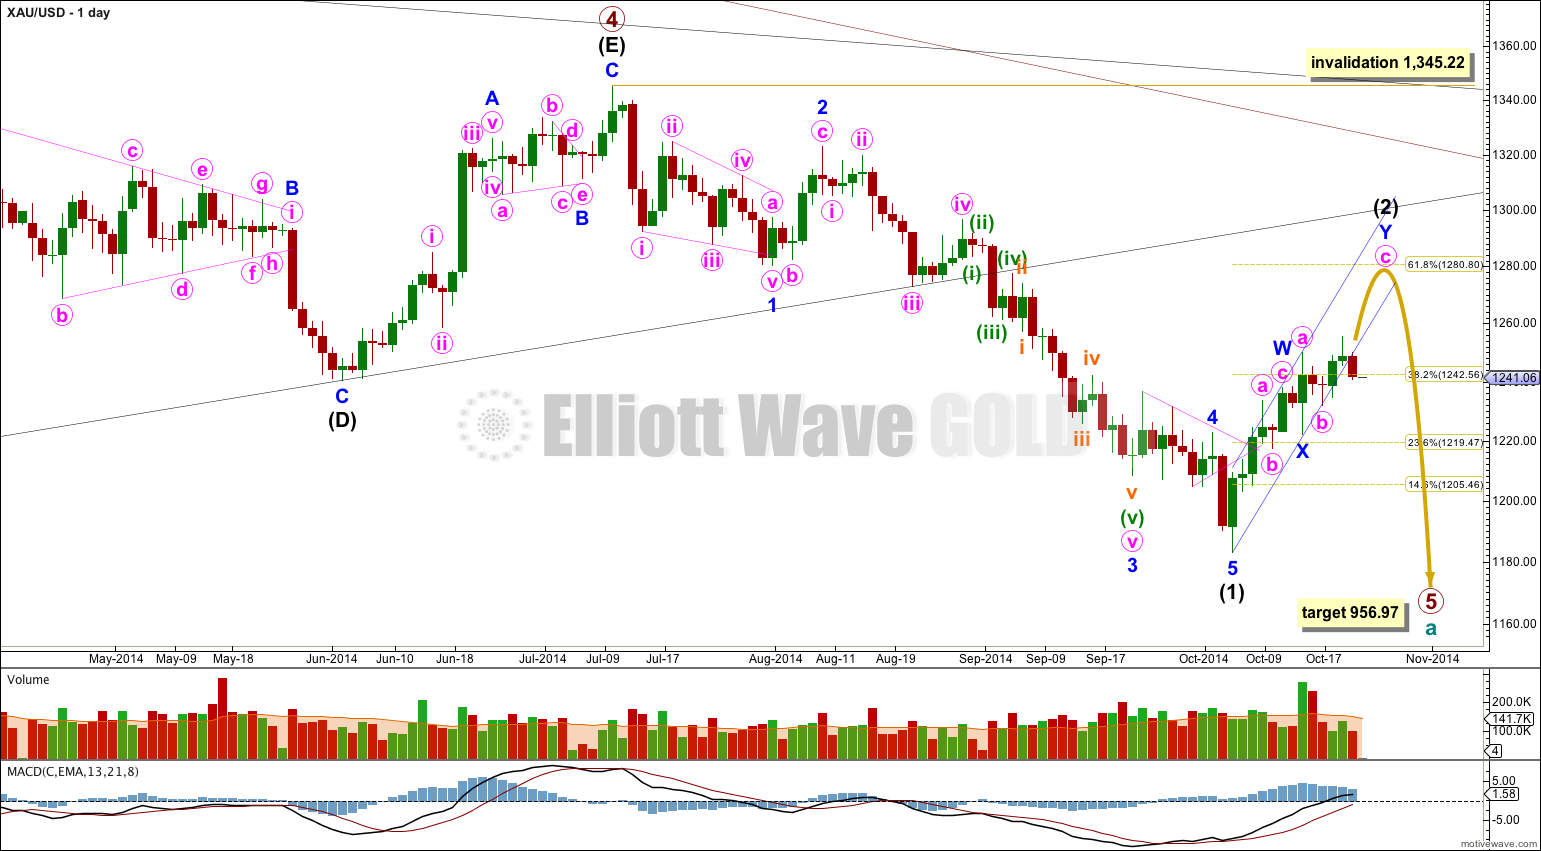
On the weekly chart extend the triangle trend lines of primary wave 4 outwards. The point in time at which they cross over may be the point in time at which primary wave 5 ends. This does not always work, but it works often enough to look out for. It is a rough guideline only and not definitive. A trend line placed from the end of primary wave 4 to the target of primary wave 5 at this point in time shows primary wave 5 would take a total 26 weeks to reach that point, and that is what I will expect. Primary wave 5 is in its 15th week.
At 956.97 primary wave 5 would reach equality in length with primary wave 1. Primary wave 3 is $12.54 short of 1.618 the length of primary wave 1, and equality between primary waves 5 and 1 would give a perfect Elliott relationship for this downwards movement.
However, when triangles take their time and move close to the apex of the triangle, as primary wave 4 has, the movement following the triangle is often shorter and weaker than expected, and this is my main reason for presenting the alternate wave count to you. If the target at 956.97 is wrong it may be too low. In the first instance I expect it is extremely likely that primary wave 5 will move at least below the end of primary wave 3 at 1,180.40 to avoid a truncation. When intermediate waves (1) through to (4) within primary wave 5 are complete I will recalculate the target at intermediate degree because this would have a higher accuracy, and the target may move higher. I cannot do that yet; I can only calculate it at primary degree.
Movement comfortably below 1,180.84 would provide further confidence in this main wave count as at that stage an alternate idea which sees primary wave 4 as continuing as a barrier triangle would be invalidated. I am not publishing this alternate idea as a chart because it has an extremely low probability.
Draw a best fit channel about intermediate wave (2) on daily and hourly charts: draw the first trend line from the start of intermediate wave (2) to the low labeled minor wave X, then place a parallel copy on the high of minor wave W. I would expect intermediate wave (2) to remain within this channel. When this small channel is clearly breached by downwards movement with a full daily candlestick below it and not touching the lower trend line that shall provide trend channel confirmation that intermediate wave (2) is over and intermediate wave (3) should be underway.
Within intermediate wave (2) minor wave W lasted a Fibonacci 5 days. So far minor wave Y has lasted 4 days. If it completes in a further 4 days it will total a Fibonacci 8 days, and have a 1.618 duration of minor wave W.
Intermediate wave (2) may end close to a Fibonacci ratio of intermediate wave (1). Only because second waves are more commonly deep than shallow is the 0.618 ratio at 1,280.80 slightly favoured. But it does not have to be this deep.
The channel about intermediate wave (2) is clearly breached on the hourly chart. This may be an indication that intermediate wave (2) is over and I have an alternate wave count for this idea. However, it is more likely that only minor wave A within intermediate wave (2) is over because I would expect intermediate wave (2) to last longer than 11 days so that it is better in proportion to intermediate wave (1) which lasted 62 days.
It is also still possible that intermediate wave (2) is unfolding as a double zigzag and will move higher for a few days.
Double Zigzag
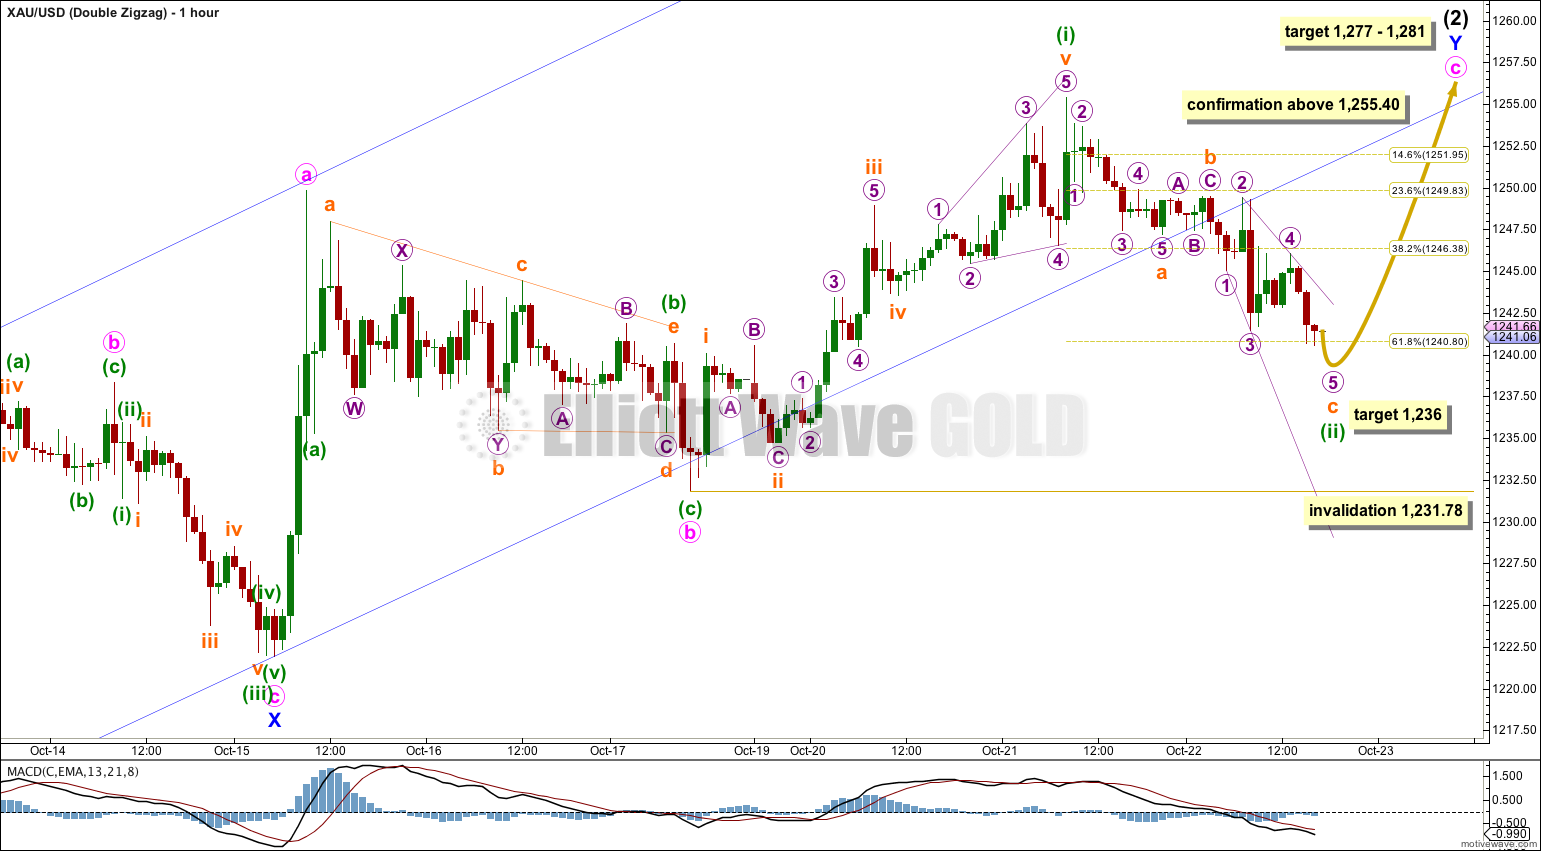
It is still possible that intermediate wave (2) is an incomplete double zigzag. The second zigzag in the double would most likely be incomplete. At 1,277 minute wave c would reach 1.618 the length of minute wave a. This is just $4 below the 0.618 Fibonacci ratio of intermediate wave (1) at 1,281.
So far within minuette wave (ii) the expanding ending diagonal for submineutte wave c is incomplete. Price should move a little lower before it is done. At 1,236 subminuette wave c would reach 1.618 the length of subminuette wave a, and the expanding diagonal would have a fifth wave which is longer than its third wave.
Minuette wave (ii) may not move beyond the start of minuette wave (i) below 1,231.78.
The problem today with this wave count is it is not fitting within trend channels. Downwards movement has breached the channel held for the prior 11 days, indicating a trend change. For this reason I am considering again a flat correction for intermediate wave (2).
Flat
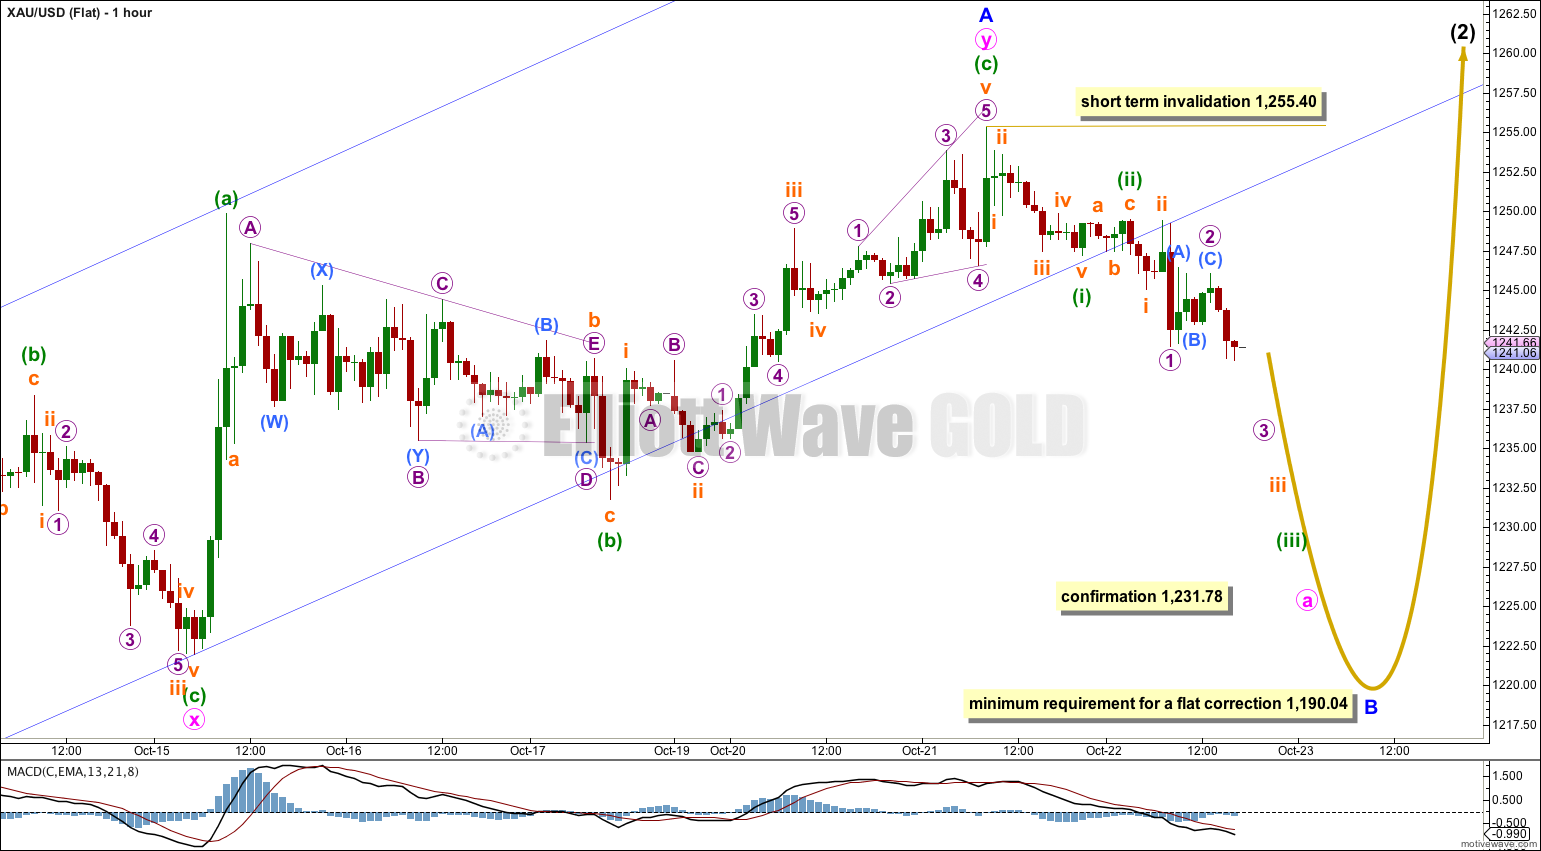
The subdivisions on this wave count for upwards movement labeled minor wave A are exactly the same as for the double zigzag wave count. I have simply moved it all down one degree.
Upwards movement to 1,255.40 subdivides as a complete double zigzag. Because it lasted only 11 days and is only 45% of intermediate wave (1) it is very unlikely that this is an end for intermediate wave (2). It would be too brief and too shallow. What is more likely is this is just minor wave A within a flat correction for intermediate wave (2).
Within a flat correction minor wave A must subdivide as a “three” and a double zigzag is classed as a “three”.
Within a flat correction minor wave B must reach a minimum 90% length of minor wave A at 1,190.04. The most common type of flat is an expanded flat in which minor wave B would make a new low below the start of minor wave A at 1,183.06. An expanded flat requires minor wave B to be a minimum 105% of minor wave A at 1,179.61.
If my analysis of upwards movement for minor wave A as a double zigzag is correct then intermediate wave (2) may not be unfolding as a combination. Within a combination minor waves W, Y (and if there is one Z) may only themselves subdivide as simple A-B-C structures (or A-B-C-D-E triangles), and they may not be combinations themselves. This is because the maximum number of corrective structures within a multiple is three. To see multiples within multiples expands the number of corrective structures beyond three and is invalid. (Note: this is one of the most common mistakes made by those not proficient with Elliott wave.)
What this means is we may draw the conclusion that if 1,231.78 is breached then a substantial amount of downwards movement is required, to at least 1,190.04 and maybe a new low.
Overall this wave count expects intermediate wave (2) is not yet halfway through.
Within minor wave B no second wave correction may move beyond its start above 1,255.40 at this stage. Minor wave B is most likely to be a simple zigzag, but it may be any corrective structure.
Alternate Hourly Wave Count
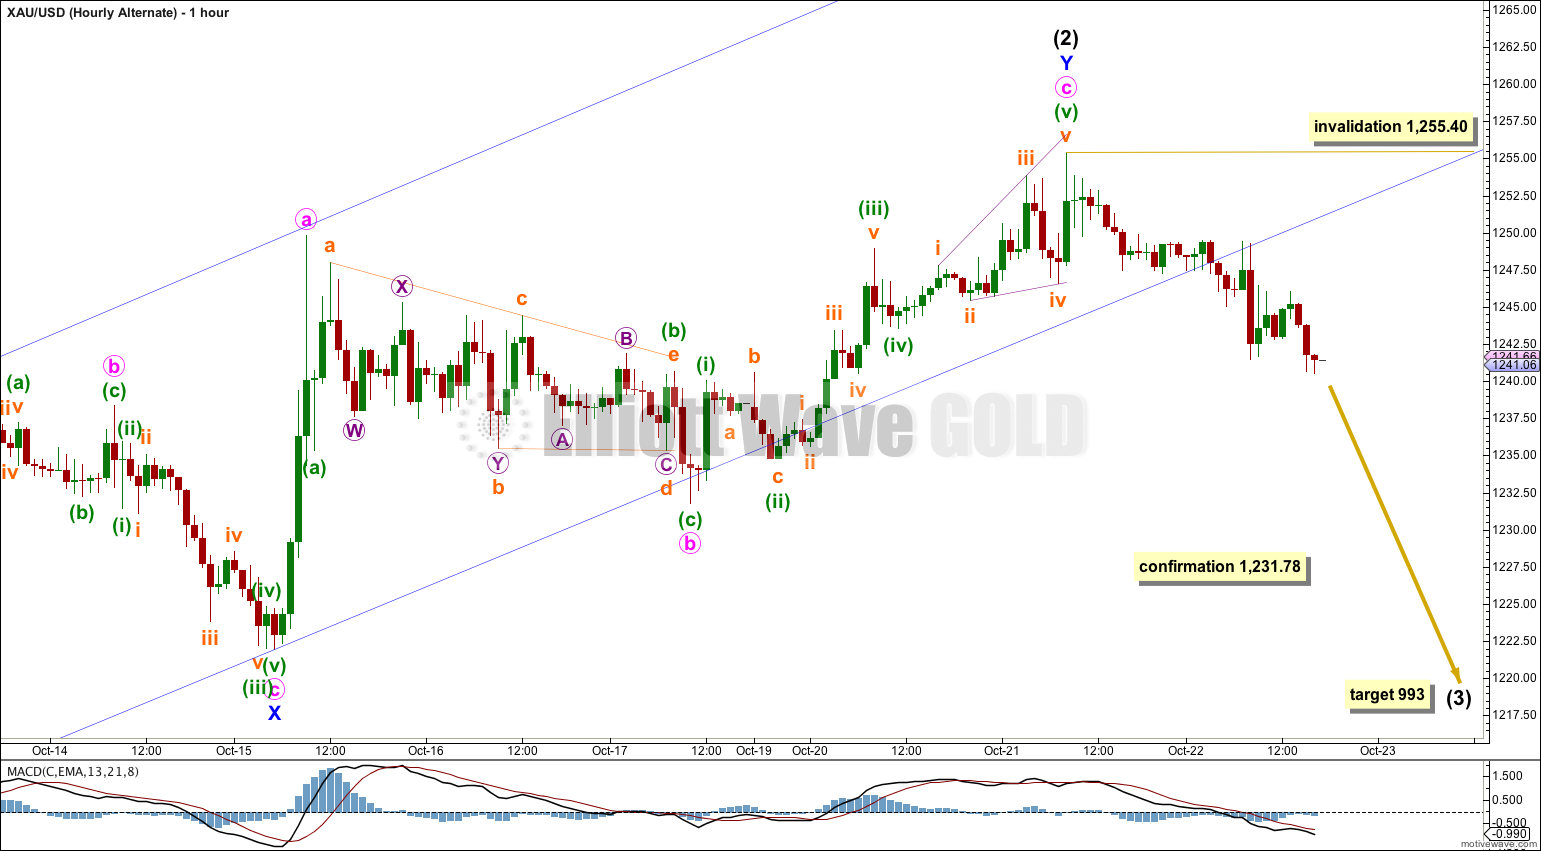
It is possible that the double zigzag is a completion of intermediate wave (2), but this idea has a very low probability.
This would see intermediate wave (2) only 45% of intermediate wave (1), but more importantly it would have lasted only 11 days in comparison to the 62 days for intermediate wave (1). This is too brief to give the wave count the “right look” on the daily chart.
This alternate also expects downwards movement. If price moves below 1,231.78 then only careful attention to structure (is it a three or a five?) of the next wave down would tell if this alternate is correct or if intermediate wave (2) is continuing as a flat correction.
At 993 intermediate wave (3) would reach 1.618 the length of intermediate wave (1).
Alternate Wave Count
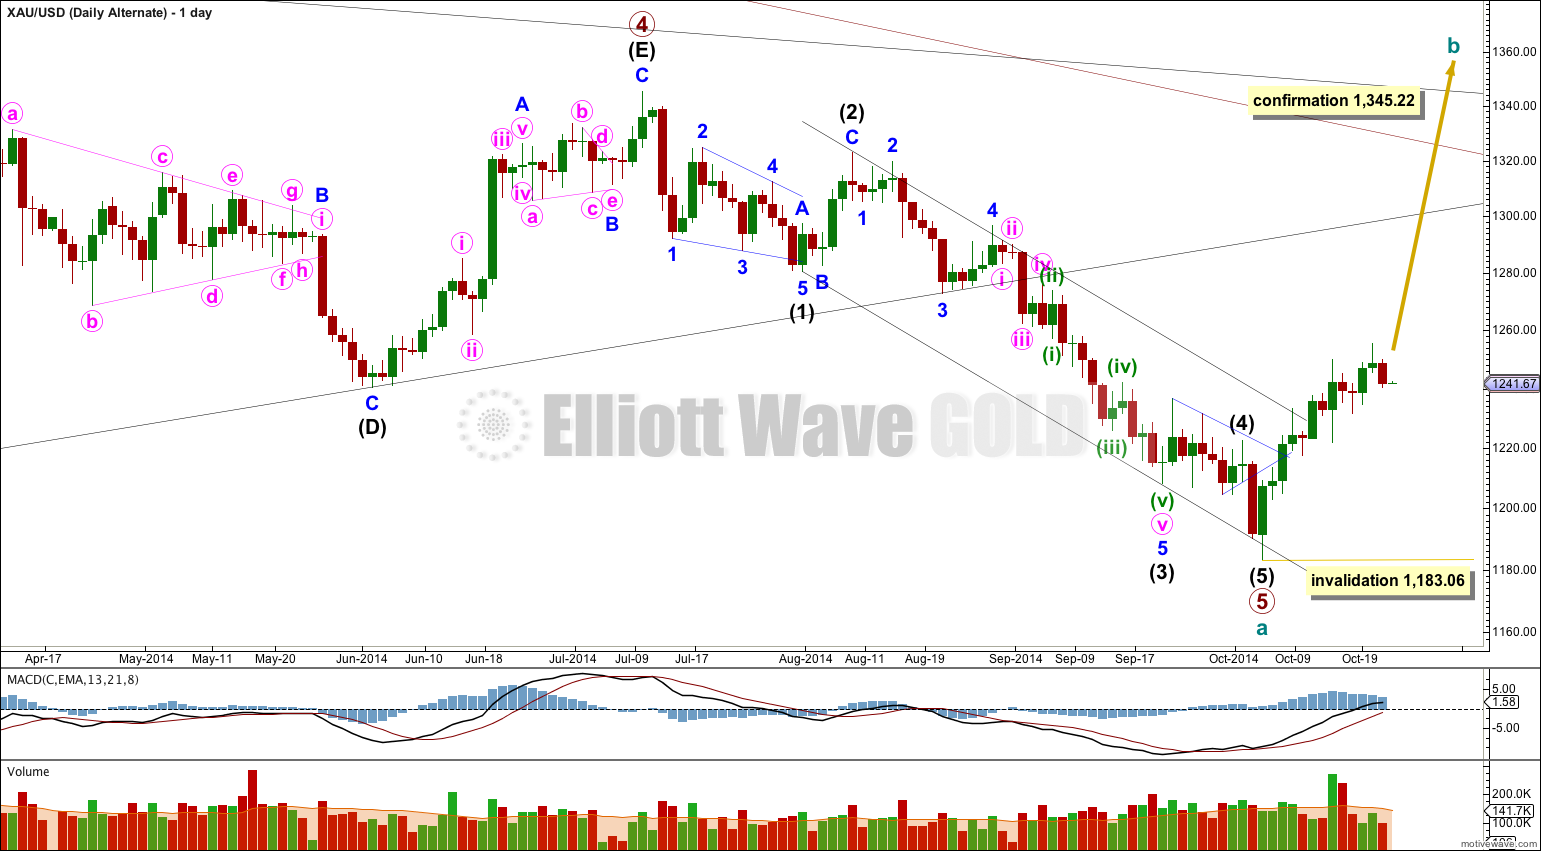
By simply moving the degree of labeling within primary wave 5 downwards all up one degree it is possible that primary wave 5 and so cycle wave a are over.
This wave count is reduced in probability by a small truncation. Primary wave 5 would be truncated by $2.66. The truncation is small though, so this wave count must be considered.
Movements out of triangles are often more brief and weak than expected, sometimes they are surprisingly brief. There is a nice example of what I mean by this here on the daily chart: after the triangle of intermediate wave (4) we saw a surprisingly quick short intermediate wave (5) down afterwards.
If price breaks out of the upper edge of the parallel channel about cycle wave a (look to the weekly chart for this channel) this would be first indication that this wave count is correct. This trend channel confirmation would come before price confirmation above 1,345.22.
The first movement upwards for cycle wave b should be a five wave structure. Within it no second wave correction may move beyond the start of its first wave below 1,183.06.
Movement above 1,345.22 would invalidate the main wave count and confirm this alternate.
At this stage upwards movement is not looking like an unfolding impulse because it is too choppy and overlapping, and so this alternate wave count is further reduced in probability.
This analysis is published about 06:35 p.m. EST.
The market has answered your question.
I now expect downwards movement to 1,190.04 or below.
I think we’re looking at the flat correction for intermediate wave (2).
I expect now downwards movement to a minimum 1,190.04, maybe to a new low, for a B wave.
Hi Lara, Any chance for a GDX update? Thanks, and best regards.
There’s no surf today so your chances are looking good 🙂
Lara we seem to be bogged down between 1240 and 1250 with no prevailing trend yet. Any comment before markets open tonight would be appreciated as like many im in 2 minds do I hold or do I sell (nugts).
Lara
Shouldn’t your 3rd hourly alternative – finished intermediate Wave 2, be presented in an alternative Daily, rather than in the same Daily? It’s a bit confusing otherwise.
Yes, it should. That would be clearer, wouldn’t it!
Will do today.