
Movement below 1,231.78 has clarified the situation.
Summary: Intermediate wave (2) is unfolding as a big flat correction.
I expect more downwards movement for a few days to at least 1,190.04. It is possible we may see a new low below 1,183.06.
Click on charts to enlarge.
Main Wave Count
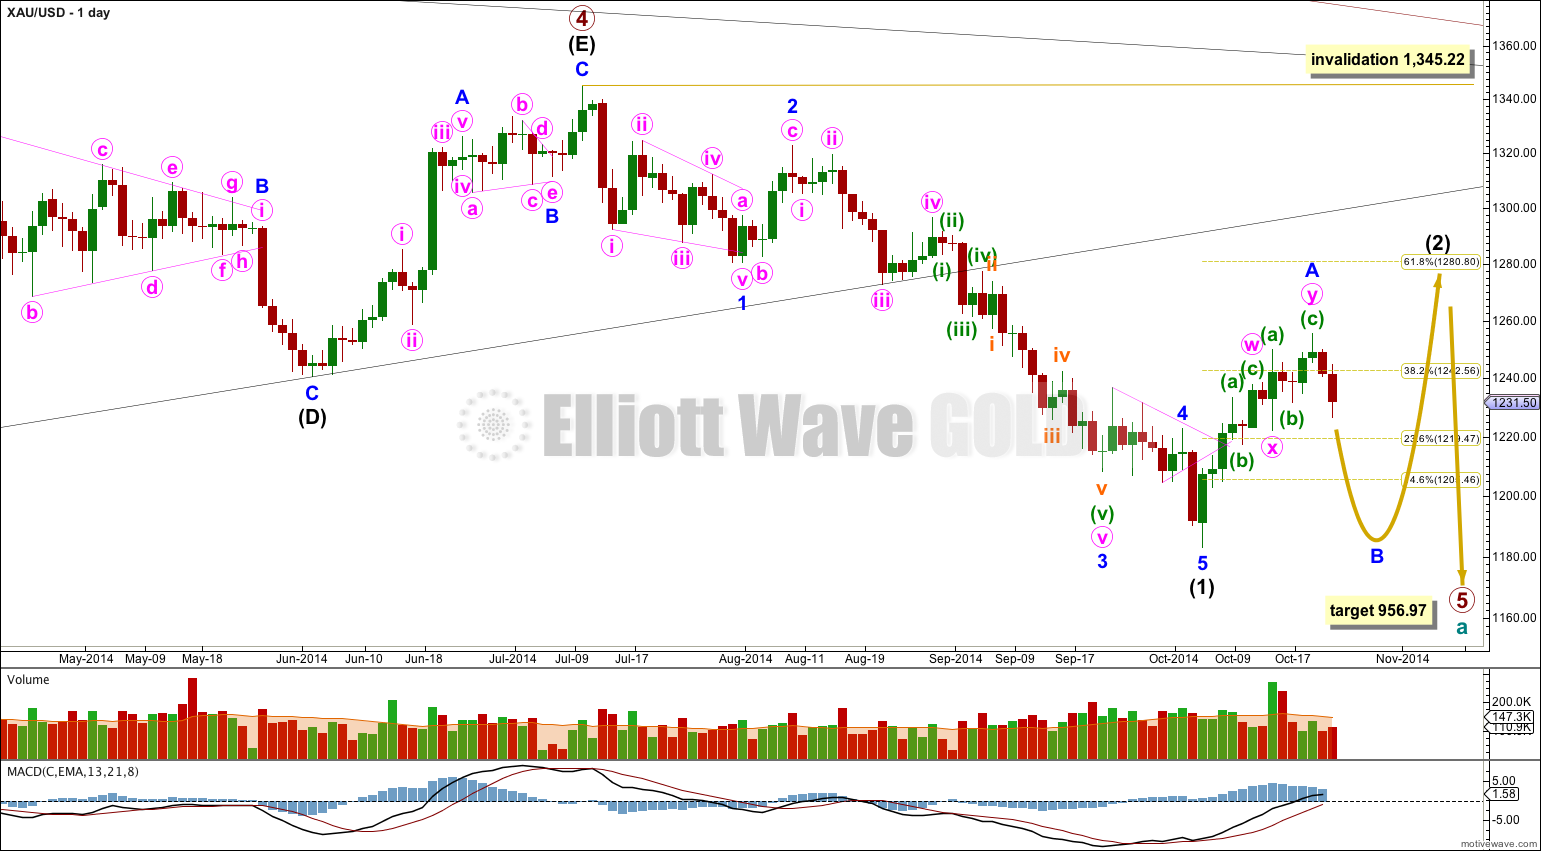
On the weekly chart extend the triangle trend lines of primary wave 4 outwards. The point in time at which they cross over may be the point in time at which primary wave 5 ends. This does not always work, but it works often enough to look out for. It is a rough guideline only and not definitive. A trend line placed from the end of primary wave 4 to the target of primary wave 5 at this point in time shows primary wave 5 would take a total 26 weeks to reach that point, and that is what I will expect. Primary wave 5 is in its 15th week.
At 956.97 primary wave 5 would reach equality in length with primary wave 1. Primary wave 3 is $12.54 short of 1.618 the length of primary wave 1, and equality between primary waves 5 and 1 would give a perfect Elliott relationship for this downwards movement.
However, when triangles take their time and move close to the apex of the triangle, as primary wave 4 has, the movement following the triangle is often shorter and weaker than expected, and this is my main reason for presenting the alternate wave count to you. If the target at 956.97 is wrong it may be too low. In the first instance I expect it is extremely likely that primary wave 5 will move at least below the end of primary wave 3 at 1,180.40 to avoid a truncation. When intermediate waves (1) through to (4) within primary wave 5 are complete I will recalculate the target at intermediate degree because this would have a higher accuracy, and the target may move higher. I cannot do that yet; I can only calculate it at primary degree.
Movement comfortably below 1,180.84 would provide further confidence in this main wave count as at that stage an alternate idea which sees primary wave 4 as continuing as a barrier triangle would be invalidated. I am not publishing this alternate idea as a chart because it has an extremely low probability.
Intermediate wave (2) may end close to a Fibonacci ratio of intermediate wave (1). Only because second waves are more commonly deep than shallow is the 0.618 ratio at 1,280.80 slightly favoured. But it does not have to be this deep. When we know where minor wave B has ended then I can calculate a target for intermediate wave (2) to end.
Intermediate wave (1) lasted 62 days. For the wave count to have the right look intermediate wave (2) should continue for longer than it has so far. Intermediate wave (2) is unfolding as a flat correction, subdividing 3-3-5. Within it minor wave B downwards must subdivide as a three, and may make a new low below the start of minor wave A at 1,183.06 as in an expanded flat. Minor wave A lasted 11 days, and I would expect minor wave B to be at least 11 days and maybe longer as B waves tend to be more time consuming structures.
Because upwards movement for minor wave A has a perfect fit as a double zigzag we can rule out the possibility that intermediate wave (2) is unfolding as a combination. Within a combination the maximum number of corrective structures is three, and so each correction within a combination labeled W, Y (and Z) may only subdivide themselves as simple A-B-C corrections (or A-B-C-D-E triangles), they may not subdivide as W-X-Y.
Because minor wave A upwards is a corrective three wave structure this indicates intermediate wave (2) is a flat correction. Within a flat minor wave B must reach a minimum 90% length of minor wave A at 1,190.04.
The depth of minor wave B will indicate what type of flat is unfolding. If it ends between 90% to 104% of minor wave A then a regular flat may be unfolding, which would expect minor wave C to be about the same length of minor wave A. If it is 105% or longer this would indicate an expanded flat is unfolding and minor wave C would be likely to be 1.618 or 2.618 the length of minor wave A.
The most common length for minor wave B within a flat is between 100% to 138% the length of minor wave A, between 1,183.22 and 1,155.79.
Minor wave B downwards must subdivide as a three. It is most likely to be a zigzag, but there are more than thirteen possible corrective structures it may take (triangles are possible but unlikely). B waves are the most difficult of all Elliott wave structures to analyse because they exhibit the greatest variety in form and duration. They can be excessively complicated and time consuming, or sometimes they can be quick simple zigzags. It is impossible at this early stage to tell which structure minor wave B may take. The wave count over the next few days for the hourly chart will have to look at alternates and it may change.
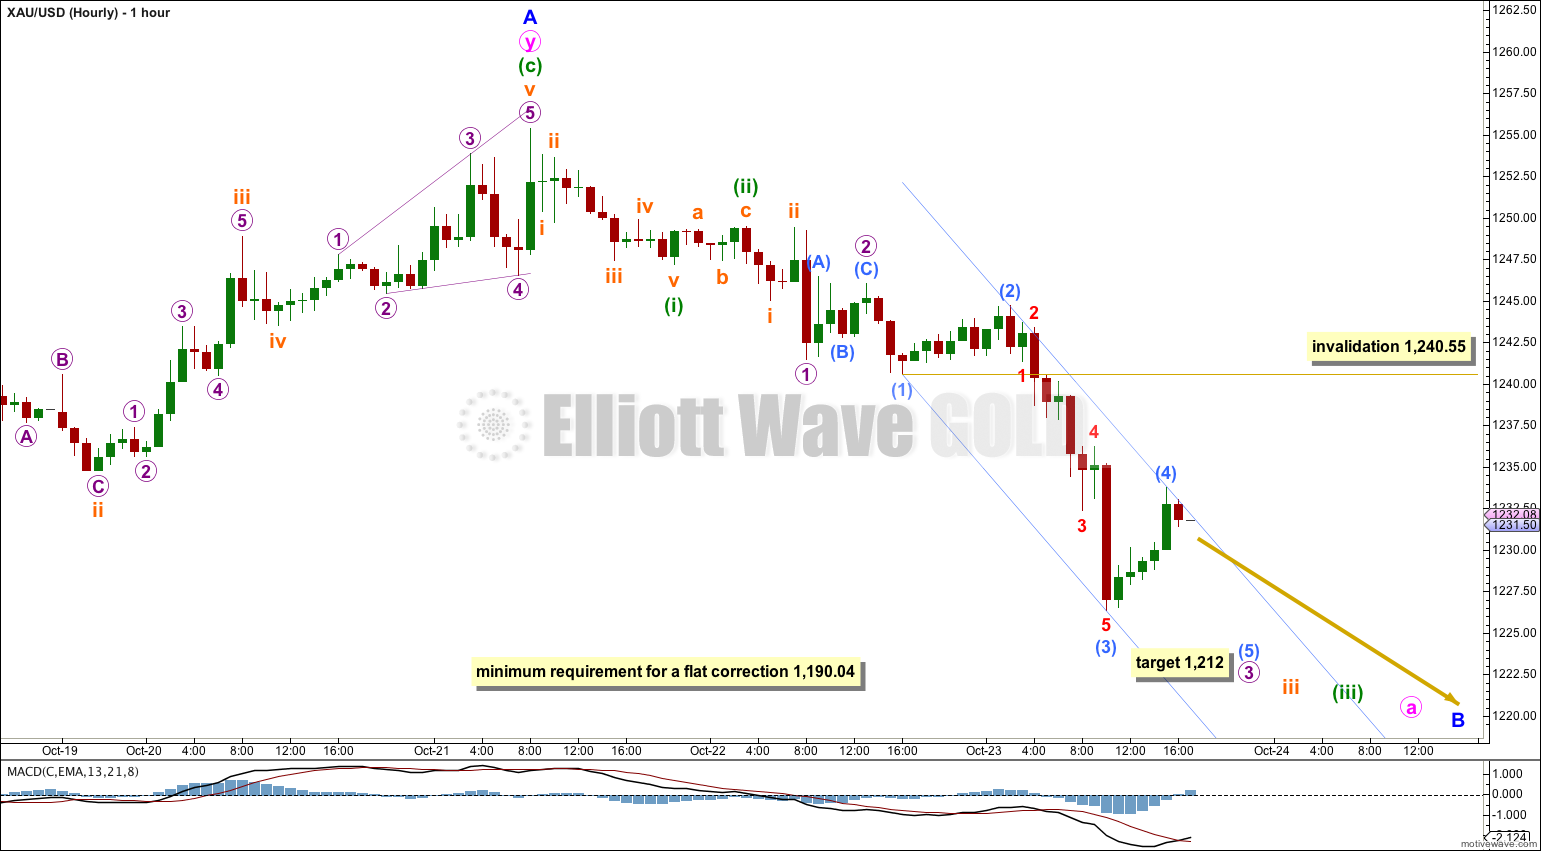
In the short term it looks like an impulse is unfolding downwards. At 1,212 micro wave 3 would reach 4.236 the length of micro wave 1.
Draw a parallel channel about this downwards movement; draw the first trend line from the lows labeled submicro waves (1) to (3), then place a parallel copy on the high of submicro wave (2). So far the upper trend line is showing where price is finding resistance. If it continues to do so I will have confidence in the short term target.
Submicro wave (4) may not move into submicro wave (1) price territory above 1,240.55.
Alternate Wave Count I
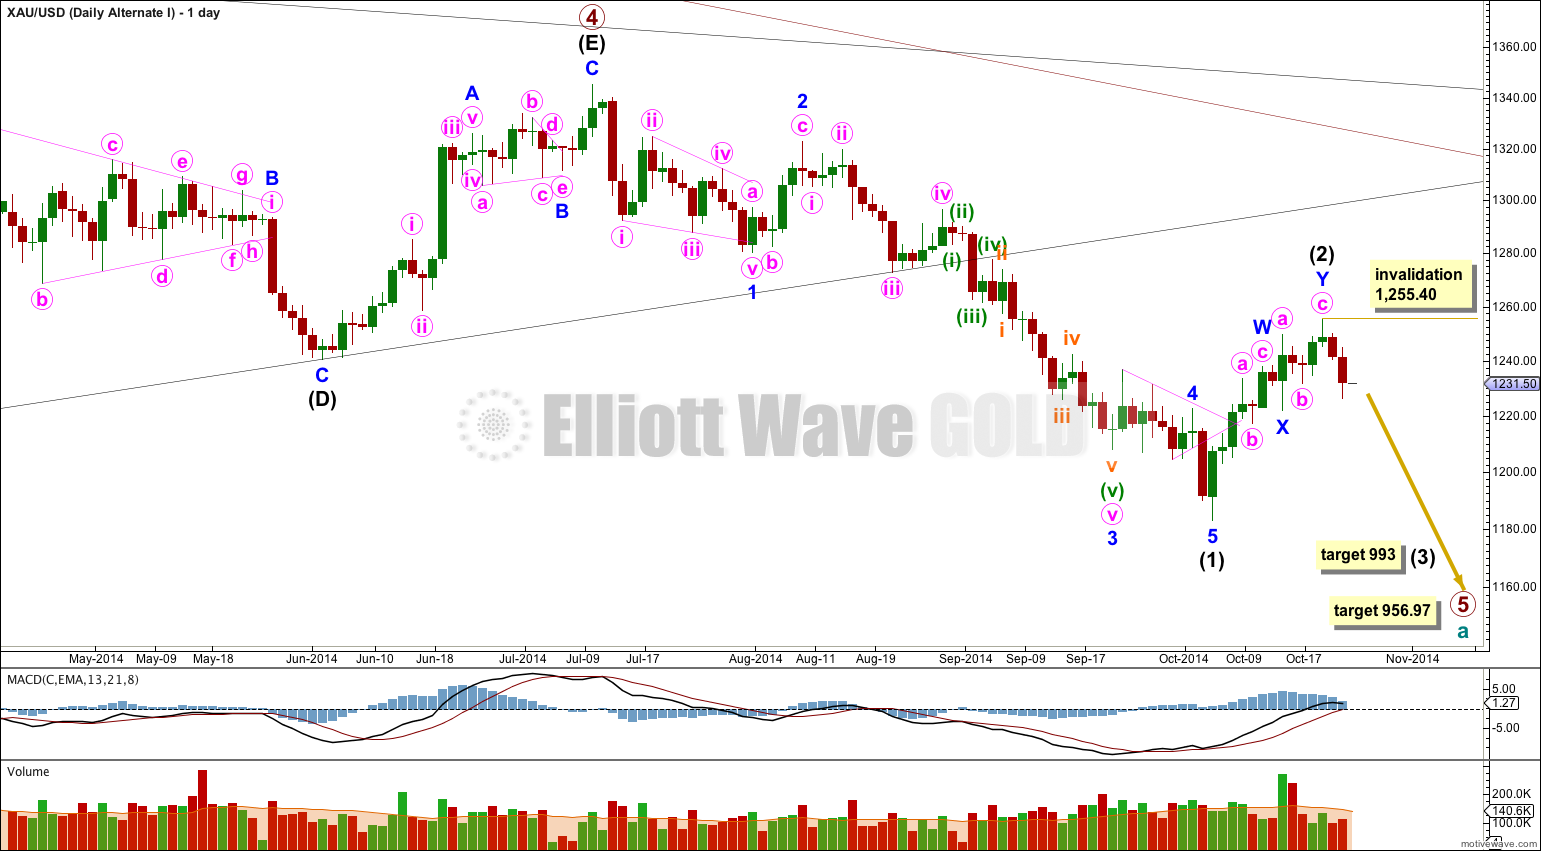
It is possible that the double zigzag is a completion of intermediate wave (2), but this idea has a very low probability.
This would see intermediate wave (2) only 45% of intermediate wave (1), but more importantly it would have lasted only 11 days in comparison to the 62 days for intermediate wave (1). This is too brief to give the wave count the “right look” on the daily chart.
This alternate also expects downwards movement. If price moves below 1,231.78 then only careful attention to structure (is it a three or a five?) of the next wave down would tell if this alternate is correct or if intermediate wave (2) is continuing as a flat correction.
At 993 intermediate wave (3) would reach 1.618 the length of intermediate wave (1).
Alternate Wave Count II
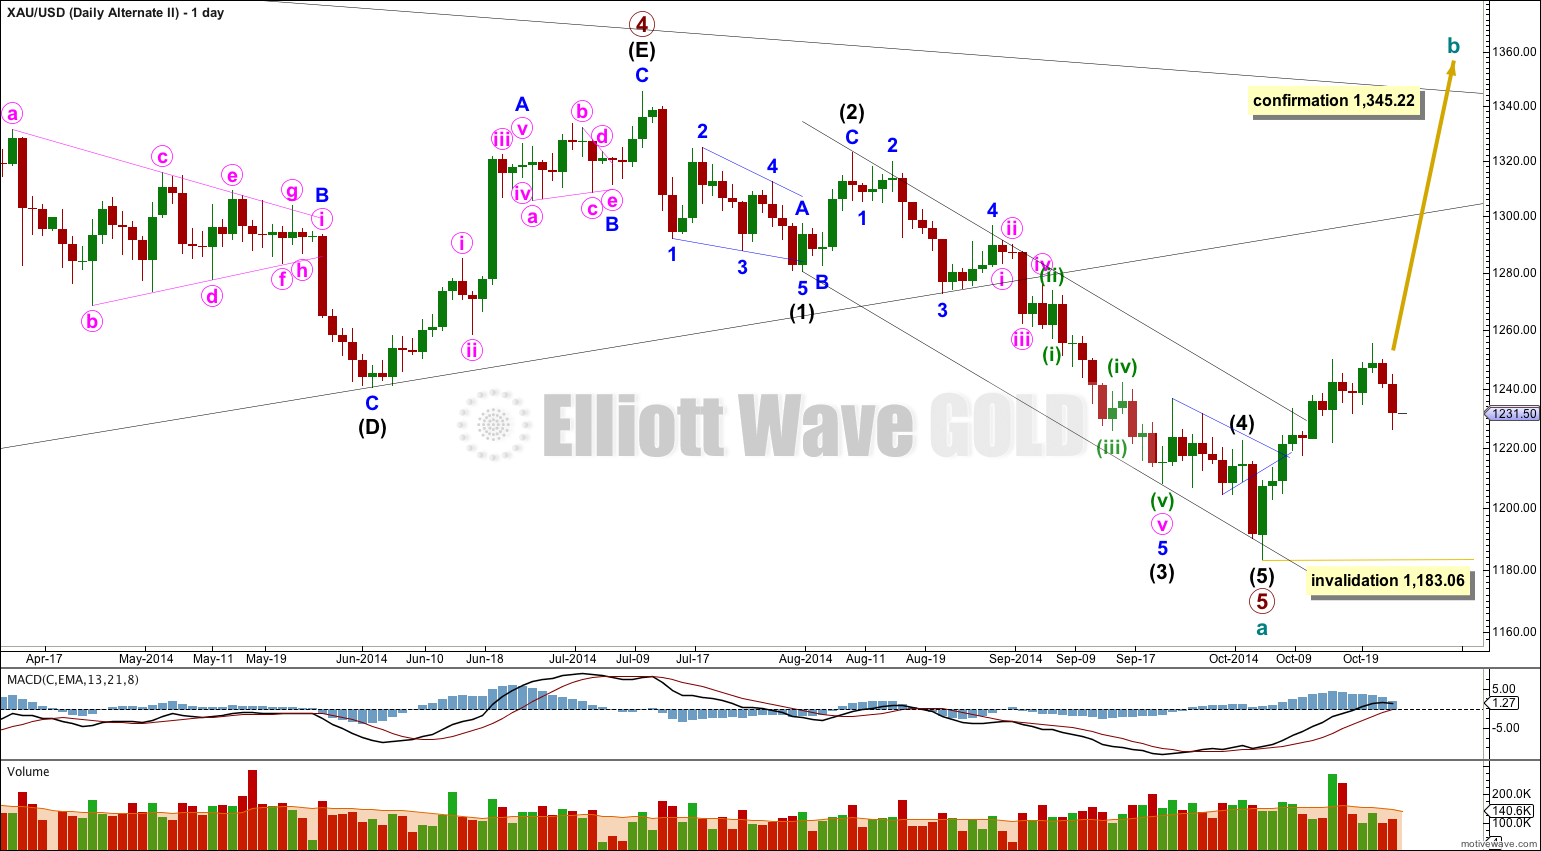
By simply moving the degree of labeling within primary wave 5 downwards all up one degree it is possible that primary wave 5 and so cycle wave a are over.
This wave count is reduced in probability by a small truncation. Primary wave 5 would be truncated by $2.66. The truncation is small though, so this wave count must be considered.
Movements out of triangles are often more brief and weak than expected, sometimes they are surprisingly brief. There is a nice example of what I mean by this here on the daily chart: after the triangle of intermediate wave (4) we saw a surprisingly quick short intermediate wave (5) down afterwards.
If price breaks out of the upper edge of the parallel channel about cycle wave a (look to the weekly chart for this channel) this would be first indication that this wave count is correct. This trend channel confirmation would come before price confirmation above 1,345.22.
The first movement upwards for cycle wave b should be a five wave structure. Within it no second wave correction may move beyond the start of its first wave below 1,183.06.
Movement above 1,345.22 would invalidate the main wave count and confirm this alternate.
At this stage upwards movement is not looking like an unfolding impulse because it is too choppy and overlapping, and so this alternate wave count is further reduced in probability.
This analysis is published about 06:12 p.m. EST.
Hello Lara,
What do you think about this count for the current correction?
This count sees the intermediate wave 2 to touch BD line of the broken triangle at 1298-1300 before turning down and to last around 21-26 days.
Thanks in advance.
You would have to see wave W as a zigzag. That’s the only way that count would work.
So you have to look at the subdivisions carefully for that on the hourly chart.
Hi Lara,
As a general comment,
There’s Ebola outbreak in NY and as I’m typing, Gold inching higher.
Alternate count could be in effect.
Thx