
Sideways movement for all three hourly Elliott wave counts was expected. This correction may still be either a triangle, a flat or a combination.
Summary: The correction could be very close to completion if it is a triangle, or it could still be two or three days away from completion if it is a flat or a combination. If price does not break above 1,222.64 and does break below 1,204.61 the correction should be over and minor wave 5 down should have begun.
Click on charts to enlarge.
Main Wave Count
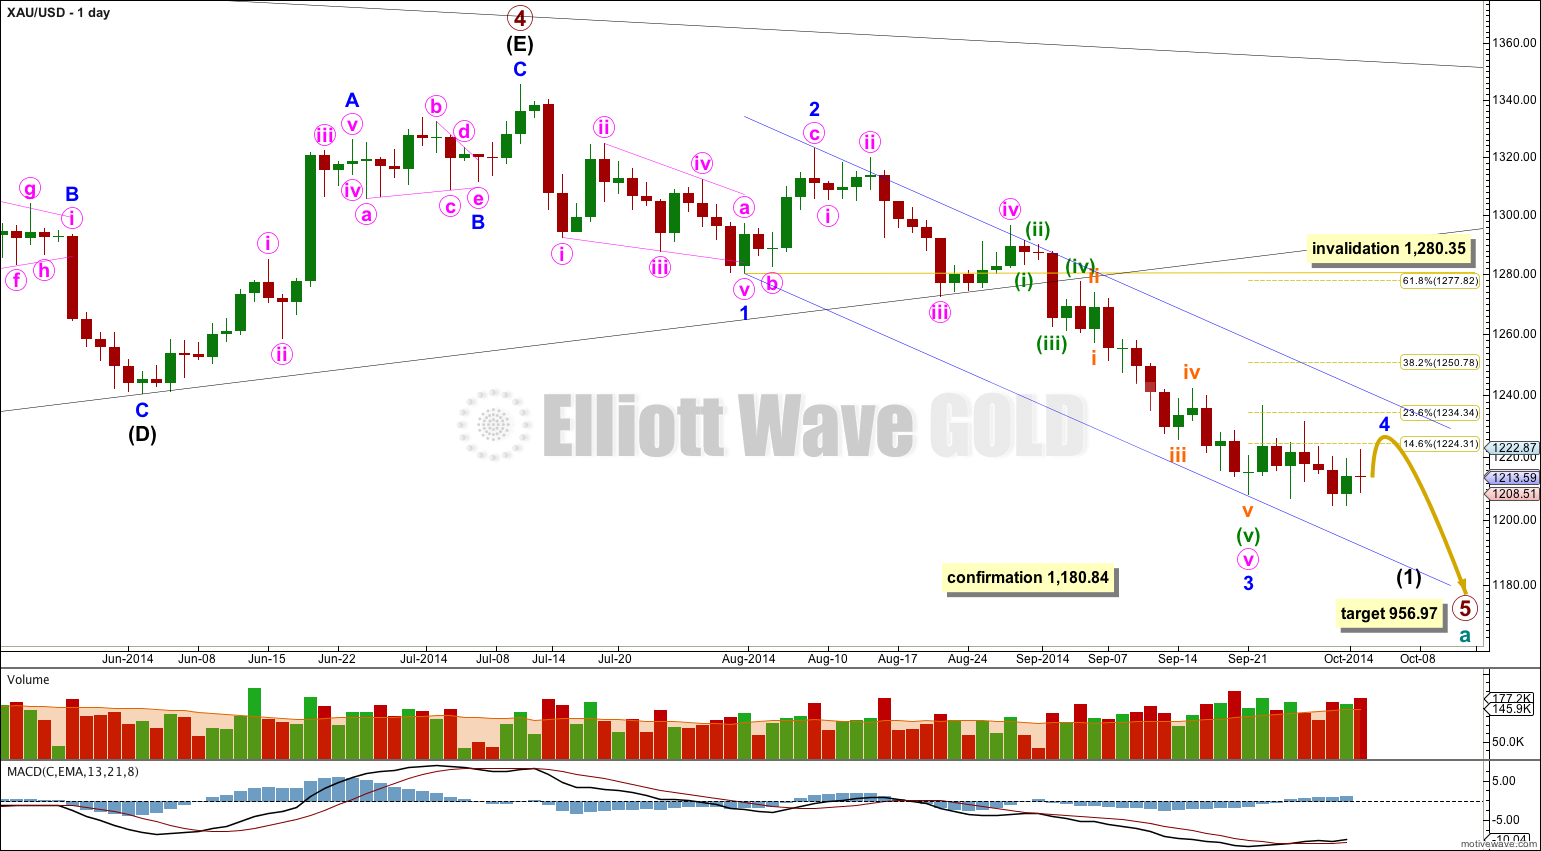
On the weekly chart extend the triangle trend lines of primary wave 4 outwards. The point in time at which they cross over may be the point in time at which primary wave 5 ends. This does not always work, but it works often enough to look out for. It is a rough guideline only and not definitive. A trend line placed from the end of primary wave 4 to the target of primary wave 5 at this point in time shows primary wave 5 would take a total 26 weeks to reach that point, and that is what I will expect. Primary wave 5 has begun its 12th week.
At 956.97 primary wave 5 would reach equality in length with primary wave 1. Primary wave 3 is $12.54 short of 1.618 the length of primary wave 1, and equality between primary waves 5 and 1 would give a perfect Elliott relationship for this downwards movement.
However, when triangles take their time and move close to the apex of the triangle, as primary wave 4 has (looking at this on a weekly chart is clearer) the movement following the triangle is often shorter and weaker than expected. If the target at 956.97 is wrong it may be too low. In the first instance I expect it is extremely likely that primary wave 5 will move at least below the end of primary wave 3 at 1,180.40 to avoid a truncation. When intermediate waves (1) through to (4) within primary wave 5 are complete I will recalculate the target at intermediate degree because this would have a higher accuracy. I cannot do that yet; I can only calculate it at primary degree.
Minor wave 3 is $9.65 longer than 1.618 the length of minor wave 1. This variation is less than 10% the length of minor wave 3 and so I would consider it an acceptable Fibonacci ratio. Just.
Movement comfortably below 1,180.84 would provide further confidence in this main wave count as at that stage an alternate idea which sees primary wave 4 as continuing would be invalidated.
I have drawn a Fibonacci retracement the length of minor wave 3. Minor wave 4 has so far reached up to the 0.236 at 1,234.34. If minor wave 4 continues as a triangle this will be its maximum depth. If it continues as a flat correction then it may yet move higher to the 0.382 at 1,250.78 Fibonacci ratio. If it continues as a combination then about the 0.236 Fibonacci ratio will be close to its maximum depth.
Draw a channel about intermediate wave (1): draw the first trend line from the lows labeled minor waves 1 to 3, then place a copy on the high labeled minor wave 2. If it completes as a flat correction minor wave 4 may find resistance and may end about the upper edge of this blue channel. If it overshoots the channel it should find some resistance at the upper blue trend line before breaking above it.
There is a nice morning doji star on this daily chart which supports this wave count. A morning doji star is a bottom reversal pattern, indicating the prior bear trend of minor wave 3 should change to a new trend. This new trend may be either upwards or sideways, and the wave count expects it is sideways.
There are still three structural possibilities for this fourth wave correction: a flat, a triangle or a combination. If fourth wave correction ends very soon it may end in a total Fibonacci eight days. However, at this stage it looks like it may need another one to three days to complete.
All three hourly wave counts below are viable and all three scenarios must be considered. At this stage the triangle looks most likely.
Hourly Wave Count – Triangle
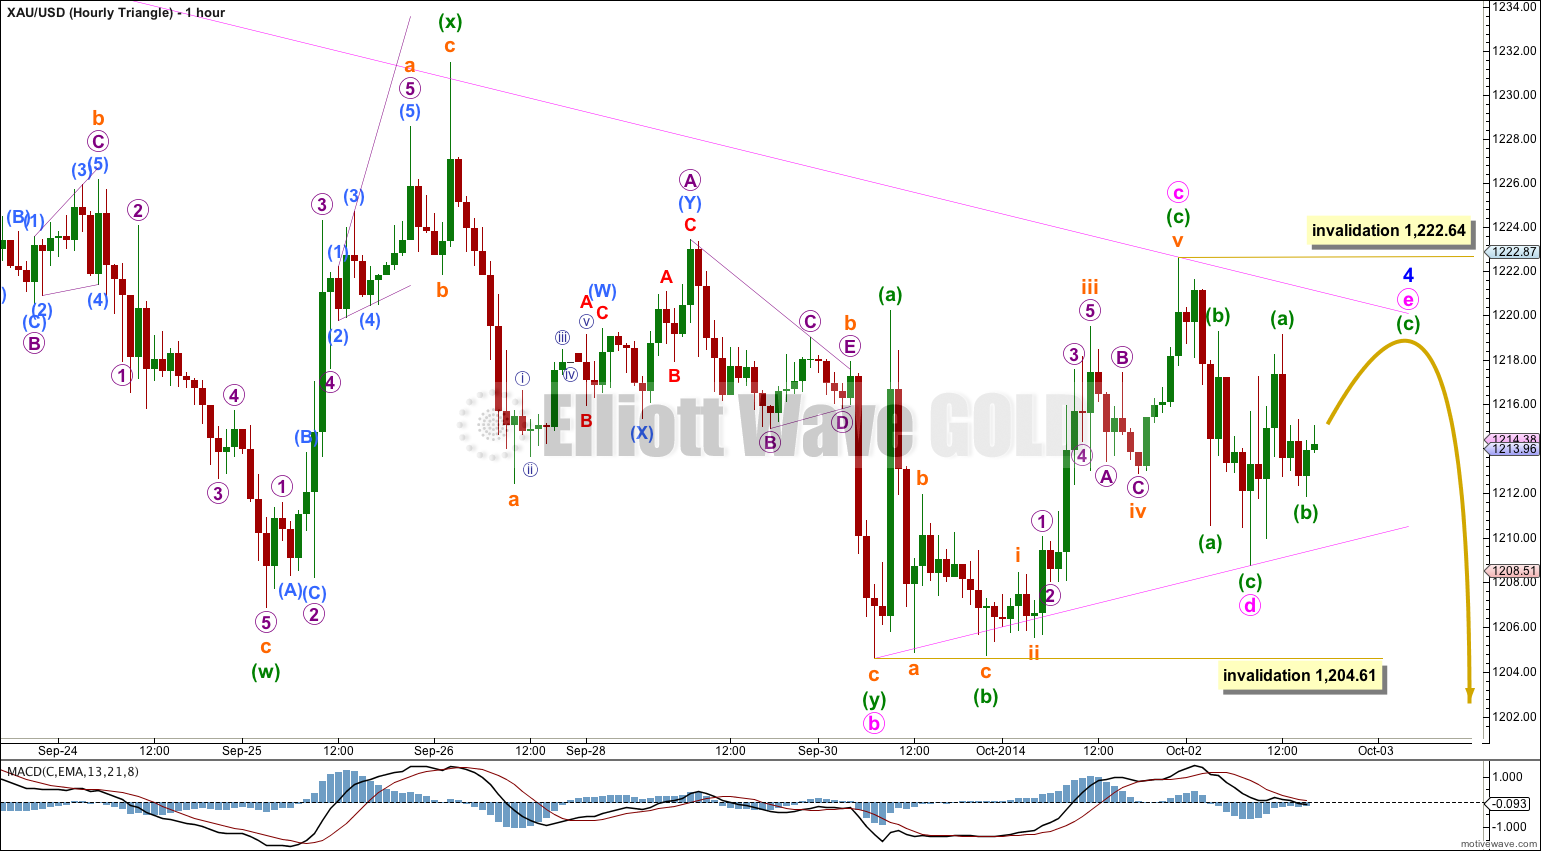
The triangle may be very close to completion. Within the triangle minute wave b is a longer lasting more complicated double zigzag. All the other subwaves must be simple A-B-C corrections, and three of those must be zigzags. It is still possible that minute wave e could unfold as a triangle, and the whole structure could be a time consuming nine wave triangle with minute wave b as a double zigzag. This is what happened for minor wave B within intermediate wave (D) on the daily chart.
Minute wave e may not move beyond the end of minute wave c above 1,222.64. I expect that minute wave c is over; it is a very time consuming zigzag.
Minute wave d may not be over though. If it continues lower it may not move below the end of minute wave b at 1,204.61 if the triangle is contracting. If the triangle is a barrier triangle it may move slightly below this point as long as the b-d trend line remains essentially flat.
Minute wave e may not move beyond the end of minute wave c above 1,222.64 for either a contracting or barrier triangle. This upper invalidation point is black and white. Minute wave e is most likely to end short of the a-c trend line, but the other possibility is it could overshoot the a-c trend line.
If price continues sideways to complete minute wave e, and then turns strongly downwards breaking far enough below 1,204.61 for a possible b-d trend line to have a clear slope, this would confirm minor wave 4 as complete and minor wave 5 should have begun.
If price breaks above 1,222.64 the triangle would be invalidated and more time would be needed for a flat or combination to complete.
Although I could label this triangle as complete at the time of publication, market behaviour indicates it is not. When the triangle is over price should move strongly lower.
Although at this stage it looks like a triangle is most likely, this is not well supported by MACD. While triangles unfold MACD should hover close to the zero line, as it did during the small triangle on this hourly chart which was subminuette wave b within minuette wave (y) within minute wave b. On the hourly chart for the duration of minor wave 4 MACD varies too much above and below the zero line, as it does also on the two hourly chart. This indicates that one of the other two possibilities below may actually be correct, and so they must still be seriously considered.
Hourly Wave Count – Combination
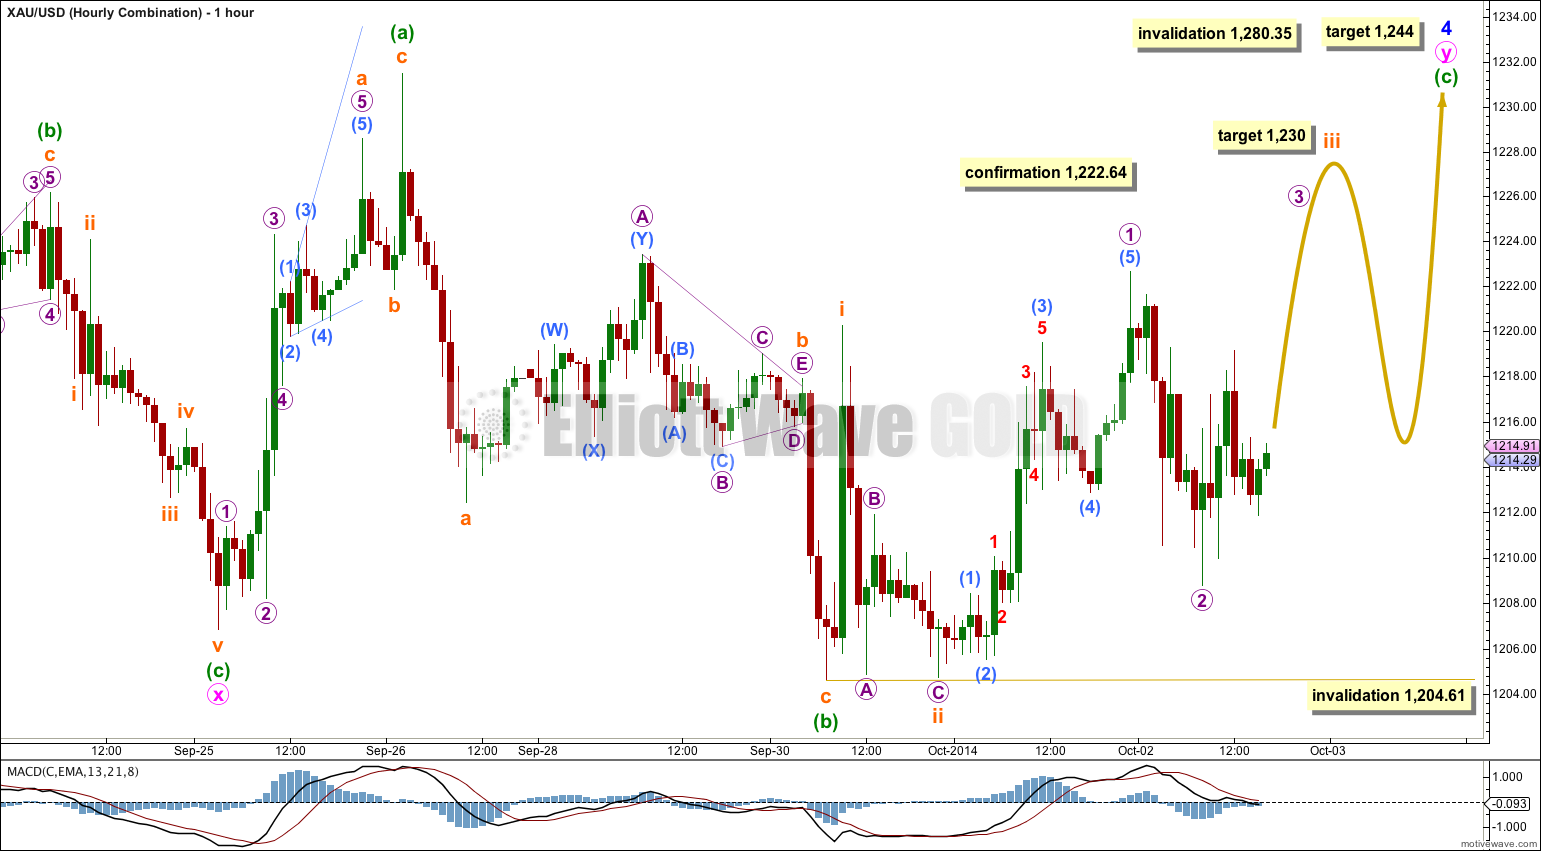
If minor wave 4 is a combination then the last wave of minuette wave (c) within the second structure, a flat for minute wave y, is still incomplete.
Minuette wave (c) must unfold as a five wave structure. I am labeling it as an impulse, but an ending diagonal is also possible.
If minuette wave (c) is an impulse then within it subminuette wave iii would reach 1.618 the length of subminuette wave i at 1,230.
If minuette wave (c) is an ending diagonal then it would most likely be contracting, and the first wave up would be a completed zigzag for subminuette wave i. Subminuette wave ii of a possible diagonal may not move beyond the start of subminuette wave i below 1,204.61.
This structure would probably take another one to two days to complete at least, whether it be an impulse or an ending diagonal.
For both possibilities the target is the same. At 1,244 minuette wave (c) would reach 1.618 the length of minuette wave (a).
Minor wave 4 may not move into minor wave 1 price territory above 1,280.35.
Hourly Wave Count – Flat
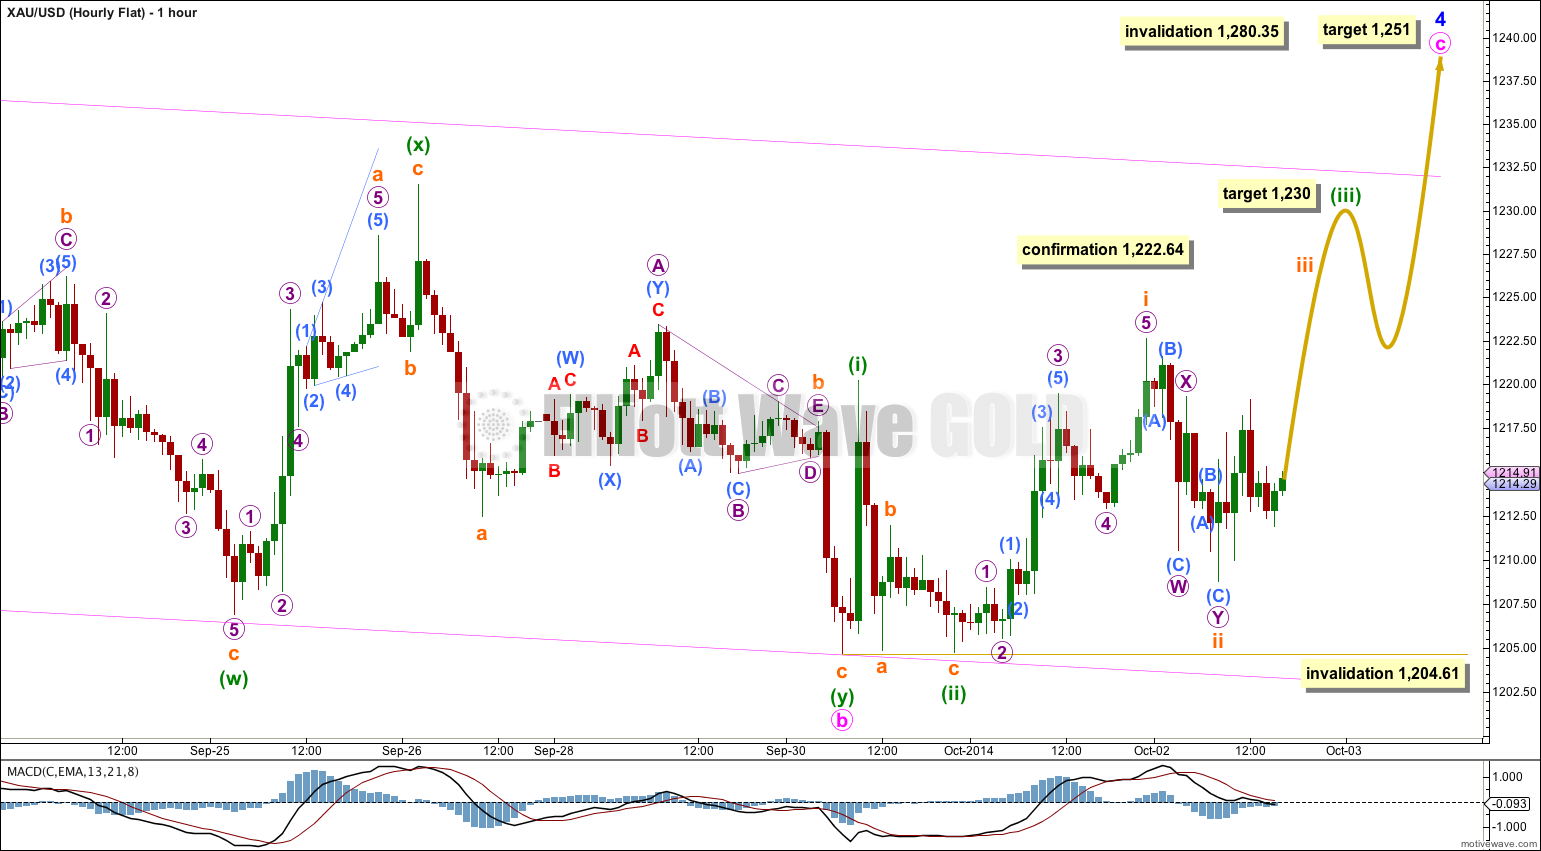
Minor wave 4 could still be a flat correction, but this now looks least likely because minute wave c is taking so much time.
Again, as for the combination minute wave c may only subdivide as an impulse or an ending diagonal. Both structures are still possible.
If minute wave c is an impulse then within it at 1,230 minuette wave (iii) would reach 1.618 the length of minuette wave (i).
If minute wave c is an ending diagonal then minuette wave (i) would be a complete zigzag. Minuette wave (ii) may not move below the start of minuette wave (i) below 1,204.61.
For both the combination and flat hourly wave counts any movement below 1,204.61 would invalidate them and confirm that minor wave 4 should be a triangle. Comfortable movement below 1,204.61 would then be required to confirm that minor wave 4 is over.
This analysis is published about 05:40 p.m. EST.
Any possibility of getting a target for minor 5 before your next update?
Thanks!
Yes.
1,154.
As a suggestion:
In the future, it may be wise to highlight “questionable” spikes for later analysis.
No. I’m not going to start to exclude some data from the analysis. If the data is there, it has to be included.
Yes I could see that excluding the spike would have little effect on wave two. -I noticed that shortly after my post- but my initiative to seek reason for disparity between waves two and four highlights the impact that a small computer generated error could make on the overall wave count.
Again, I’m not suggesting that you “exclude” future anomalies but rather highlight for reminder and consideration.
As it stands GDX waves two and four seem grossly disproportioned IMO.
Regards,
Jaf
yes, they are disproportionate.
sometimes that happens in some markets, particularly in markets with less volume
I have not been analysing GDX for long enough to know if this is a tendency it has. I have noticed that it does truncations.
I think gdx should have been counted the same way as gold after black wave 4… In other words I think we should have counted it as a leading diagonal. But because there was a “questionable” spike during that time period we counted it as a pink-one-down and joined it with an expanded flat. The problem with this analysis is that pink wave 2 now “appears” to be several days long and that is important because it means that we expect pink wave 4 to be something of reasonable comparison. But let’s say that that spike did not exist; as many of us believe, and as a result, pink wave two was a lot “shorter” in duration this could mean that pink wave four has comparably completed itself and we are finalizing pink wave five down today. in other words blue wave one would now be close to over and that works out well with MACD which appears to be turning. So if we are close to completing Blue wave one for GDX then perhaps we are close to completing black wave-one for gold? I suspect that the fifth wave for gold May be a Fibonacci .618 ratio of its comparable (wave-one) and that would mean that GDX and gold will bottom at about and around the same time. …Would have to investigate this general idea or concept.
I have of course considered that minute wave i ended lower, and I have considered the two structural possibilities for it. There is absolutely no way it fits as a leading diagonal. Even if I exclude that spike. It… just does not fit.
GDX is a market with much less volume than the global cash market for gold. The structures are not as typical looking, it seems to readily do truncations, and from what I’ve seen so far of it the durations are not always typically nicely in proportion.
Even without the spike minute wave ii must end where it ends, that point is higher than prior swing highs. The only way to see minute ii as shorter than I have it is to see that high as the end of intermediate wave (4)… and then minor wave C does not fit. At all.
If you want to consider your suggestions seriously, then try to chart it yourself. In going through this exercise you will see what I mean. It just does not fit. Resolving one problem quickly creates another.
I think for GDX minute waves ii and iv are disproportionate. I’ll accept this for now for GDX, but I would accept things for this market which I would not accept for gold.