
The target at 84.65 was comfortably passed and the structure is incomplete.
Summary: The new target for this wave to end is 79.67 – 78.15, which may be met within one to two weeks.
Click on charts to enlarge.
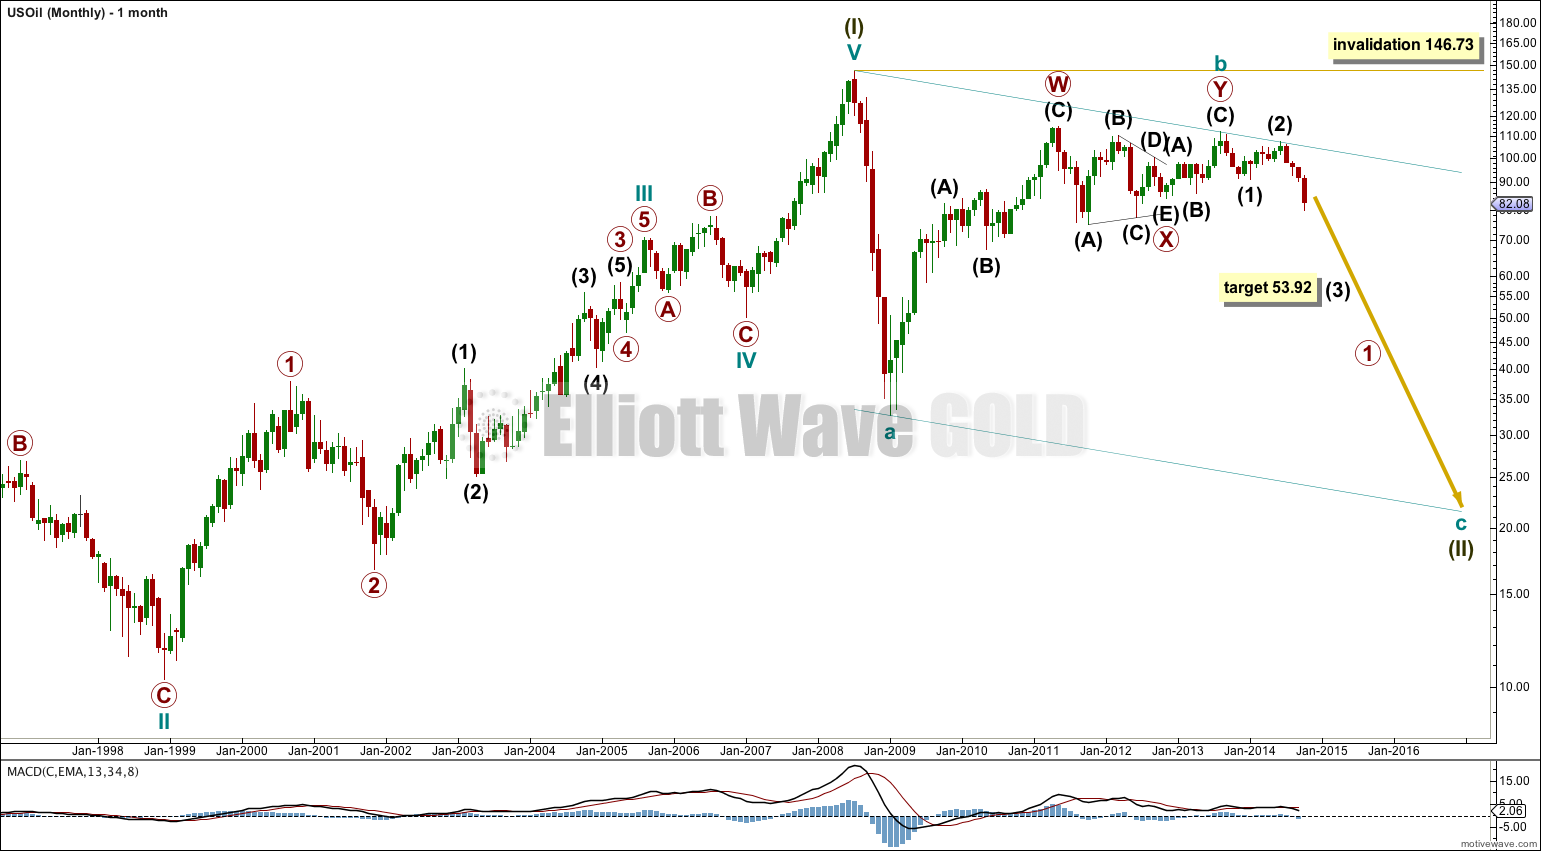
The bigger picture sees US Oil in a super cycle second wave correction unfolding as a huge zigzag. Within the zigzag cycle wave a subdivides best as a five, indicating a zigzag, and cycle wave b is a complete double zigzag.
If cycle wave b were to continue any higher it may not move beyond the start of cycle wave a above 146.73.
Cycle wave c is most likely to end when price finds support at the lower edge of the large channel.
Within cycle wave c intermediate wave (3) would reach 2.618 the length of intermediate wave (1) at 53.92.
Depending on the length of this third wave I may consider moving the labeling within cycle wave c all up one degree.
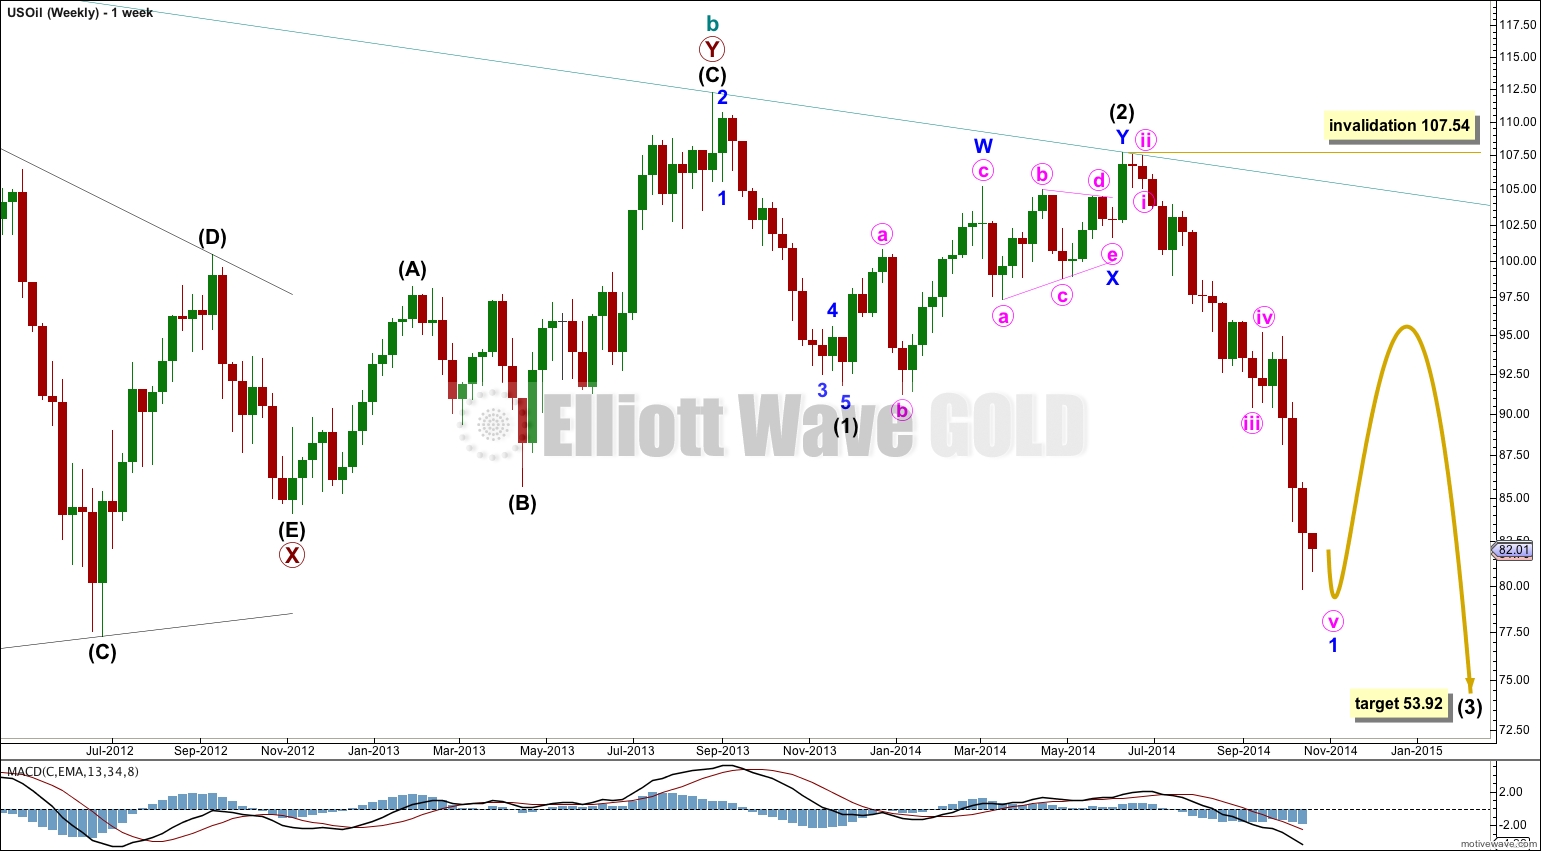
Intermediate wave (1) down looks like a five wave impulse and intermediate wave (2) upwards looks like a clearly contrasting correction with a lot of choppy overlapping movement.
Within intermediate wave (3) minor wave 1 is close to completion. When it is done I will draw a Fibonacci retracement along its length and expect minor wave 2 to end about the 0.382 Fibonacci ratio in the first instance, and the 0.618 Fibonacci ratio slightly less likely. Because this would be a second wave correction within a third wave it may be more shallow and brief than otherwise.
Minor wave 2 may not move beyond the start of minor wave 1 above 107.54.
Minor wave 1 is ending with a typically strong fifth wave.
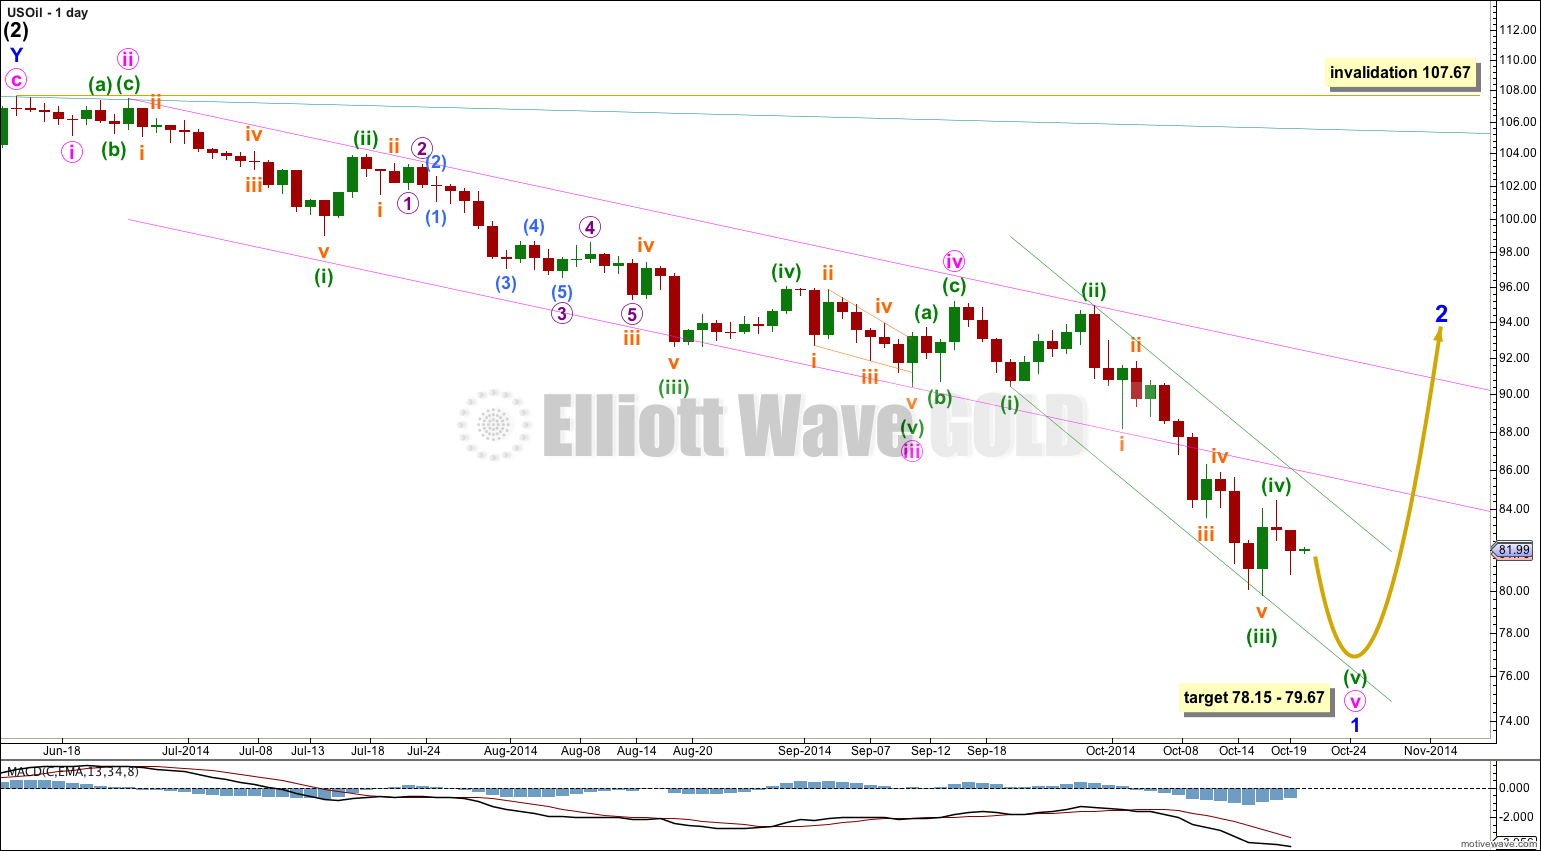
Within minor wave 1 minute wave iii is 0.52 short of 6.854 the length of minute wave i. At 78.15 minute wave v would reach equality in length with minute wave iii.
Within minute wave v there is no Fibonacci ratio between minuette waves (iii) and (i). I would expect to see a Fibonacci ratio between minuette wave (v) to either of (i) or (iii). At 79.67 minuette wave (v) would reach equality in length with minuette wave (i).
I favour the upper end of this target zone because it is calculated at a lower degree.
Draw a channel about minute wave v using Elliott’s first technique: draw the first trend line from the lows of minuette waves (i) to (iii), then place a parallel copy on the high of minuette wave (ii). I would expect minuette wave (v) to find support and end at the lower edge of this channel.
When this green channel is breached by at least one full daily candlestick above it and not touching the upper green trend line then I would take that as trend channel confirmation that minor wave 1 is over and minor wave 2 is underway.
Minor wave 2 may not move beyond the start of minor wave 1 above 107.67.
Lara,
Great job on oil. I found it hard to believe oil could drop so far so fast but your analysis was correct. Would be most helpful to see oil chart once per week.
Question: Can you give an estimate on time (trading days or weeks) for minor 2 to complete? I realize you cannot be specific, generic time would be useful.
I would first look at the duration of minor wave 1. So far its lasted 95 days, 4 months. I would expect minor wave 2 to most likely be of an even duration. So about 4 months.
Which means my degree of labeling is probably wrong… that looks more like intermediate degree.