
Price has moved mostly sideways to complete a small red candlestick. The main and new alternate Elliott wave counts both remain valid.
Summary: I still favour the main wave count, but it requires a new low below 1,146.98 before I will have confidence in the target at 1,004. It expects to see a strong downwards movement unfold. Alternatively, a new high above 1,194.36 would indicate a third wave up may be underway, and the target for that is 1,224.
Click on charts to enlarge
Main Wave Count
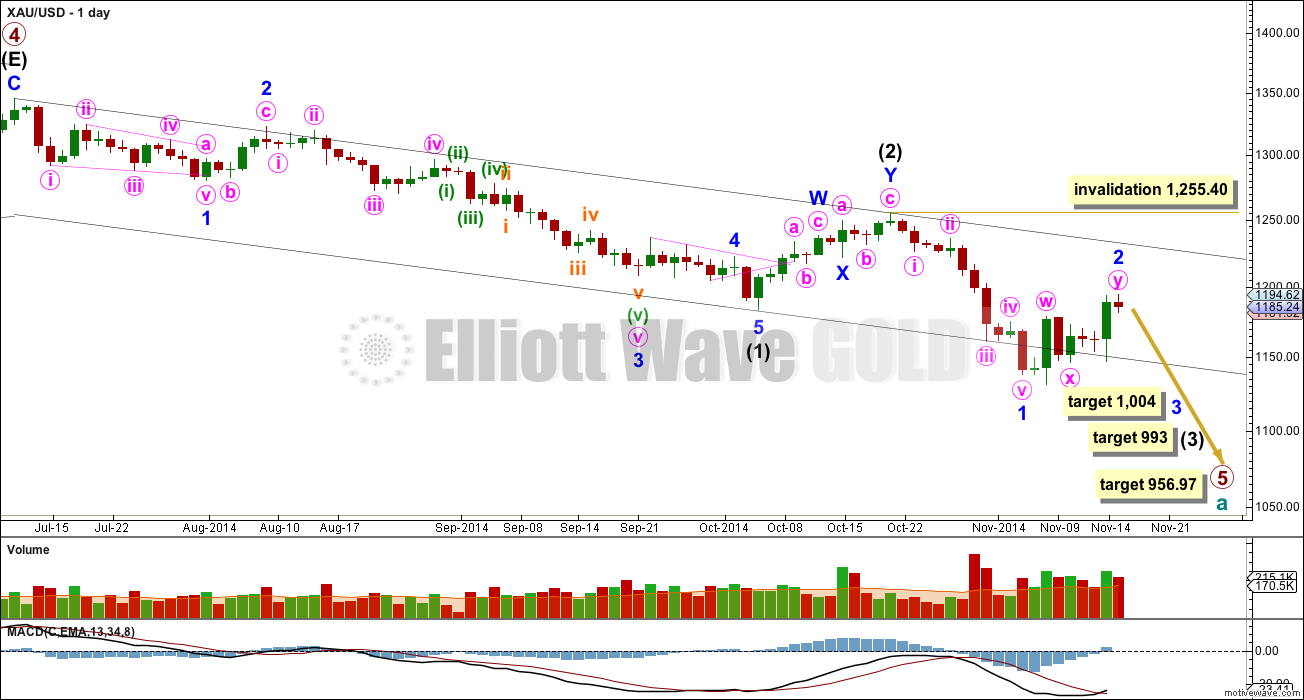
Primary wave 4 is complete and primary wave 5 is unfolding. Primary wave 5 may only subdivide as an impulse or an ending diagonal. So far it looks most likely to be an impulse.
Within primary wave 5 intermediate wave (1) fits perfectly as an impulse. There is perfect alternation within intermediate wave (1): minor wave 2 is a deep zigzag lasting a Fibonacci five days and minor wave 4 is a shallow triangle lasting a Fibonacci eight days, 1.618 the duration of minor wave 2. Minor wave 3 is 9.65 longer than 1.618 the length of minor wave 1, and minor wave 5 is just 0.51 short of 0.618 the length of minor wave 1. I am confident this movement is one complete impulse.
Intermediate wave (2) is a relatively shallow 45% double zigzag correction.
Intermediate wave (1) lasted a Fibonacci 13 weeks. I would expect intermediate wave (3) to be extended in both price and duration. If it lasts a Fibonacci 21 weeks it would be 1.618 the duration of intermediate wave (1). So far intermediate wave (3) has just begun its fourth week.
Intermediate wave (3) may only subdivide as an impulse, and at 993 it would reach 1.618 the length of intermediate wave (1).
The target for primary wave 5 at this stage remains the same. At 956.97 it would reach equality in length with primary wave 1. However, if this target is wrong it may be too low. When intermediate waves (1) through to (4) within it are complete I will calculate the target at intermediate degree and if it changes it may move upwards. This is because waves following triangles tend to be more brief and weak than otherwise expected. A perfect example is on this chart: minor wave 5 to end intermediate wave (1) was particularly short and brief after the triangle of minor wave 4.
Intermediate wave (3) must move far enough below the end of intermediate wave (1) to allow room for upwards movement for intermediate wave (4) which may not move into intermediate wave (1) price territory.
At 1,004 minor wave 3 would reach 1.618 the length of minor wave 1.
Minor wave 2 may not move beyond the start of minor wave 1 above 1,255.40. However, if it does continue higher then it would most likely not break above the upper edge of the black base channel about intermediate waves (1) and (2).
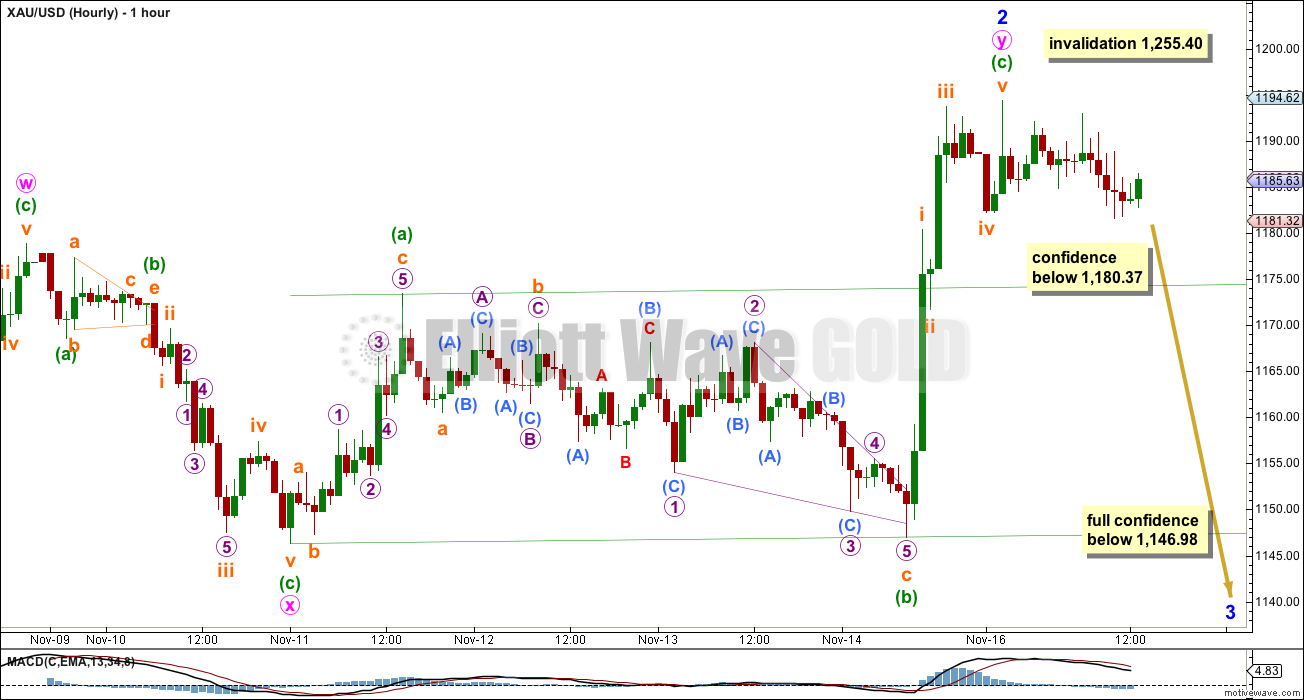
Minor wave 2 still subdivides perfectly as a double flat correction, now lasting a Fibonacci eight days in total. Although minuette wave (c) looks like a three on the hourly chart it does subdivide perfectly as a five on the five minute chart.
I will have some confidence that minor wave 2 is over if price moves below 1,180.37. At that stage downwards movement may not be a continuation of subminuette wave iv because it may not move back into subminuette wave i price territory.
For full confidence in this trend change and the target at 1,004 for minor wave 3 I want to see a new low below 1,146.98. At that stage the alternate wave count below would be invalidated. Only at that stage would I be confident enough to call a trend change.
Minor wave 3 within intermediate wave (3) should show a very strong clear increase in downwards momentum.
If price keeps going up minuette wave (c) could be extending higher. However, the purpose of double flats is to take up time and move price sideways. They do not normally have a clear slope against the main trend. Already this structure is beginning to look slightly atypical, and if it extends higher it will reduce significantly in probability. If it did move higher I would expect upwards movement to find strong resistance at the upper edge of the base channel from the daily chart. If that upper black trend line is breached I would discard this main wave count in favour of the alternate below.
Alternate Wave Count
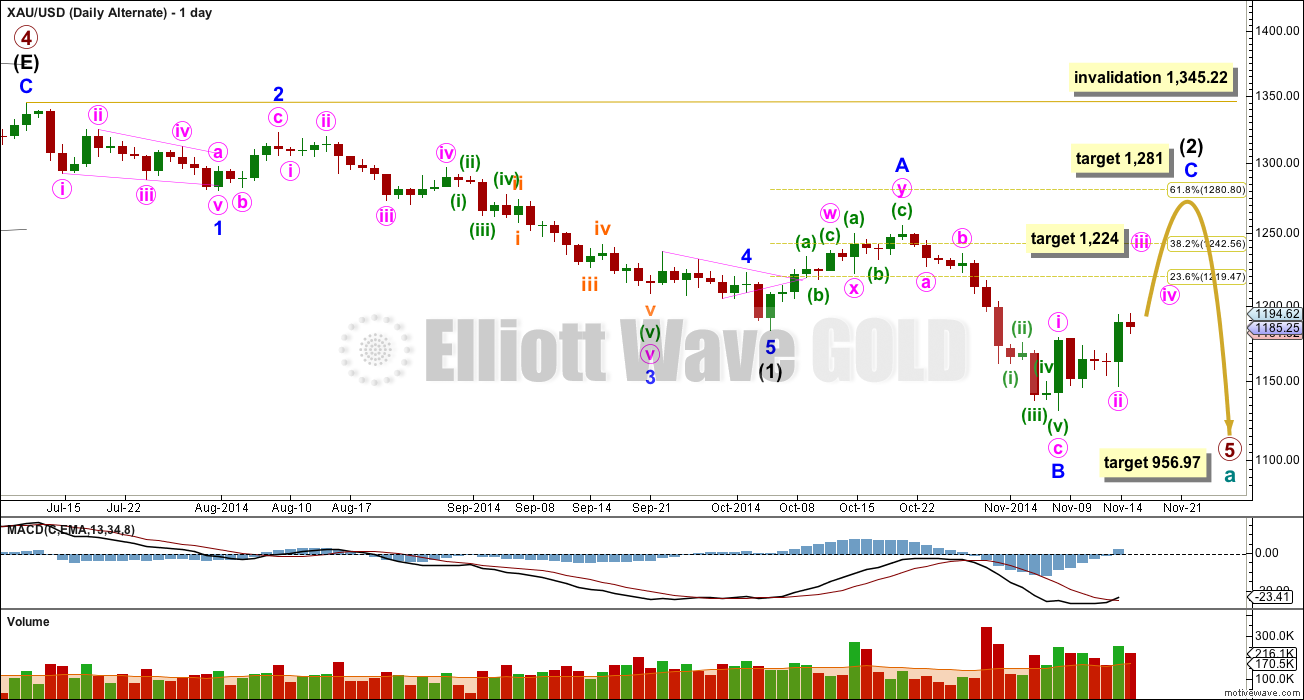
This alternate wave count sees intermediate wave (1) as complete in exactly the same way as the main wave count. Thereafter, I have moved the degree of labelling within the double zigzag for intermediate wave (2) down one degree. This may have been only minor wave A within a larger expanded flat correction for intermediate wave (2).
Downwards movement for minor wave B does subdivide as a three wave zigzag, and so this wave count is possible. However, the common length for a B wave within a flat correction is between 100% and 138% the length of the A wave. This B wave is 172% the length of minor wave A. This is certainly possible, but it does reduce the probability of this wave count to an alternate.
Minor wave C must subdivide as a five wave structure. On the hourly chart the subdivisions so far fit. At 1,224 within it minute wave iii would reach 1.618 the length of minute wave i.
Minor wave C would be extremely likely to move at least slightly above the end of minor wave A at 1,255.40 to avoid a truncation and a very rare running flat. It may take intermediate wave (2) up to reach the 0.618 Fibonacci ratio of intermediate wave (1) just below 1,281.
Intermediate wave (2) may not move beyond the start of intermediate wave (1) above 1,345.22. If this invalidation point is passed (and I am very confident it will not be yet) then that would indicate an end to primary wave 5 and a trend change at cycle degree.
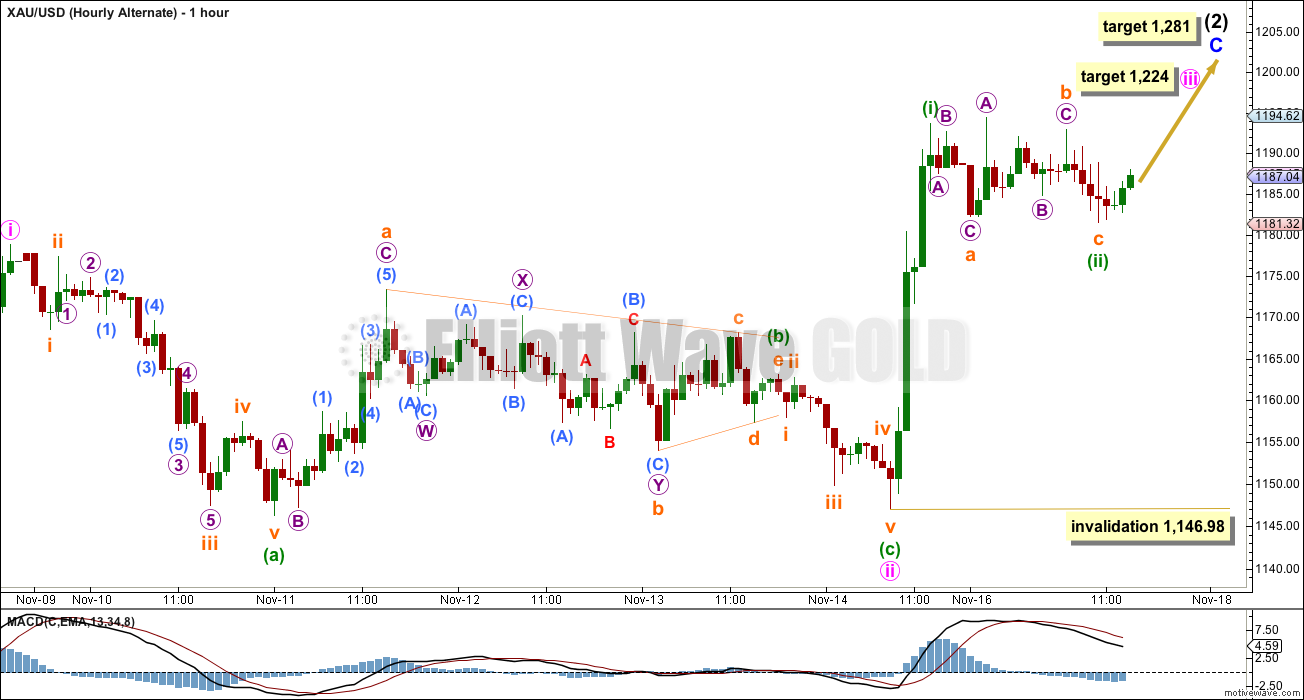
So far within minor wave C minute waves i and now ii would be complete. Within minute wave iii no second wave correction may move beyond the start of its first wave below 1,146.98. If price moves below this point this alternate wave count would be discarded.
Within minute wave iii the next wave up for minuette wave (iii) should show a strong increase in upwards momentum.
If we see a new high above 1,194.36 within the next few hours this alternate wave count will increase in probability. At that stage I would expect more upwards movement, and I may swap this alternate wave count over to be my main wave count. I would look for an increase in upwards momentum, and I would look to see a five wave impulse unfolding upwards.
This analysis is published about 02:56 p.m. EST.
Excellent discussions. Thank you Lara. I hope these discussions are not keeping you away from your hard work and analysis during trading hours. I really love the service and learning lot about Elliott Waves.
I’m happy you love learning about EW. I love teaching it. And really, this service is not just analysis it’s also genuinely educational. I’m an ex teacher, it never dies.
No. The confidence points were not passed.
Now price has made new highs I think we have our answer as to which wave count is correct.
My first reason for looking seriously at it was a few good technical reasons for more upwards movement given by members in comments.
Second reason was the $10 overshoot of the target; this gives minor wave 2 a clear slope on the daily chart. Double flats don’t normally look like that.
Third reason was the high volume. From a traditional TA point of view that indicates the breakout should be up.
I do understand it must be frustrating when it looks like I have so much confidence in a wave count, for me to only then come up with an alternate the next day or so afterwards.
Markets change, that is their only constant. It is essential that analysis is flexible and changes with the market when price tells us it should.
I will not always have the right wave count. But my aim is to provide alternates where appropriate so that if my main wave count is wrong members have a valid alternate to turn to.
It is possible to label it that way, yes.
But then it looks so very wrong.
What gives a wave count the “right look” is the proportion between waves 2 and 4 within an impulse; if their duration is the same or similar (and sometimes a 1.618 ratio looks good) then the impulse looks like a five.
But when one of the corrections is way much longer than the other it gives the impulse a three wave look.
Gold normally has pretty typical looking waves. I really don’t want to accept that for Gold on the hourly chart.
No, because minor wave 1 would have a count of seven which is corrective. It should be an impulse.
Is it possible that the low at 1130.4 marked the end of minor wave 1 and that we are just beginning minor wave 2?
Hi Lara,
in your hourly main count, is it possible posticipate subminuette wave iv at the end of sideway ( about 1185 ), followed by subminutte v with the top 1205 ?
Thanks!
Hello Lara,
Can it be that the primary 5 wave is unfolding as an ending diagonal structure? Then this whole structure from 10th of July to 7th of November can be counted in A-B-C wave.
What do you think?
Yes, it most certainly could be.
At this stage there would be no divergence between that idea and the alternate wave count (which will be swapped over today to be the main wave count). That idea would expect upwards movement for a couple of weeks probably.
If this upwards movement subdivides as a three and not a five, then I will publish this idea. For now, I would like to keep the amount of wave counts published manageable.
I understand the fact you do not want to have many counts but I look at that $125 decline that you call a B wave in the alternate count and it does not look right for me. It was just a very strong decline in just 12 days. If that is not an impulse then I do not know what an impulse is.
If we take that movement from its high at 1,255.40 to its low at 1,131.09 and count the subdivisions, it has a count of seven. That is corrective, not impulsive. It does not subdivide correctly as an impulse.
I will show a prior expanded flat on the daily chart today for Gold so you can get an idea of what they look like.
And yes, it did increase downwards momentum, but only a little (looking at it on the daily chart).
So it is either a B wave down within an expanded flat, or it is a C wave of a zigzag for intermediate wave (1) if primary 5 is unfolding as an ending diagonal.
Both ideas expect quite a lot of upwards movement, and the diagonal idea would expect upwards movement to 1,272 as a likely minimum, and likely higher.
There is zero divergence in the expected direction.
Leading diagonals in first wave positions are not very common. *edit: sorry, its an ending diagonal not leading, and they are somewhat common actually.
I have to discard the main wave count today, so I may include this diagonal idea.
Hi Lara, at this moment the price has made a new hight, is it possible that we are in minute wave v within minor wave C?
The sideway movement of yesterday has made a low at 1181 and would be possible to count this as minute wave iv. Is it correct?
Hi lara,
Gold has a new high above 1194.What do you think about it?
I think I will swap the main and alternate wave counts over today.
So I can understand better when and how new to alternate wave counts are published, could you explain, for example, why the new alternate wave count was publish when all indications prior was that when we hit the target of 1179-1183 minor wave 2 will be complete and Gold will reverse and strongly move downward. What’s confusing is that now it seems when we hit the target it has almost equal weight as the main wave count, but wasn’t considered before. What made the probability high enough to shift course now and publish the alternate? Was it the higher volume or moving $10 passer the target?
Seems like this is a false breakout in Gold and the confidence Is with the main wave count as Gold will sharply move lower once we break 1180. Can you provide a probability % for each wave count and going forward try to assess the probability % for each wave count.
Thanks again for your analysis as it is well articulated and helpful when trying to predict Gold’s movement from trailing indicators.
Good Analysis. It has been few hours and Gold has been below 1187 is that satisfy your condition for the main wave count?