
Upwards movement has clarified the situation. Yesterday’s alternate is now the main Elliott wave count, and I have to discard the other Elliott wave count because it no longer fits on the hourly chart and is invalid.
Summary: I expect upwards movement most likely to show some increase in momentum. A new high above 1,197.96 would confirm the main hourly wave count and provide confidence in the target at 1,224. Alternatively, a new low would confirm the alternate hourly wave count, with the target for downwards movement to end at 1,173 and the invalidation point at 1,146.98.
Click on charts to enlarge
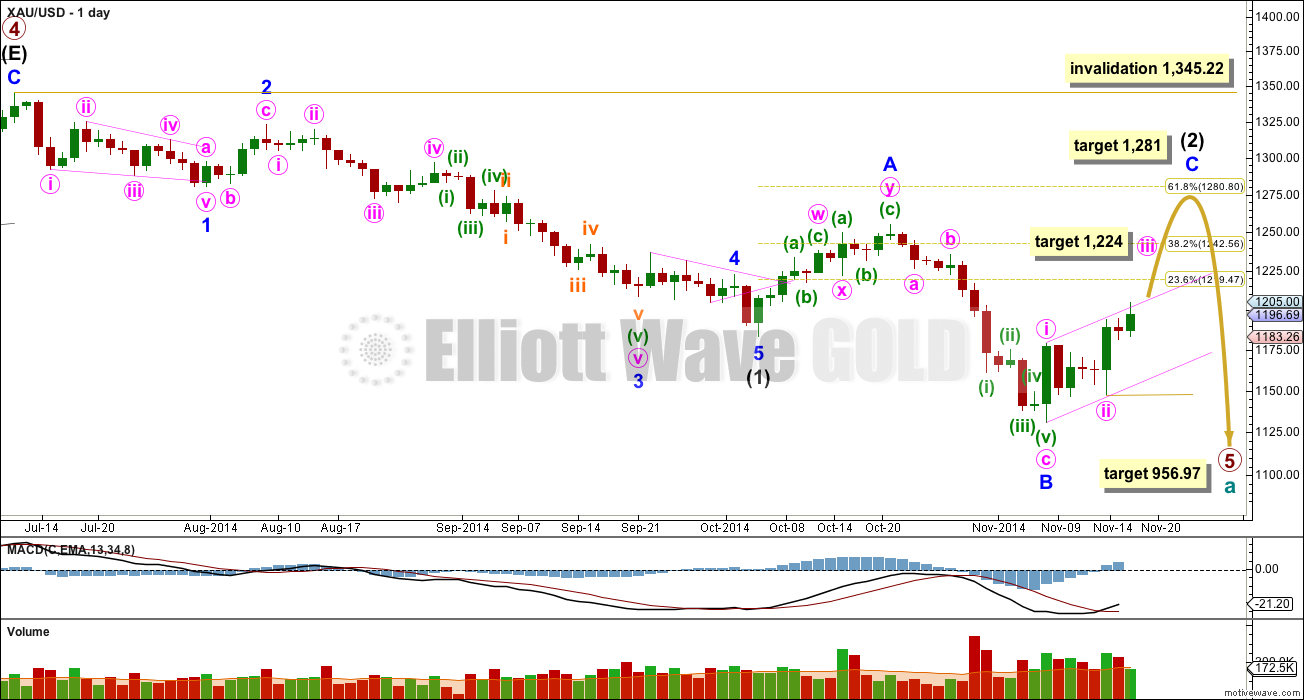
Primary wave 4 is complete and primary wave 5 is unfolding. Primary wave 5 may only subdivide as an impulse or an ending diagonal. So far it looks most likely to be an impulse.
Within primary wave 5 intermediate wave (1) fits perfectly as an impulse. There is perfect alternation within intermediate wave (1): minor wave 2 is a deep zigzag lasting a Fibonacci five days and minor wave 4 is a shallow triangle lasting a Fibonacci eight days, 1.618 the duration of minor wave 2. Minor wave 3 is 9.65 longer than 1.618 the length of minor wave 1, and minor wave 5 is just 0.51 short of 0.618 the length of minor wave 1. I am confident this movement is one complete impulse.
Intermediate wave (2) is an incomplete expanded flat correction. Within it minor wave A is a double zigzag. The downwards wave labelled minor wave B has a corrective count of seven and subdivides perfectly as a zigzag. Minor wave B is a 172% correction of minor wave A. This is longer than the maximum common length for minor wave B at 138%, but within the allowable range of less than twice the length of minor wave A. Minor wave C may not exhibit a Fibonacci ratio to minor wave A, and I think the target for it to end would best be calculated at minute degree. At this stage I would expect intermediate wave (2) to end close to the 0.618 Fibonacci ratio of intermediate wave (1) just below 1,281.
Within minor wave C minute wave iii would reach 1.618 the length of minute wave i at 1,224.
Intermediate wave (1) lasted a Fibonacci 13 weeks. So far intermediate wave (2) is in its sixth week. I will expect it may continue for another two weeks at least to total a Fibonacci eight, and be 0.618 the duration of intermediate wave (1).
The target for primary wave 5 at this stage remains the same. At 956.97 it would reach equality in length with primary wave 1. However, if this target is wrong it may be too low. When intermediate waves (1) through to (4) within it are complete I will calculate the target at intermediate degree and if it changes it may move upwards. This is because waves following triangles tend to be more brief and weak than otherwise expected. A perfect example is on this chart: minor wave 5 to end intermediate wave (1) was particularly short and brief after the triangle of minor wave 4.
Intermediate wave (2) may not move beyond the start of intermediate wave (1) above 1,345.22. I have confidence this price point will not be passed because the structure of primary wave 5 is incomplete, and downwards movement from the end of the triangle of primary wave 4 does not fit as either a complete impulse nor an ending diagonal.
Draw a base channel about minor wave C: draw the first trend line from the start of minute wave i to the end of minute wave ii, then place a parallel copy on the end of minute wave i. Copy this pink channel over carefully to hourly charts. Minute wave iii should have the power to break above the upper edge of this channel. Along the way up downwards corrections should find support and not break below the lower edge of this channel.
I have considered the possibility that primary wave 5 could be an ending diagonal, and intermediate wave (1) as a zigzag may be over at the low labelled minor wave B at 1,131. However, this idea does not fit and looks wrong. If intermediate wave (1) is a complete zigzag then minor wave C within it has a corrective count of seven, and looks like a zigzag and not an impulse. C waves must subdivide as fives and not threes.
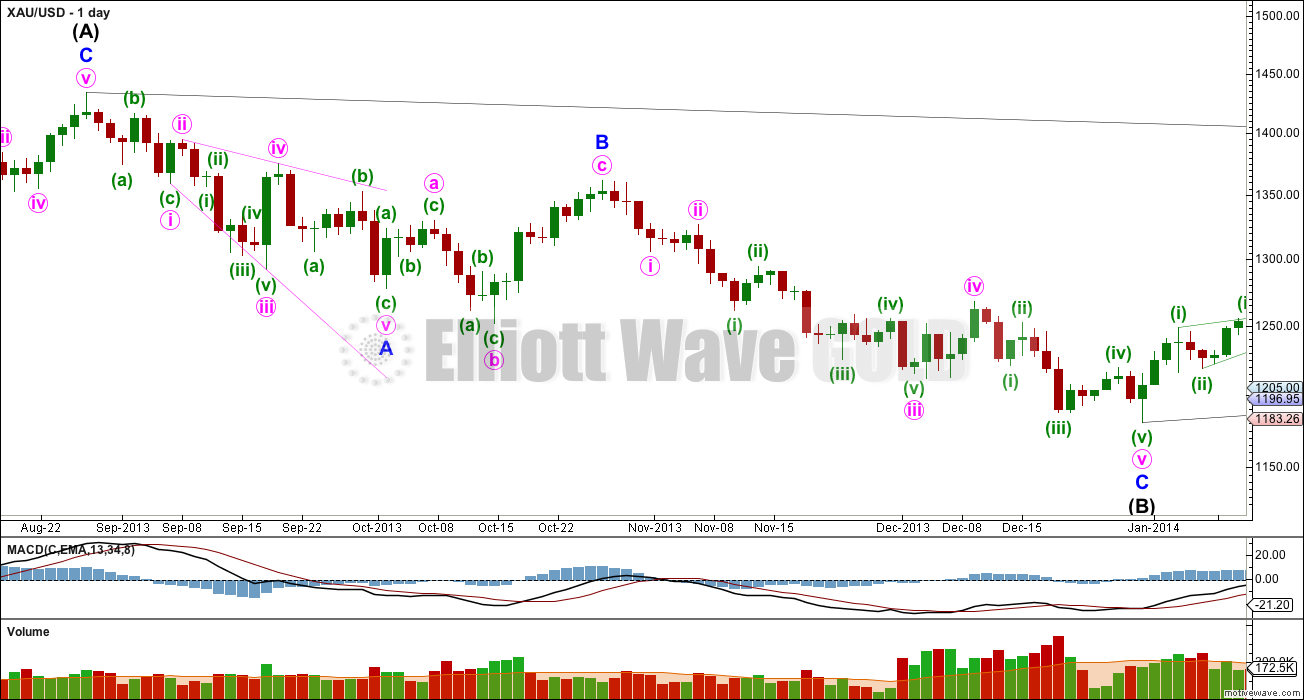
This daily chart shows intermediate wave (B) within the large triangle of primary wave 4. Within intermediate wave (B) zigzag the middle, minor wave B, subdivides perfectly as an expanded flat correction. Minute wave a is a clear three wave structure. Minute wave b downwards is also a clear three wave structure and is a 150% correction of minute wave a; longer than the maximum common length of 138% but within the allowable limit of twice the length of minute wave a. Minute wave c has no Fibonacci ratio to minute wave a, and it took minor wave B up to just over halfway the length of minor wave A.
This structure is a reasonably typical looking expanded flat.
The key to recognising one is unfolding is twofold: if the correction expected subdivides as a three but is more brief and shallow then an expanded flat may be indicated, and if the following downwards movement subdivides as a three also then an expanded flat should be seriously considered. I am learning the hard way to allow for B waves within expanded flats to be longer than 138% the length of their A waves. I will begin to build a database of all expanded flats I see for Gold at the hourly chart level and above to determine their typical form for this market.
Main Hourly Wave Count

I am discarding the prior main wave count because the upwards movement from the low of minute wave ii at 1,146.98 to the last high no longer subdivides as a five. In trying to label that as a five wave impulse the third wave within it is the shortest, violating a core Elliott wave rule. That wave count would have to expect quite a lot more upwards movement and that makes no sense for a double flat which should move sideways.
Minor wave C upwards must subdivide as a five wave structure. It may only be an impulse or an ending diagonal. Within ending diagonals all the sub waves must be zigzags. So far it does not look like a zigzag is just complete or unfolding, and looks like an impulse is moving towards the middle of its third wave.
Within minor wave C minute waves i and ii are complete. Minute wave iii must move far enough above the end of minute wave i to allow subsequent room for downwards movement for minute wave iv which may not move back into minute wave i price territory.
I have carefully checked on the five minute chart the subdivisions of upwards movement from 1,181.56 which does not fit at all as a complete five but does fit as a three. Subminuette wave i is incomplete. When subminuette wave i is over then subminuette wave ii down may not move beyond the start of subminuette wave i below 1,181.56.
Subminuette wave iii should show an increase in upwards momentum.
This wave count would be confirmed at the hourly chart level with a new high above 1,197.96 as at that stage the alternate below would be invalidated.
Alternate Hourly Wave Count
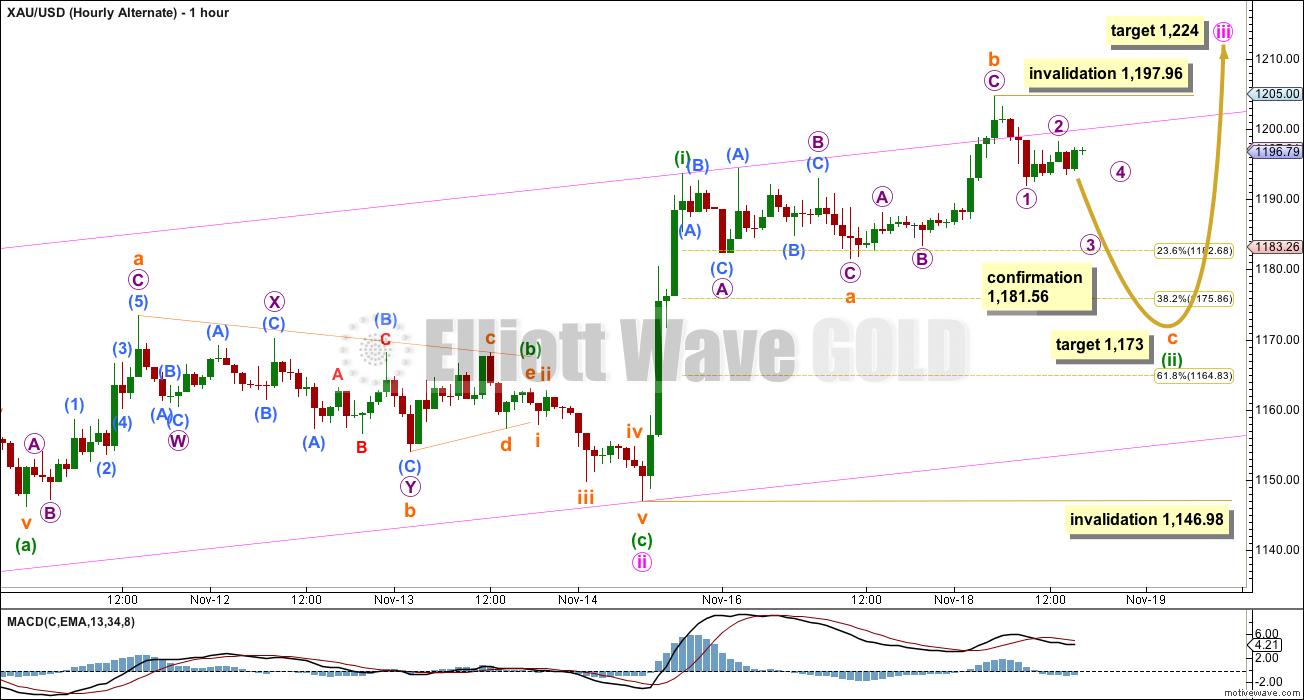
This alternate is identical to the main wave count right up to the end of minuette wave (i). Thereafter, I have moved the degree of labelling within minuette wave (ii) down one degree and I am looking at the possibility that it is not over and may continue as an expanded flat correction.
I am considering this alternate for two reasons:
1. The last upwards wave to 1,197.96 did not show an increase in upwards momentum.
2. If minuette wave (ii) is over as per the main hourly wave count then it was a rather shallow second wave correction.
However, this alternate has a lower probability for one main reason. If minuette wave (ii) is an expanded flat then within it subminuette wave b is a 191% correction of subminuette wave a. This is comfortably longer than the maximum common length for a B wave within a flat of 138%, but it is within the allowable limit of twice the length of the A wave. This wave count is considered as it is viable, but it has a lower probability. I would judge it to maybe have about a 30-40% probability today.
If price moves below 1,181.56 in the next 24 hours this alternate would be confirmed. At that stage I would expect to see a completed five wave structure downwards for subminuette wave c. Subminuette wave c would reach 2.618 the length of subminuette wave a at 1,173.
If this alternate is confirmed and the target is too high, I would expect downwards movement to find very strong support and not break below the lower edge of the pink base channel.
Minuette wave (ii) may not move beyond the start of minuette wave (i) below 1,146.98. If this invalidation point is passed the wave count would change probably at intermediate degree. At this stage I cannot see an alternate which allows for this price point to be passed at this time.
This analysis is published about 04:40 p.m. EST.
If price were to break below the pink channel I would certainly have to find an alternate to explain that.
I don’t expect that will happen.
But I’m still looking for an alternate.
From here I expect upwards movement to increase in momentum. I’m checking targets, they may change today.
*note: I’ve added you to the whitelist so that your comments should always appear immediately. I don’t know why Disquis didn’t do that after I’d approved your first comment. Disquis is funny like that sometimes.
Lara, is the confirmation number for continued upside movement supposed to be 1205, instead of 1197.96? I asked the same question under the video comments, but am repeating myself to make sure you see it. Thanks.
I’m so sorry, yes. I read the low not the high for that candle.
My bad.
I am having difficulty posting my comments. Need to know how post comments??
Last night I posted comment and it has not appeared.
Gold had false breakout above the pink channel and got back in the channel.
I had expected that this FBO will result in gold trending down to lower pink rail on hour chart.
If gold closes below 1180 today would your reconsider going back to original main wave count of Nov 17?
As usual nice analysis. In hour chart gold had false breakout and fell below the pink upper channel line. As a chart analyst would now expect price to drift to lower trail of the channel. It may confirm if price drifts below the side way candle below A. If price breaks below the pink trail out of the channel will EW counts change again and would negate the price projection of 1224?
Thanks.