
Another green candlestick and a new high fits expectations nicely.
Summary: I expect to see a strong increase in upwards momentum Monday / Tuesday. The short term target is the same at 1,251.
Click on charts to enlarge
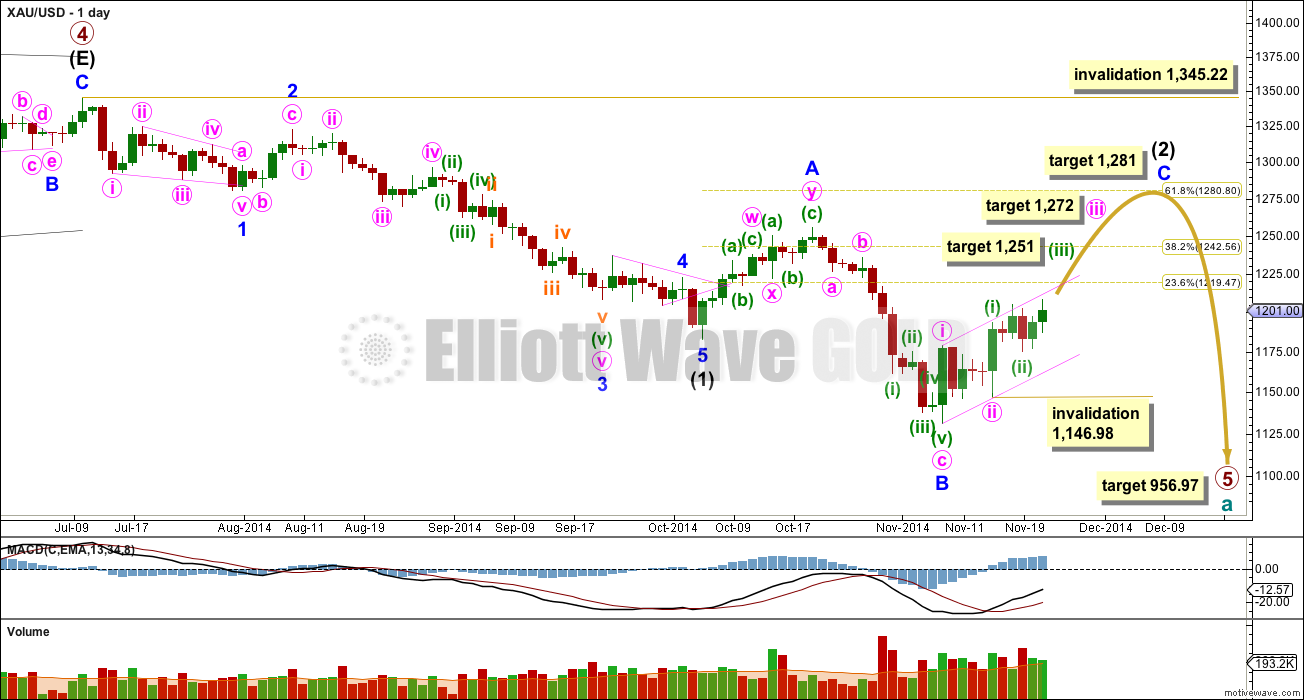
Primary wave 4 is complete and primary wave 5 is unfolding. Primary wave 5 may only subdivide as an impulse or an ending diagonal. So far it looks most likely to be an impulse.
Within primary wave 5 intermediate wave (1) fits perfectly as an impulse. There is perfect alternation within intermediate wave (1): minor wave 2 is a deep zigzag lasting a Fibonacci five days and minor wave 4 is a shallow triangle lasting a Fibonacci eight days, 1.618 the duration of minor wave 2. Minor wave 3 is 9.65 longer than 1.618 the length of minor wave 1, and minor wave 5 is just 0.51 short of 0.618 the length of minor wave 1. I am confident this movement is one complete impulse.
Intermediate wave (2) is an incomplete expanded flat correction. Within it minor wave A is a double zigzag. The downwards wave labelled minor wave B has a corrective count of seven and subdivides perfectly as a zigzag. Minor wave B is a 172% correction of minor wave A. This is longer than the maximum common length for a B wave within a flat correction at 138%, but within the allowable range of less than twice the length of minor wave A. Minor wave C may not exhibit a Fibonacci ratio to minor wave A, and I think the target for it to end would best be calculated at minute degree. At this stage I would expect intermediate wave (2) to end close to the 0.618 Fibonacci ratio of intermediate wave (1) just below 1,281.
Within minor wave C minute wave iii would reach 2.618 the length of minute wave i at 1,272. Within minute wave iii minuette wave (iii) would reach 1.618 the length of minuette wave (i) at 1,251.
Intermediate wave (1) lasted a Fibonacci 13 weeks. So far intermediate wave (2) has just completed its sixth week. I will expect it may continue for another two weeks at least to total a Fibonacci eight, and be 0.618 the duration of intermediate wave (1). However, it may be a little longer in duration than this.
The target for primary wave 5 at this stage remains the same. At 956.97 it would reach equality in length with primary wave 1. However, if this target is wrong it may be too low. When intermediate waves (1) through to (4) within it are complete I will calculate the target at intermediate degree and if it changes it may move upwards. This is because waves following triangles tend to be more brief and weak than otherwise expected. A perfect example is on this chart: minor wave 5 to end intermediate wave (1) was particularly short and brief after the triangle of minor wave 4.
Intermediate wave (2) may not move beyond the start of intermediate wave (1) above 1,345.22. I have confidence this price point will not be passed because the structure of primary wave 5 is incomplete because downwards movement from the end of the triangle of primary wave 4 does not fit as either a complete impulse nor an ending diagonal.
Draw a base channel about minor wave C: draw the first trend line from the start of minute wave i to the end of minute wave ii, then place a parallel copy on the end of minute wave i. Copy this pink channel over carefully to hourly charts. Minute wave iii should have the power to break above the upper edge of this channel. Along the way up downwards corrections should find support and not break below the lower edge of this channel. Base channels almost always work like this (note, almost always is not the same as always).
To see a prior example of an expanded flat correction for Gold on the daily chart, and an explanation of this structure, go here.
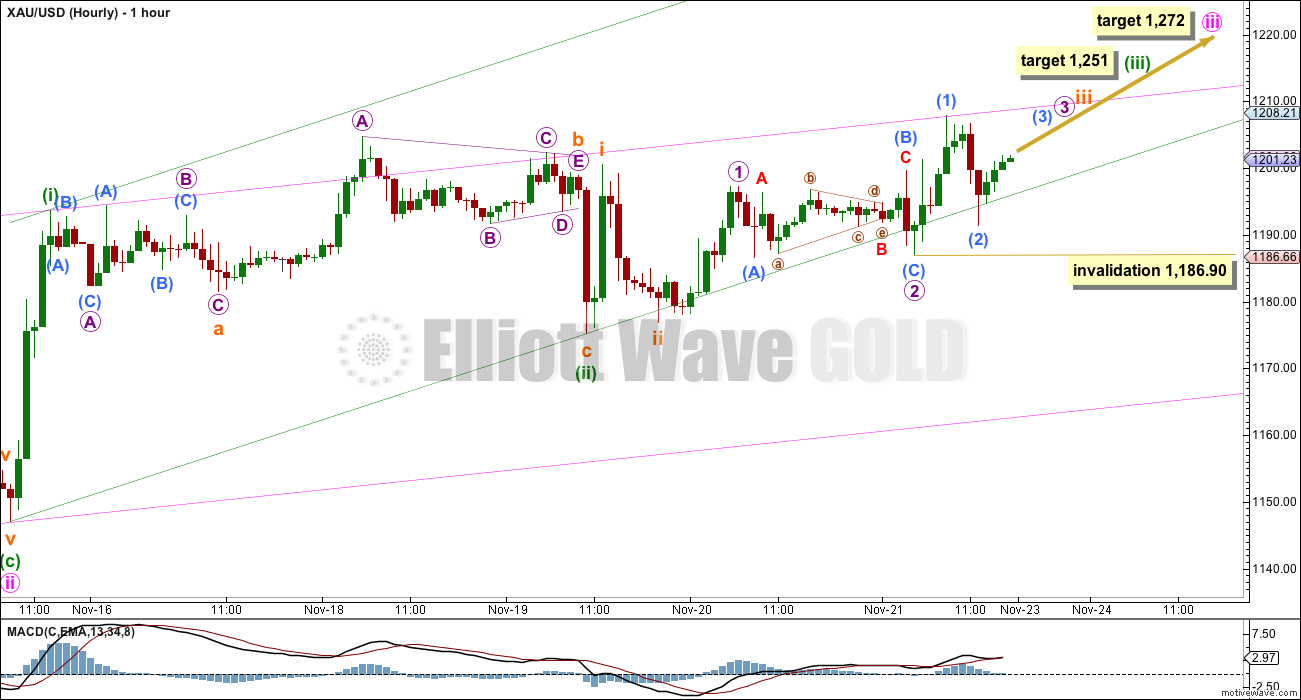
I am moving the degree of labelling within the middle of this third wave back up one degree. This latest upwards movement may only be a first wave within minuette wave (iii), or we may be about to move into the middle of minuette wave (iii) on Monday. Both degrees of labelling are valid. This degree of labelling now looks slightly more likely when I consider the target at 1,251.
Another reason for the change in degree of labelling is the rare running flat I am labelling for micro wave 2. I have checked subdivisions carefully on the five minute chart and this is how it subdivides. If the middle of a strong third wave is just ahead that would explain a running flat: the upwards pull of the third wave may have forced sub micro wave (C) to be very slightly truncated, and micro wave 2 a very rare running flat.
This degree of labelling sees a series of overlapping first and second waves, and there are now five. This may indicate a strong increase in upwards momentum is imminent. If upwards momentum does not increase strongly on Monday I may move the degree of labelling within minuette wave (iii) back down so that only subminuette wave i may be completing.
Upwards movement is struggling to break above the upper edge of the pink base channel. It should do so soon. When it does I would expect momentum to increase.
Downwards movement is finding support about the lower edge of the green base channel. It should continue to do so because a lower degree second wave correction should not breach a base channel drawn about a first and second wave one or more degrees higher. Sub micro wave (2) may not move beyond the start of sub micro wave (1) at 1,186.90.
If this invalidation point is passed then I would move the degree of labelling within minuette wave (iii) back down one degree and expect downwards movement is a second wave correction, and the invalidation point would move back down to 1,146.98.
When third waves begin with a series of overlapping first and second waves it is like the winding up of potential energy in a spring. When the middle of the third wave arrives the energy is released, and the movement can be explosive. It is very common to see third waves begin like this, and this wave count has a typical look.
This analysis is published about 05:53 p.m. EST.
? sorry, I’m totally missing something here.
If you want me to consider an alternate, please upload a chart. Click on the tiny button in the grey bar right below where you type in your comment, its on the left hand side.
Hi Lara, I had upload a chart, but it seems something did not work well. Now I am out of office (where I have the chart), tomorrow I will try again.
Thanks!
Gold is back down again below 1198.
If green wave id an impulse wave my concern is it really or some thing else is at play here. It appears time is running out for this move.
Lara’s hour chart has bottom green line. Gold is below that line. What is a level gold needs to cross this line and back in to the channel? Thanks in advance.
Hi Lara, this is what i would say in my last post……
What do you think about this, is it possible as alternate count ?
Thanks!
The resistance at $1205-$1208 is proving to be a tough nut to crack. This is also where the 50dma resides. Still hoping for that strong increase in momentum.
Today’s current resistance is 1198. This is the same level on Nov 21. Once gold over came this level it shot up to 1200.
Gold currently is below 1200 mark and battling 195. If it breaks 1195 soon it will go to 1186.???? may be ??? I just do not like it to be below 1200.
It is extremely unlikely that minor wave C will complete at the 0.236 Fibonacci ratio. That would be a huge truncation. I would judge that to be about 0.01%.
The 0.382 Fibonacci ratio is also a sizeable truncation. I would judge that to be only about 1% likely.
It would be 98.99% likely that C will move above the end of A at 1,255.40 to avoid a truncation because running flats are very rare. It it is truncated, it should not be by much at all.
The 0.618 Fibonacci ratio would be about 80% likely.
Lara, thanks I like getting the probabilities. Lay the probabilities out there, people can place their bets and assume responsibility for their decisions.
Thanks for the analysis today. Could you see possible that wave C will end at the Fibonacci 23.6% ratio as the overall weight of primary wave 5 pulling it down like you mentioned on prior updates. If so, what type of probability would you note at each level of the Fibonacci ratios up to 61.8%. Thanks!