
Upwards movement was expected, along with a strong increase in upwards momentum. This is not what happened. Price is moving sideways to complete a small red candlestick for Monday’s session.
Summary: The main wave count expects an imminent increase in upwards momentum to 1,251 which should now be met within two days. If momentum does not increase in the next 24 hours the new alternate hourly wave count may be correct. It too expects more upwards movement but it should complete an upwards sloping wedge and the short term target is only 1,218.
Click on charts to enlarge
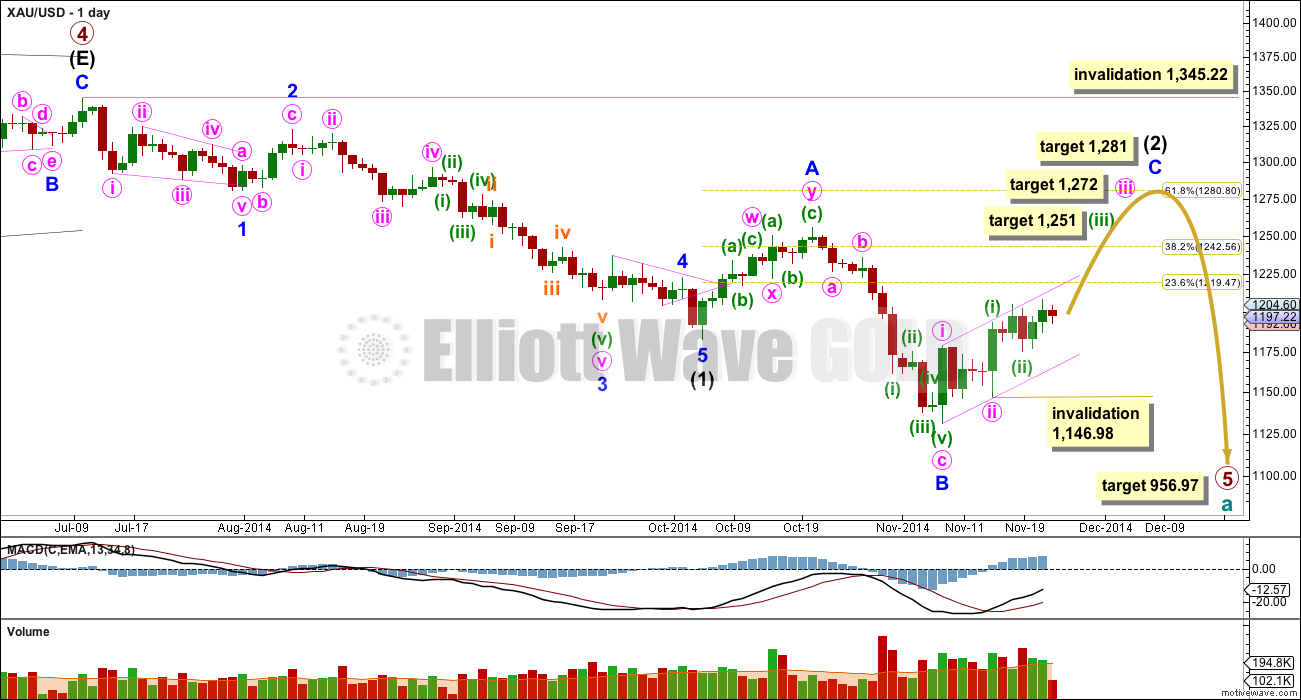
Primary wave 4 is complete and primary wave 5 is unfolding. Primary wave 5 may only subdivide as an impulse or an ending diagonal. So far it looks most likely to be an impulse.
Within primary wave 5 intermediate wave (1) fits perfectly as an impulse. There is perfect alternation within intermediate wave (1): minor wave 2 is a deep zigzag lasting a Fibonacci five days and minor wave 4 is a shallow triangle lasting a Fibonacci eight days, 1.618 the duration of minor wave 2. Minor wave 3 is 9.65 longer than 1.618 the length of minor wave 1, and minor wave 5 is just 0.51 short of 0.618 the length of minor wave 1. I am confident this movement is one complete impulse.
Intermediate wave (2) is an incomplete expanded flat correction. Within it minor wave A is a double zigzag. The downwards wave labelled minor wave B has a corrective count of seven and subdivides perfectly as a zigzag. Minor wave B is a 172% correction of minor wave A. This is longer than the maximum common length for a B wave within a flat correction at 138%, but within the allowable range of less than twice the length of minor wave A. Minor wave C may not exhibit a Fibonacci ratio to minor wave A, and I think the target for it to end would best be calculated at minute degree. At this stage I would expect intermediate wave (2) to end close to the 0.618 Fibonacci ratio of intermediate wave (1) just below 1,281.
Within minor wave C minute wave iii would reach 2.618 the length of minute wave i at 1,272. Within minute wave iii minuette wave (iii) would reach 1.618 the length of minuette wave (i) at 1,251.
Intermediate wave (1) lasted a Fibonacci 13 weeks. So far intermediate wave (2) has just begun its seventh week. I will expect it may continue for another two weeks at least to total a Fibonacci eight, and be 0.618 the duration of intermediate wave (1). Alternatively, intermediate wave (2) may last a total Fibonacci 13 weeks equalling the duration of intermediate wave (1).
The target for primary wave 5 at this stage remains the same. At 956.97 it would reach equality in length with primary wave 1. However, if this target is wrong it may be too low. When intermediate waves (1) through to (4) within it are complete I will calculate the target at intermediate degree and if it changes it may move upwards. This is because waves following triangles tend to be more brief and weak than otherwise expected. A perfect example is on this chart: minor wave 5 to end intermediate wave (1) was particularly short and brief after the triangle of minor wave 4.
Intermediate wave (2) may not move beyond the start of intermediate wave (1) above 1,345.22. I have confidence this price point will not be passed because the structure of primary wave 5 is incomplete because downwards movement from the end of the triangle of primary wave 4 does not fit as either a complete impulse nor an ending diagonal.
Draw a base channel about minor wave C: draw the first trend line from the start of minute wave i to the end of minute wave ii, then place a parallel copy on the end of minute wave i. Copy this pink channel over carefully to hourly charts. Minute wave iii should have the power to break above the upper edge of this channel. Along the way up downwards corrections should find support and not break below the lower edge of this channel. Base channels almost always work like this (note, almost always is not the same as always).
To see a prior example of an expanded flat correction for Gold on the daily chart, and an explanation of this structure, go here.
*Note: I am aware (thank you to members) that other Elliott wave analysts are calling now for the end of primary wave 5 at the low at 1,131. I am struggling to see how this downwards movement fits as a five wave impulse: I would label the second wave within it (labelled minor wave 2) intermediate wave (1), and the fourth wave intermediate wave (4) (labelled as a double zigzag for minor wave A). Thus a complete impulse down would have a second wave as a single zigzag and a fourth wave as a double zigzag, which would have inadequate alternation. Finally, the final fifth wave down would be where I have minor wave B within intermediate wave (2). This downwards wave has a cursory count of seven, and I do not think it subdivides as well as an impulse as it does as a zigzag. If any members come across a wave count showing possible subdivisions of a complete primary wave 5 I would be very curious to see it.
Main Hourly Wave Count
At this stage the sideways movement for Monday has reduced the probability of this wave count, but it remains viable and it remains my main wave count. I would judge it to have about a 60-70% probability today.
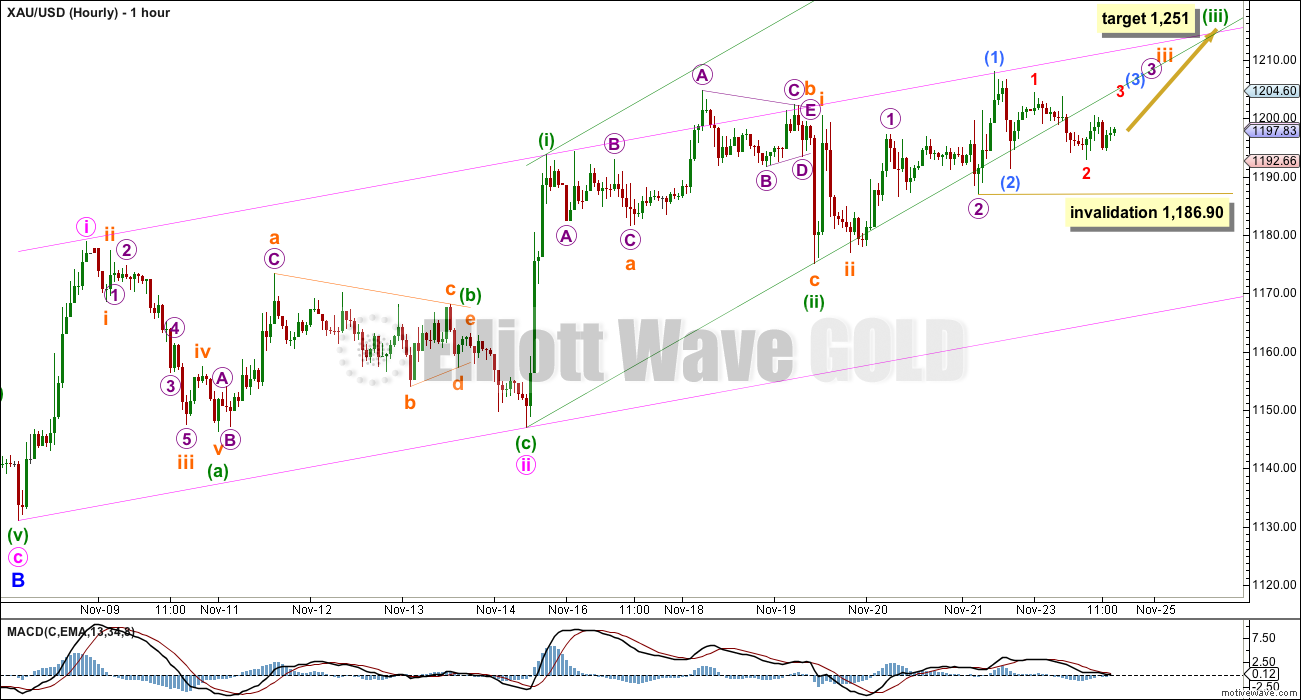
I am zooming out to show the entire hourly structure of the start of minor wave C.
This main wave count sees minor wave C as an impulse. Within it minute waves i and ii are complete. Within minute wave iii minuette waves (i) and (ii) are complete. At 1,251 minuette wave (iii) would reach 1.618 the length of minuette wave (i).
The pink channel is a base channel about minute waves i and ii. Lower degree second wave corrections should not break below the lower pink trend line.
The green channel is a base channel about minuette waves (i) and (ii). A lower degree second wave correction (minuscule wave 2) has now broken below the lower green trend line and this reduces the probability of this wave count today. Base channels almost always work well for Gold, but on occasion they do not behave as expected. This is possible, but a little unusual.
This wave count must see an increase in upwards momentum over the next 24 hours or I may discard it. The middle of this third wave should have the power to break above both base channels with an almost vertical rise.
Within the middle of this third wave sub micro wave (2), if it continues sideways, may not move beyond the start of sub micro wave (1) below 1,186.90.
For both this main and alternate hourly wave counts I have checked the subdivisions on the five minute chart carefully: fives subdivide as fives and threes subdivide as threes.
Alternate Hourly Wave Count
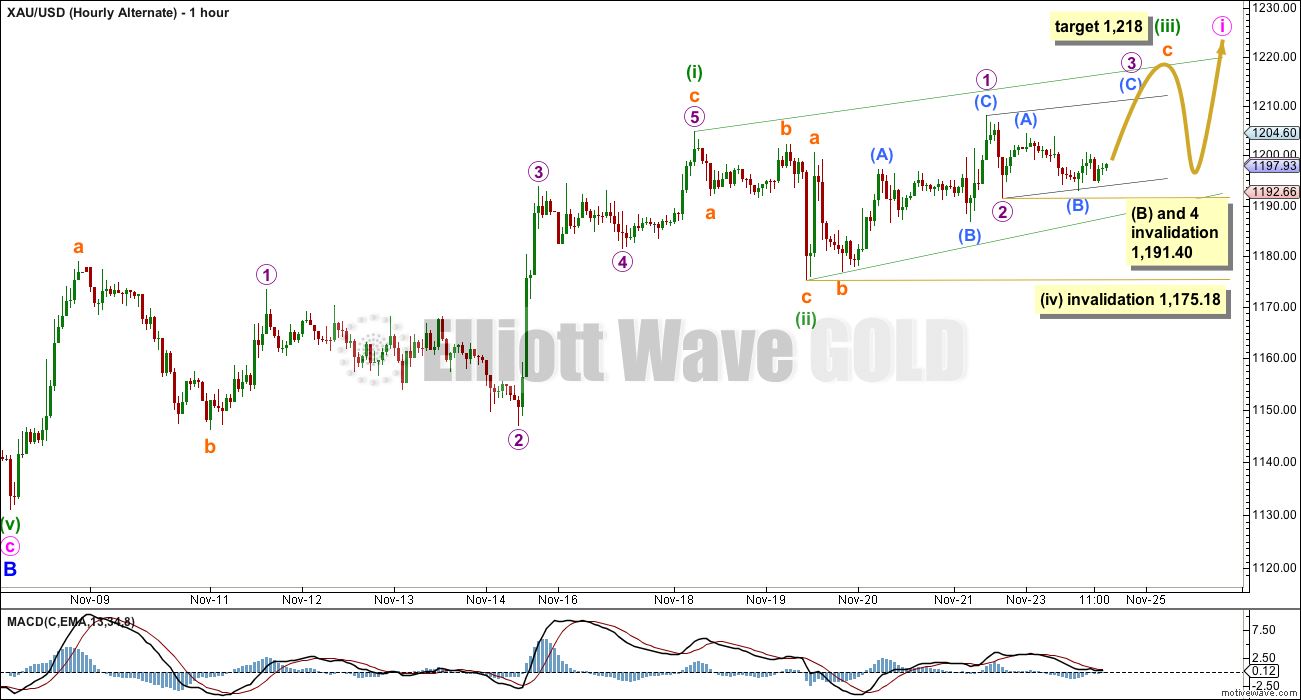
Alternatively, I am considering the possibility that minute wave i is not over. Upwards movement looks like a rising wedge which may be a leading diagonal for minute wave i.
Leading diagonals in first wave positions are not exactly rare, but they are not very common either. An impulse is much more common. This slightly reduces the probability of this alternate.
Within diagonals the second and fourth waves are normally very deep, between 0.66 to 0.81 of the first and fourth wave. Here minuette wave (ii) is only 0.40 of minuette wave (i). This further reduces the probability of this alternate. I would judge it to have about a 30-40% probability today.
Leading diagonals require sub waves 2 and 4 to be zigzags. Sub waves 1, 3 and 5 are most commonly zigzags but may also be impulses. Here I am seeing minuette waves (i) and (iii) as zigzags because that is how they subdivide. *Note: diagonals are the only structures where you will see a third wave labelled as anything other than an impulse.
I would expect this possible diagonal to be contracting because that is how it looks so far, and contracting types are more common than expanding. Within the third wave of this diagonal subminuette wave c itself looks like a possible diagonal. Subminuette wave c must subdivide as a five wave structure, and ending diagonals are more common than leading.
Within the zigzag of minuette wave (iii) at 1,218 subminuette wave c would reach 1.618 the length of subminuette wave a.
Within the ending diagonal of subminuette wave c all the sub waves of micro waves 1 through to 5 must subdivide as zigzags. Within micro wave 3, sub micro wave (B) may not move beyond the start of sub micro wave (A) below 1,191.40. When micro wave 3 up is complete (and it must move above the end of micro wave 1 at 1,207.95) then a zigzag down for micro wave 4 should overlap back into micro wave 1 price territory but may not move beyond the end of micro wave 2 below 1,191.40.
When minuette wave (iii) zigzag up is complete then the following correction for minuette wave (iv) is most likely to be deep, and must overlap back into minuette wave (i) price territory below 1,204.77. Minuette wave (iv) may not move beyond the end of minuette wave (ii) below 1,175.18.
Overall this alternate wave count, despite its lower probability, does explain the lack of momentum very nicely. It expects generally upwards movement, but slow and choppy.
If this wave count proves to be correct, that is if the upwards movement completes a clear diagonal structure for minute wave i, then the implications are important. When leading diagonals unfold in first wave positions they are very often followed by especially deep second wave corrections. Only after a deep correction for minute wave ii is complete would I then expect a strong upwards third wave.
This analysis is published about 04:27 p.m. EST.
I see what you’re doing there… yes, that looks good.
I think I will chart that and check the subdivisions. Then I may use this idea to adjust the wave count which is now today’s hourly alternate (was yesterday’s main hourly wave count)
(2). This downwards wave has a cursory count of seven… Yes, i tried to count 5 on a 15min chart and also had difficulty, unless you put in a running flat into the mix. This is the problem with elliot wave … You could argue a rare running flat and everything fits. Albeit, i agree it fits better as a three. In any case. If 5 were over as some suggest, then this would be an awfully choppy start to their argument. (It’s choppy for an expanded flat idea let alone a new trend change).
You’ve correctly identified the core difficulty with EW.
You can label almost anything a three or a five, as you want to see it. And often a movement is unclear. Only occasionally is it very clearly one or the other.
You could put a running flat in there and it would fit. You could say it fits as a five on the hourly chart but looks like a three on the daily chart.
At the end of the day you have to apply experience and try to find the “right look”.
The objective is to find out what is the right wave count, and to avoid applying a wave count which gives you the direction you desire. If that makes sense?
Lara, On hour chart you have invalidation of (B) as 191.4. Gold briefly traded below to 1189.40. Is that a significant to current wave count? I know the day is not over yet.
Thanks.
No worries.
I will reply because yes, that invalidation point on the hourly alternate was passed. It does change the wave count there but only slightly.
the chart
Hi Lara,
this is the chart that was missing in my post yesterday….
What do you think about it ?….now seems to developp a B wave as triangle.
Sorry but I have no chance to use different labels and colored like in your chart
Attached is a gold line chart from the top in 2011. It will be nice if if all the wave counts as unfolded over the past 4 years. I have marked ? for major waves to be identified. It will be great help to show all the counts on one chart. If you can post a similar chart showing these major and intermediate waves.
Gold is trying to once again break out above 1200. Hopefully it will rocket above 1215 today!!!
Thanks.
On the right hand side bar of the website, under “categories”, you will find “Gold Historical”. This is where all analysis which includes weekly or monthly charts is found. The last one is this: http://elliottwavegold.com/2014/09/gold-elliott-wave-technical-analysis-12th-september-2014/