
A small red candlestick on the daily Elliott wave chart changes the wave count at the hourly chart level. The overall mid term target remains the same, and the trend is still upwards.
Summary: This sideways movement is most likely very close to completion. Overall the trend remains up. When sideways movement is done the next move from Gold should be up and is likely to show a clear strong increase in upwards momentum. The mid term target at 1,262 remains the same.
Click on charts to enlarge
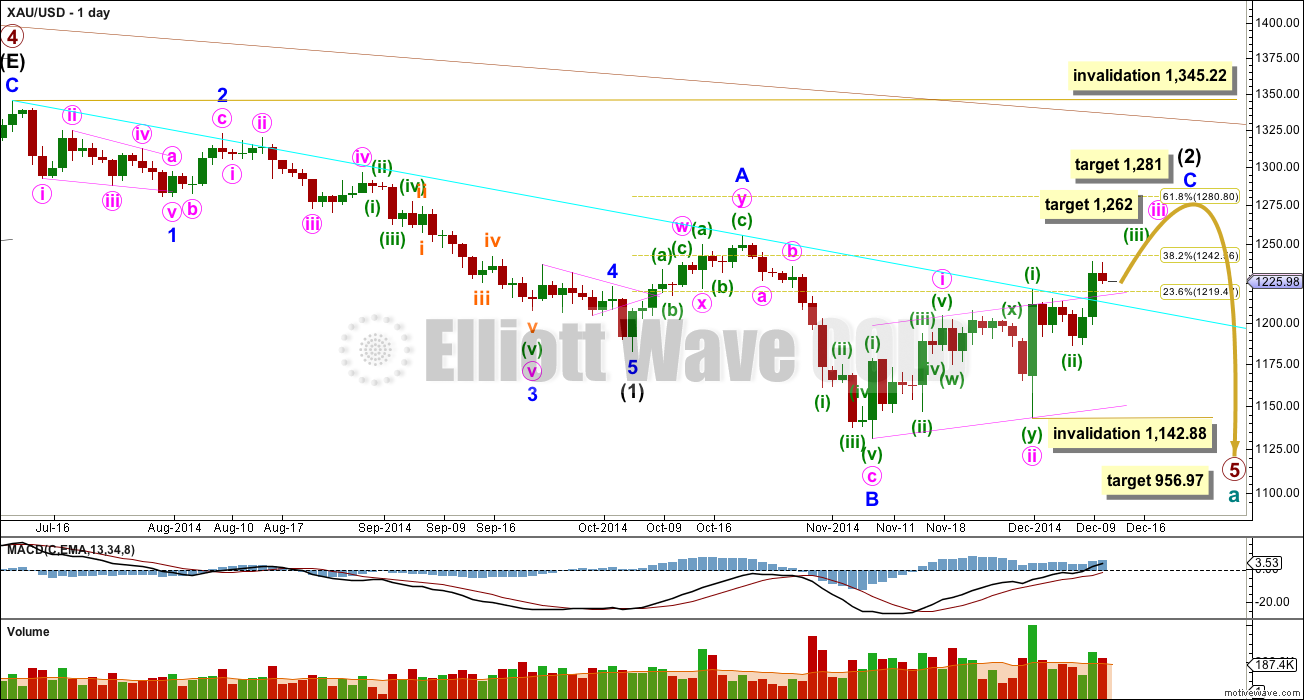
Primary wave 4 is complete and primary wave 5 is unfolding. Primary wave 5 may only subdivide as an impulse or an ending diagonal. So far it looks most likely to be an impulse.
Within primary wave 5 intermediate wave (1) fits perfectly as an impulse. There is perfect alternation within intermediate wave (1): minor wave 2 is a deep zigzag lasting a Fibonacci five days and minor wave 4 is a shallow triangle lasting a Fibonacci eight days, 1.618 the duration of minor wave 2. Minor wave 3 is 9.65 longer than 1.618 the length of minor wave 1, and minor wave 5 is just 0.51 short of 0.618 the length of minor wave 1. I am confident this movement is one complete impulse.
Intermediate wave (2) is an incomplete expanded flat correction. Within it minor wave A is a double zigzag. The downwards wave labelled minor wave B has a corrective count of seven and subdivides perfectly as a zigzag. Minor wave B is a 172% correction of minor wave A. This is longer than the maximum common length for a B wave within a flat correction at 138%, but within the allowable range of twice the length of minor wave A. Minor wave C may not exhibit a Fibonacci ratio to minor wave A, and I think the target for it to end would best be calculated at minute degree. At this stage I would expect intermediate wave (2) to end close to the 0.618 Fibonacci ratio of intermediate wave (1) just below 1,281.
Intermediate wave (1) lasted a Fibonacci 13 weeks. If intermediate wave (2) exhibits a Fibonacci duration it may be 13 weeks to be even with intermediate wave (1). Intermediate wave (2) has just begun its ninth week, and so it may continue now for another five weeks in total.
So far within minor wave C the highest volume is on an up day. This supports the idea that at this stage the trend is up.
The upper maroon trend line is the upper edge of the Elliott channel drawn about this impulse on the weekly chart, and copied over here to the daily chart. See the most recent Gold Historic Analysis to see how this trend line is drawn on the weekly chart. If minor wave C lasts long enough it should find extremely strong resistance at that trend line, I would not expect that trend line to be broken while primary wave 5 is incomplete.
The aqua blue trend line is a simple TA trend line which is showing where price is currently finding resistance. The power of the middle of the upcoming third wave should break above this trend line. If this trend line begins to be breached that may be the earliest indication that the main hourly wave count is correct today. I am copying this trend line over to the main hourly wave count today.
The target for primary wave 5 at this stage remains the same. At 956.97 it would reach equality in length with primary wave 1. However, if this target is wrong it may be too low. When intermediate waves (1) through to (4) within it are complete I will calculate the target at intermediate degree and if it changes it may move upwards. This is because waves following triangles tend to be more brief and weak than otherwise expected. A perfect example is on this chart: minor wave 5 to end intermediate wave (1) was particularly short and brief after the triangle of minor wave 4.
Intermediate wave (2) may not move beyond the start of intermediate wave (1) above 1,345.22. I have confidence this price point will not be passed because the structure of primary wave 5 is incomplete because downwards movement from the end of the triangle of primary wave 4 does not fit as either a complete impulse nor an ending diagonal.
To see a prior example of an expanded flat correction for Gold on the daily chart, and an explanation of this structure, go here.
Main Hourly Wave Count
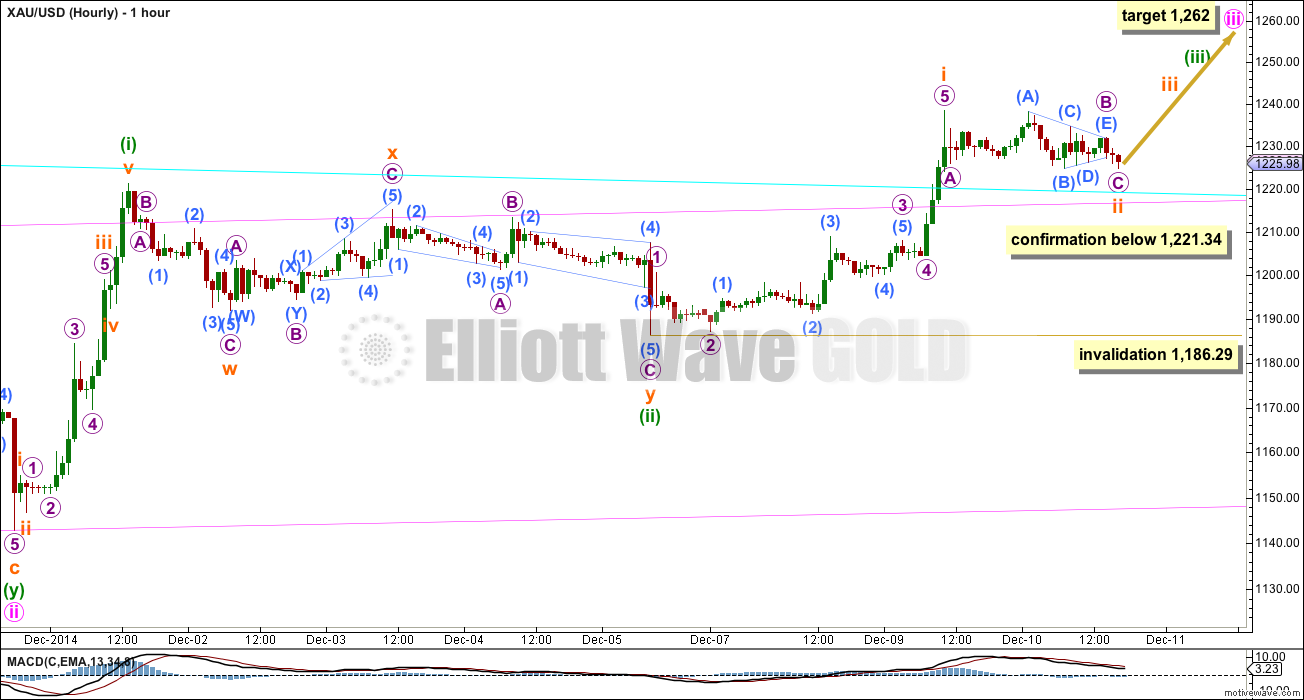
My labelling of the structure of minuette wave (iii) yesterday was wrong. Because current sideways movement shows clearly on the daily chart this is not micro wave 4, and may be a second wave correction within minuette wave (iii).
Only subminuette wave i within the middle of the third wave may be complete. This would expect that minuette wave (iii) would be extending. It is very common, extremely common, for third waves to extend. When they do their subdivisions often show up nice and clear on the daily chart. So it is entirely possible that subminuette wave ii is showing on the daily chart.
If price moves below 1,221.34 then this would be my only hourly wave count.
However, it may be that the upper edge of the pink base channel about minute waves i and ii (copied over to hourly charts from the daily chart) is strong enough to provide support to downwards movement, and force this current correction to be very shallow.
I would judge this main hourly wave count to have a greater probability, maybe about 60% today, because it expects to see the most likely situation of an extending third wave with stronger momentum than the first wave.
Subminuette wave ii may not move below the start of subminuette wave i at 1,186.29.
When subminuette wave ii is complete then the next movement for Gold should be a third wave of a third wave of a third wave. It should show a clear strong increase in upwards momentum.
Minute wave iii would reach 1.618 the length of minute wave i at 1,262. This target still remains the same.
The structure and subdivisions are seen for both hourly wave counts in exactly the same way, only the degree of labelling for the most recent movement is different.
Alternate Hourly Wave Count
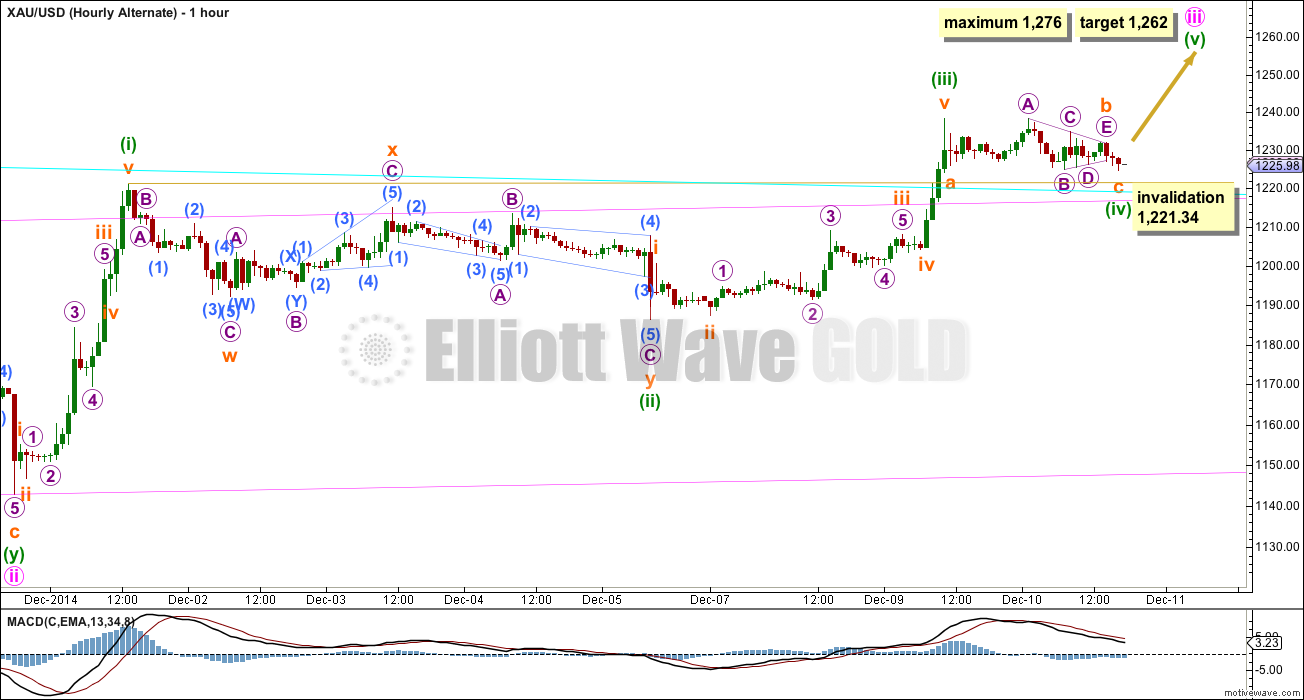
This wave count simply moves the degree of labelling within minuette wave (iii) all up one degree. What if it is over and this sideways movement is minuette wave (iv)?
If minuette wave (iii) is over and this sideways movement is minuette wave (iv) then it must be a very shallow correction so that it does not move back down into minuette wave (i) price territory below 1,221.34. If this price point is breached this alternate wave count will be invalidated and the main count will be correct.
If minuette wave (iv) is unfolding as a zigzag then it shows some alternation with the double zigzag of minuette wave (ii), but both are of the zigzag family and both are shallow corrections. The alternation is inadequate, which points to the main wave count being more likely. I would judge this alternate to have about a 40% probability at best.
If minuette wave (iii) is over then it did not manage to have stronger upwards momentum than minuette wave (i). Sometimes third waves are not stronger than first waves, but this is unusual. This also reduces the probability of this alternate wave count today.
If minuette wave (iii) is over then it was 3.60 longer than 0.618 the length of minuette wave (i). This limits minuette wave (v) to no longer than equality in length with minuette wave (iii) at 1,276.
Minute wave iii would reach 1.618 the length of minute wave i at 1,262. This target still remains the same for both wave counts. The mid term expectation is exactly the same.
This analysis is published about 06:04 p.m. EST.
Good Morning Lara,
in Oil we have reached more than your target. Could you please update this chart?
Thank you very much.
Ursula
Okay. Assume the trend remains the same, until a channel about this move is breached by upwards movement.
It appears that Subminuette wave ii is complete and Subminuette wave iii has begun. At 15:00 EST, it back tested the breakout channel. Judging from Lara’s post yesterday, I was expecting this move up to be much stronger though.
sandeep_k
Terrific chart, never seen one like that, thanks,
Yes I was also expecting much stronger wave and higher peak. Glad we did get some rally as miners were down a lot at market open before rally and then miners ended day lower than the close yesterday and as low as open today, and I sold all my miners. I am awaiting Lara’s report and if get it before after market closes at 7:00 pm and expecting strong rally Friday than will buy my miners back tonight while they are still down.
Good news for the U.S. Dollar I should have said.
Good news came out just as it started up. Then it did a turn. Good retail sales, now talk of earlier rate increase.
I am not to sure about this wave (ii) completion???? Of it is in impulse wave like Lara wrote it should have momentum to rise.
papudi
There is no way a correction wave would have bottomed at 1216 them did 4 peak mini rallies today.
Re-read her forecast.
When subminuette ii sideways movement is done it is
likely the next move from Gold should be a third wave of a third wave of a third wave and up and is likely to show a clear strong increase in upwards momentum.Today had 4 increases in upwards momentum. 1226, 1229, 1232, 1230
Next I believe this has already started.
Then the following sideways movement for minuette wave (iv) should show up on the daily chart as a sideways consolidation phase lasting at least two days maybe later, and it may be very deep. It should find support at about the 1,218 to 1,215 zone.
I sold everything in rallies today and looking to buy cheaper in minuette wave (iv) correction and hold for next higher target.
Submiuette wave 3 cannot be over as has not exceeded high of subminuette wave 1 at 1239.
We do not know wave (ii) is complete or know.
Lara said this wave will be shallow. Again it appeared on a daily chart as Doji..
Why guess this evening will get the report.
There is a gold mini rally right now 2:30 pm, dont know about tomorrow.
Looks like a rally starting again now 2:25 pm
Is expectation of this impulse wave to be over is today or tomorrow?
I hope gold does not get stuck another day of side way movement like last two days.
Gold need to go thru these aqua and red line on spot gold chart from Kitco.
AND close above 1235.
papudi you seem to know Elliott Wave. Have we done a 5 wave count today since 10:00 am bottom? When I look at some charts it looks like it did and wave 5 peak was at 12:12 pm? Is that correct or are we in a correction and still about to finish this rally today. I am not talking about 1262 or 1281 just this rally for today? I want to exit at a high today and not be stuck in minuette (iv) down a few days?
Clearly it looks like good selling times were at 1229 at 11:35 am or else at 1232 at 12:16 pm.
Is there another wave up today or have all 5 wave counts finished for just today’s rally. Anyone please?
From chart it appears gold just finish wave1 up and is just completed wave 2 correction at 1226 retested breakout.
It now appears to be in a wave 3 that should take it to 1240.
These are micro waves.
Can somebody please do a quick wave count on gold wave now so we know when we are in 5th wave of minuette (iii) today and time to exit at next peak today, Or is it done already
Gold double bottomed at 1216 at 10:05 am and was already up $11 by 10:31. I think that signaled the end of minuette wave (iii). Followed by “3rd of a 3rd of a 3rd wave firing up it’s thursters for today’s rally. Or else a bunch of gold and miners bottom feeders jumped in as soon as they didn’t have to catch a falling knife to buy gold. I did buy more GDX at 9:38 at a discount while there was blood in the streets and people were dumping their gold and running for their lives. All thanks to Lara providing the inside scoop on gold’s Elliott Wave projections and the support systems in place for gold’s rally this week. Of course I will sell all at the next top this week hopefully today and I’ll safely from the sidelines watch minuette wave (iv) bottom and be ready to buy again at a great price, where cash is king. Prosperous trading.
Correction to my comment above. I think that 1216 at 10:05 am signaled the end of the second wave correction within minuette wave (iii), and the start a new wave way up which I believe just started at 10:05 am.
“When subminuette wave ii is complete then the next movement for Gold should be a third wave of a third wave of a third wave. It should show a clear strong increase in upwards momentum.”
What was the key to know that wave (ii) ended at that moment?
I need to learn to identify these points.
9:00 am EST Gold hit support zone 1218 – 1215 pink and aqua blue lines on hourly chart Lara said it would be strong zone in video and repeated that daily this week not the exact number but those trend lines and then a double bottom a good sign not 100% and patience.
Well executed trade and great plan. Looking to go cash once this is over at 1260.
Yes Lara’s insight has helped me as well. Otherwise I was clueless.
Correction before 1260, she didn’t give a number I will just watch about 1245 and up
There are three price points need to be breached as I see it.
Of course holding support here 1218-1215.
Next gold need to trade above 1220. Then cross 1226 low of yesterday. Then cross 1230 the apex of triangle.
Then wave (iii) 3rd of 3rd of 3rd will power ahead.
9:00 am EST Gold hit support zone 1218 – 1215 pink and aqua blue lines on hourly chart and we should be going up from here. Building our way back up to next high minuette wave (iii) then minuette wave (iv) multi-day consolidation then up to 1,262 then correct.
Even the longer bigger correction coming up minuette wave (iv) should find support here. Still invalidation is 1,186.29 so this wave count is valid above that.
Hi Lara,
if subminuette iii will be equal to sub i ( 52,00 usd ) and considering that after this there will be sub iv, sub v, minuette (iv), minuette (v)……the target for minute wave iii at 1262 do not you seem too low ?
Thanks!
Any idea where the wave (ii) will end based on Fib relationship?
Gold testing the aqua line breakout and is above the price point. Now gold to move above the apex of the triangle at 1230.
Lara, there is not mention of a target for minuette wave (iii) except in the video you say there is no target for minuette wave (iii). December 9th you had, “1,245 is the closest I can estimate for a target for minuette wave (iii) for you, and we will have to draw trend channels to show when it is done.”
Does that still apply and is 1,245 in the ballpark?
Richard
What happens next to wave count? The wave orange (ii) will be labeled to new low?
At what price point gold declares wave (ii) is complete?
Now gold should pull up fast and furious to upside if the third of third of the third wave is starting.
I hope gold does not sink to test 1186????
3:36 am EST gold went below 1,221.34
Confirming that we use the Main Hourly Wave Count – “If price moves below 1,221.34 then this (MAIN) would be my only hourly wave count.”
Hi Lara, on my platform I do not have a red daily candlestick, but green ( the daily open is 1229,06 and daily close is 1229,48 ).
aleforex
Check stockcharts they show a red candlestick.
Gold closed down -$6.50 (-.53%)
http://stockcharts.com/h-sc/ui?s=%24gold
Thanks Richard!
Lara, I prefer the alternate because minuette i was so powerful (almost $80 in price). It is not surprising to see minuette iii shorter than i and subsequently minuette v. This fits the $1262 target nicely.
Hi Lara- In reply to Richard you wrote: We’re stuck in a fourth wave now. But it has to be shallow. The invalidation point is REALLY close by at 1,221.34. And invalidation has to be 1186.29.
The hourly chart above notes confirmation below 1221.34.
Is this for alternate wave count? I get it.
Thanks.
My first reply to Richard (which is exactly as you have quoted) was too quick. I spent more time on the hourly chart and swapped my hourly wave counts over; originally I was going to have the alternate as the main and vice versa.
So I replied again after that to Richard with: “Actually Richard, after further analysis the invalidation point has to be at 1,186.29.”
Lara,
You are the Calm in the Storm.
I feel better after reading your updates and watching your video, They are an important highlight of my day.
Thanks for your help and your professionalism.