
Downwards movement is finding support perfectly at the aqua blue trend line on the daily chart. The Elliott wave count remains valid and the same.
Summary: I expect a short sharp upwards thrust on Monday to 1,247. If this target is wrong it may be too low.
Click on charts to enlarge
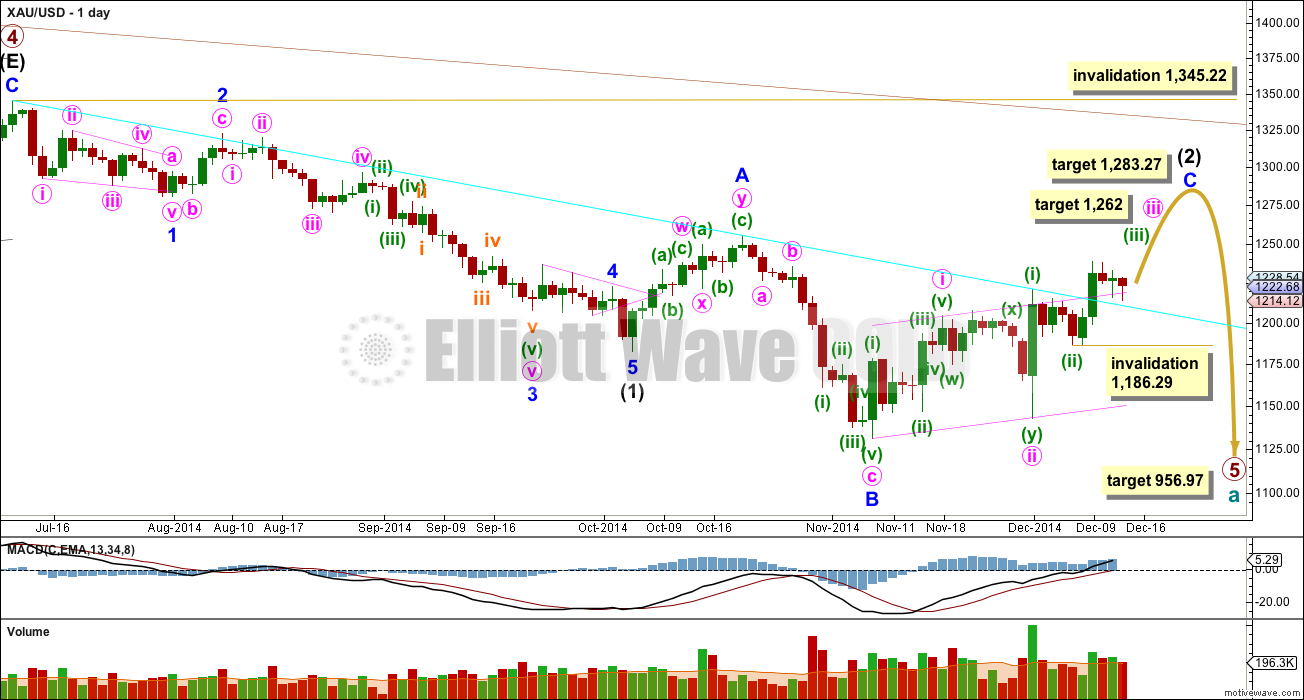
Primary wave 4 is complete and primary wave 5 is unfolding. Primary wave 5 may only subdivide as an impulse or an ending diagonal. So far it looks most likely to be an impulse.
Within primary wave 5 intermediate wave (1) fits perfectly as an impulse. There is perfect alternation within intermediate wave (1): minor wave 2 is a deep zigzag lasting a Fibonacci five days and minor wave 4 is a shallow triangle lasting a Fibonacci eight days, 1.618 the duration of minor wave 2. Minor wave 3 is 9.65 longer than 1.618 the length of minor wave 1, and minor wave 5 is just 0.51 short of 0.618 the length of minor wave 1. I am confident this movement is one complete impulse.
Intermediate wave (2) is an incomplete expanded flat correction. Within it minor wave A is a double zigzag. The downwards wave labelled minor wave B has a corrective count of seven and subdivides perfectly as a zigzag. Minor wave B is a 172% correction of minor wave A. This is longer than the maximum common length for a B wave within a flat correction at 138%, but within the allowable range of twice the length of minor wave A. Minor wave C may not exhibit a Fibonacci ratio to minor wave A, and I think the target for it to end would best be calculated at minute degree. At this stage I would expect intermediate wave (2) to end close to the 0.618 Fibonacci ratio of intermediate wave (1) at 1,283.27 (*Note: the Fibonacci retracement tool on Motive Wave is calculating the Fibonacci ratios wrong, so I have removed it and I’ll do this manually).
Intermediate wave (1) lasted a Fibonacci 13 weeks. If intermediate wave (2) exhibits a Fibonacci duration it may be 13 weeks to be even with intermediate wave (1). Intermediate wave (2) is now at the end of its ninth week, and so it may continue now for another four weeks in total.
So far within minor wave C the highest volume is on an up day. This supports the idea that at this stage the trend is up.
The upper maroon trend line is the upper edge of the Elliott channel drawn about this impulse on the weekly chart, and copied over here to the daily chart. See the most recent Gold Historic Analysis to see how this trend line is drawn on the weekly chart. If minor wave C lasts long enough it should find extremely strong resistance at that trend line, I would not expect that trend line to be broken while primary wave 5 is incomplete.
The aqua blue trend line is a simple TA trend line which is showing where price is currently finding (*edited) support. The power of the middle of the upcoming third wave has broken above this trend line.
The target for primary wave 5 at this stage remains the same. At 956.97 it would reach equality in length with primary wave 1. However, if this target is wrong it may be too low. When intermediate waves (1) through to (4) within it are complete I will calculate the target at intermediate degree and if it changes it may move upwards. This is because waves following triangles tend to be more brief and weak than otherwise expected. A perfect example is on this chart: minor wave 5 to end intermediate wave (1) was particularly short and brief after the triangle of minor wave 4.
Within minor wave C now the third wave is underway. Within minuette wave (iii) no second wave correction may move beyond its start below 1,186.29.
Intermediate wave (2) may not move beyond the start of intermediate wave (1) above 1,345.22. I have confidence this price point will not be passed because the structure of primary wave 5 is incomplete because downwards movement from the end of the triangle of primary wave 4 does not fit well as either a complete impulse nor an ending diagonal.
To see a prior example of an expanded flat correction for Gold on the daily chart, and an explanation of this structure, go here.
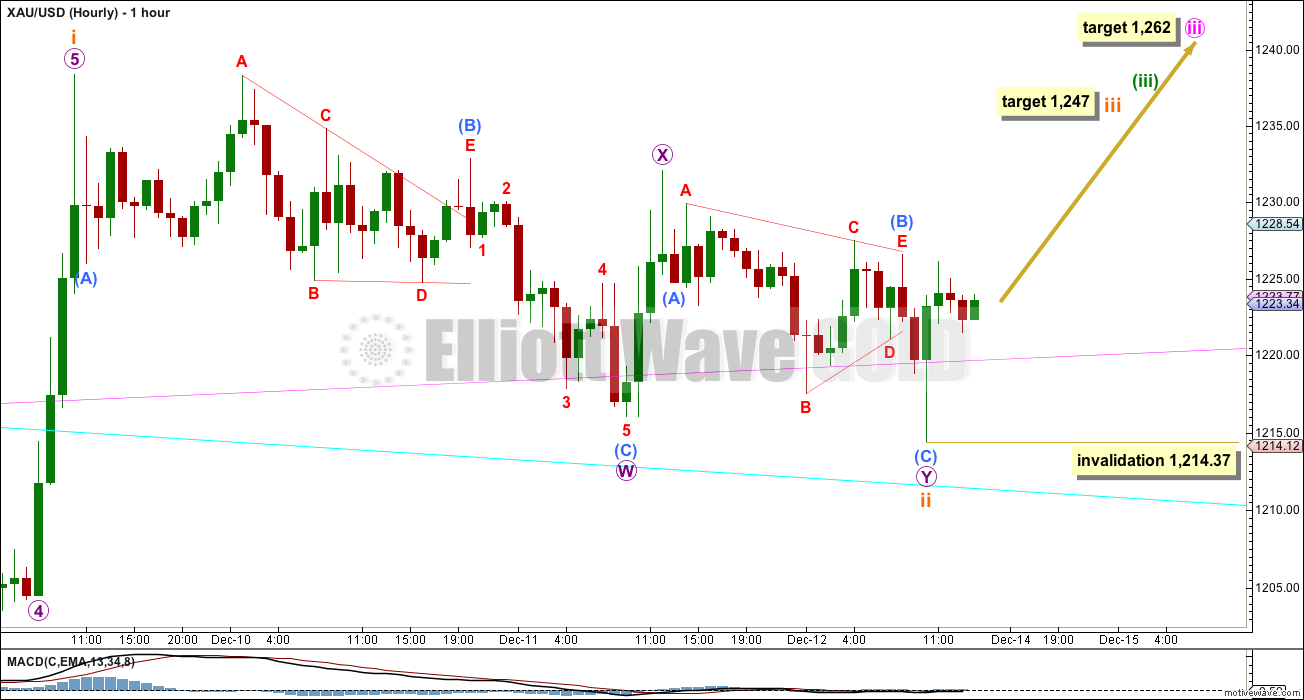
The second wave continued further as a double zigzag which was allowed for. We now have a series of three overlapping first and second waves, and interestingly each second wave correction subdivides best as a double zigzag, and each second wave correction is more brief than the one before it.
Minute wave ii was a deep 84% double zigzag lasting nine days. Minuette wave (ii) was a shallow 45% double zigzag lasting four days. Subminuette wave ii is now a shallow 45% double zigzag lasting three days.
I am more confident today that subminuette wave ii is over. On the five minute chart the first wave up from the low labelled subminuette wave ii at 1,214.37 subdivides perfectly as a five wave impulse.
At 1,247 subminuette wave iii would reach 0.618 the length of subminuette wave i. This target may be met on Monday with a short sharp upwards thrust for the middle of this third wave. If this target is wrong then it may be too low; the middle of the third wave may be longer. At this stage I am only able to calculate the target at subminuette wave degree.
Within subminuette wave iii micro wave 2 may not move beyond the start of micro wave 1 below 1,214.37.
Copy the aqua blue trend line over to the hourly chart. It looks like downwards movement is finding support very close to this trend line.
If price moves below 1,214.37 then I would expect subminuette wave ii may be continuing further. The invalidation point would have to move back down to 1,186.29 for the hourly chart. I think this is now very unlikely (but it is possible).
This analysis is published about 02:55 p.m. EST.
http://www.pmbull.com shows gold just hit the bottom trend line for both month and daily.
However gold has broken below all trend lines below daily, from 4 hours down to 1 minute.
good trade in PM is when corrective wave happens buy dust. not hope to ride impulse wave
papudi
Good idea. I guess you never know when the impulse wave will happen,however you do know when the impulse wave rally happened.
Is that what you do instead of buying on the way up?
yes.
the core rule is a third wave may not be the shortest. that does not mean it has to be the longest.
if iii is shorter than i, then v is limited to no longer than iii so that the rule is met
subminuette wave ii is moving lower
the invalidation point is 1,186.29 as per the daily chart
Maybe there is a Santa Claus…
I agree, looks like Gold is now doing a move from the lower bound on the channel drawn on the chart below, up to the upper bound, which is close to 1250 target.
Since 8:15 am gold bounced off and has been moving up from these trend lines minutes: 15, 10, 5, 3, 2, 1
Gold went up $6 in 15 minutes.
My 2 miners ETFs are already higher than Friday close even though $10 lower than Friday close.
Very good bottoming confirmation signs.
Current Gold Price: Live Spot Gold
http://www.pmbull.com/gold-price/
Thanks Richard for recom the best site for gold real time chart
Oil has bottomed according to other Elliot wave analysts. That’s bullish for gold.
Calling a low on US Oil… I wouldn’t be doing that quite yet.
Its probably in a fifth wave, and its so hard to tell when those are over. A simple trend channel should be used, only when it is breached should a low be called. To call it prior to any confirmation of a trend change at all, would be not a good idea. I’ve been there done that and it almost never works out well.
alaforex
You had alternate count posted on 11th. Seems that one is played out today.
What is your assessment now. Thanks
Here what u wrote
If c within (y) = a within (y) target area 1213
if c within (y) = 1,618 * a within (y) target area 1206Invalidation above 1226,25
This is only my count……is reccomended wait Lara
I do not have chart.
Hi,
Yes, the count seems to fit good. Wave c within wave y is in 5 waves without overlapping between 1 and 4. Now the invalidation is 1206 .If subminuette iii will be equal to sub i, the target is area 1258. It is important at this point the start in five waves from 1206. We will see….but I prefer to wait Lara update’s .
My count was wrong, maybe we are in the last leg of wave c within y
astrologically, a bullish run can start for gold from today/tomorrow–this evenings sun transit to sagittarius (Vedic) should hopefully give a solid 4 week run for all the 3rd waves to play out. this downward movement since last night could have been the final shakeout…and end of wave ii hopefully..now we start to see the new upward trend and momentum slowly build throughout the trading day.
Who are you using?
using panchang. only uncertainty is Rx Ju as it can cause rise or fall in gold. If rise is in the cards, there is a chance for run in gold. If we see it now trend up can go till even April 15th 2015 by relation of Sun and Jupiter alone. But if it falls tonight/tomorrow, then this much less likely.
i want to study panchang, give me any good books reference
thanks
Gold has now several resistances to over come before 3rd of 3rd wave pull :
1214,1218, 1222,1226.
FROM CHARTIST’S VIEW IT IS BEARISH.
Gold just hit a low of 1,210.43 at 3:51 am EST and looks like it just bounced of Lara’s aqua blue trend line zone. I hope that gold climbs a lot during market hours so it can pull up my gold miners ETFs and build sentiment and momentum by the time it hits the 1,247 zone today.
Gold is bearish. I do not have hope for it go above 1220 now.
Wave ii is not complete and may take another day or.
bouncing off 1210. wave ii may be over now. have to wait to see a bounce in market hours…I’m with you Richard.
This site has all time frames live Gold and Silver from 1 minute to 1 month
http://www.pmbull.com/gold-price/
Thanks Richard. Good site Recom
Gold fell below the pink support and resistance line at 1220. It will have to move back above the pink line.
This main hourly wave got invalidated at 8:24 PM Sunday at 1213.00. Gold Jumped to 1215.
subminuette ii was not over…$1212ish must hold here
Do you think if 1212 holds that will complete the subminuette ii?
Plus by London opening gold should be over 1235 or so if it is to be in wave iii on Monday. Gold is having difficult time to cross over 1226 level.
Next week is FOMC day???
Do not know the source: it was on a forum:
Even a bearish EW count targets $1260-$1270 into the FOMC minutes next week
I believe that the main trend for gold is down but the corrective
rally off of 11/7 appears to have more to go. The rally from 11/30 may
be a C-Wave that is showing an EW 1-2, i-ii subdivision that targets the
$1260-$1270 zone. This possibility needs to be acknowledged from those
short gold here even if gold has lower lows to go into February.
Also solar-lunar cycles show heightened volatility in the 12/15-12/17
time window – this could give us a good short squeeze higher in gold.
Also, the sentiment in gold is very subdued despite the $100 rally – this is contrary bullish.
Next week will be very interesting for gold and the SPX …. Trader Jack
FOMC – google would find everything.
https://pt-br.facebook.com/mayzus.english/posts/341025169369487
Gold is dropping and is at 1216. Hope does not fall below invalidation 1214.37
Lara – In few words what is gold’s current overall major wave?
According to Sir Alf Field’s last count gold has completed Major 1 and 2 and is in intermediate wave II of major 3. After 2013 April he went silent.
Below is his last published major wave counts he had been following since 2000.
I am very glad to connect to your EW analysis. Thanks for your hard work.
For a quick look below are two charts from Sir Alf Field’s post. As of 2013 he was waiting for 3rd of 3rd major wave to begin. Rest is history.
Gold Historical link on the right has Lara’s long term count.
Lara, Here is a forecast by EWI Elliott Wave International that forecasts the November 2014 low as the end of a A-wave of a ABC pattern and B wave ends at gold high of $1440-1525 in 2015.
Lara I would appreciate any comment you might have including any rough any guess on 2015 high.
P.S I used to get there EWI daily gold updates but ended it because yours are vastly superior and EWI just gave vague guesses, which I couldn’t trade from. I tried to copy and paste the 2nd chart in the article but no luck I’m not high tech, more old school. Here’s the EWI article link and quote.
http://www.theaureport.com/pub/na/elliott-wave-charts-point-to-shocking-countertrend-for-gold-steven-hochberg
TGR: Based on that, what is your target price for gold in 2015?
SH: I think a reasonable target price is in the $1,440–1,525/oz range. We’ll be able to refine that as we see the wave structure unfold and do our internal calculations. Based on what the Elliott Waves are showing, I think this is a countertrend rally.
Major declines typically have an ABC pattern. You have your A wave down, then you have a B-wave rally that retraces a percentage of the preceding decline and then you go down in a C wave to make what is the final low in an ABC pullback, or decline.
We think that November’s low is the A wave, that initial leg down, to be followed by a B-wave rally. The A wave lasted from September 2011 to November 2014. The B wave will probably last well into 2015, if not all year.
On EW analysis there is a good read to learn basics about Elliott wave from Sir Alf Field who had been posting his analysis time to time on blogs since 2000. He was right till he was wrong.
He does not do a detail analysis like Lara. Lara is the best analyst in EW.
Archive:
http://www.321gold.com/archives/archives_authors.php
Can’t trust EWI as their forecasts are notoriously bad. Look at how wrong they were about their S&P forecast after Mar 2009. Look this isn’t rocket science. EWI is basically saying there are 5 waves down from Sept 2011 to complete A. Lara has repeatedly said the move from July 2014 is a seven wave move so it’s hard to see P5 or A over at $1131. I would start to get concerned Lara is wrong with sustained trade (a week or more) above $1262
Chapstick
You are obviously a smart EW guy.
I see Lara as best EW analyst. Which EW service would be next?
Like a medical patient has a primary doctor but sometimes may want a second opinion, Lara is my primary EW analyst, can you recommend an EW analyst or service for a second opinion?
Thanks
Thanks Lara posting Friday’s report before market close. Monday gold could gap up before the market opens.
In video you indicated that this one will be one day rally to the target. Then three days side ways corrections.
How deep the correction will be?
Is three days correction equals the orange wave (ii) correction?
Hopefully Monday”s report will cover these questions.
Have great weekend!!!
Great job and thank you for your support and hard work.
It might be a rally that lasts only one day. It could be longer, but one day is what I’m picking.
Because subminuette ii was shallow (<50%) I'll expect subminuette iv to be deep. But it can't move back into subminuette i price territory.
I'm picking three days also for subminuette iv, but I'll also say it most certainly could be shorter. It depends on what structure it takes.
Lara you mention you expect subminuette ii was shallow (<50%) I'll expect subminuette iv to be deep.
How can one be shallow and one deep if they are both expected to find support at the aqua blue trend line?
if ii had stayed where I thought it had ended, then iv should be shallow in relation to the length of iii. with iii expected to be 0.618 the length of i that would have been possible for iv to be deeper, but it would have been limited not by the aqua blue trend line but by the price high of i.
but… ii is moving lower and taking longer. which is not what I had expected at all.
now that ii is deeper iii may be equal in length with i… when ii is finally done.
RALLY MONDAY!
Those are the best words a trader can hear Friday to start the weekend.
Thanks Lara, I bought more of my miners ETF before the close.
Expecting a great one day profitable trade!!!!!
papudi
I agree. Looking for Lara’s forecasted Rally Monday then I will sell everything at top and buy DUST and exit at day end as Tuesday am news.
Monday Euro PMI, Tuesday am US CPI and Tue/Wed FOMC meeting, Thur, Fri other news.
That is the plan. DUST should do well during three days of correction.
we’re 1$ away fro invalidation, what was the ALT count?
Brilliant. I managed to get this out right before catching some really nice clean waves this morning, so everyone’s happy today 🙂
We were riding Elliott Waves down into the deep discount buying zone where cash is king. You were Surfing Safari the ocean waves down under.
So you are in the Zone with Elliott Waves and Ocean Waves, great way to start the weekend, good for you.
I just watched some videos on youtube of surfing killer waves. I love downhill and water skiing but would never surf, although I’m sure it is probably even more fun, a total thrill ride.
Hi Lara.
Quote: “At 1,247 subminuette wave iii would reach 0.618 the length of subminuette wave i. This target may be met on Monday with a short sharp upwards thrust .. .. … … …. ….”
Could wave iii be shorter than wave i? Even though, they are subminuette degree in this case.