
Downwards movement breached the invalidation point on the hourly Elliott wave chart, and has now breached the aqua blue trend line on the daily Elliott wave chart slightly. Neither of these situations was what was expected.
Summary: This second wave correction is moving lower. The target for it to end is at 1,199 and the invalidation point is at 1,186.29. It should be over within a few hours, and should be followed by a sharp upwards thrust to new highs. If it continues for long enough to take it into a fifth day then the probability of the new alternate wave count will substantially increase. That expects quite a lot more downwards movement to below 1,172 most likely, before a third wave up starts. Overall the mid / long term target at 1,283.27 remains the same for both wave counts.
Click on charts to enlarge
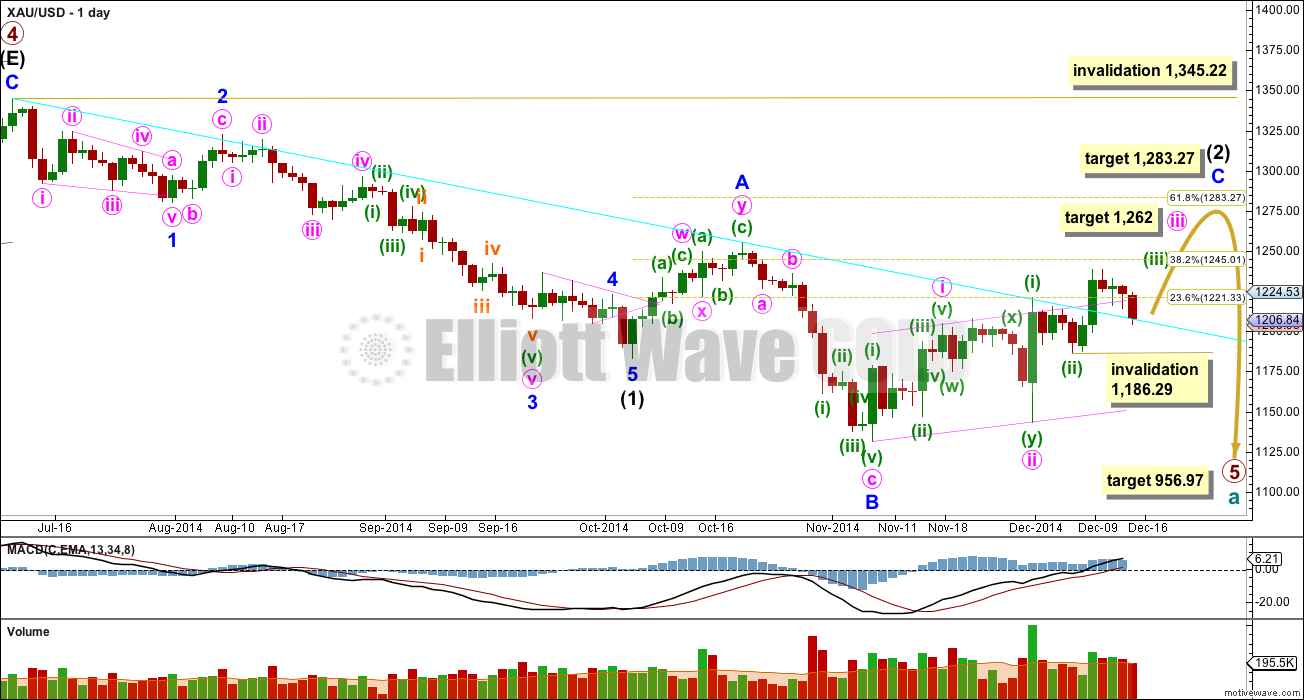
Primary wave 4 is complete and primary wave 5 is unfolding. Primary wave 5 may only subdivide as an impulse or an ending diagonal. So far it looks most likely to be an impulse.
Within primary wave 5 intermediate wave (1) fits perfectly as an impulse. There is perfect alternation within intermediate wave (1): minor wave 2 is a deep zigzag lasting a Fibonacci five days and minor wave 4 is a shallow triangle lasting a Fibonacci eight days, 1.618 the duration of minor wave 2. Minor wave 3 is 9.65 longer than 1.618 the length of minor wave 1, and minor wave 5 is just 0.51 short of 0.618 the length of minor wave 1. I am confident this movement is one complete impulse.
Intermediate wave (2) is an incomplete expanded flat correction. Within it minor wave A is a double zigzag. The downwards wave labelled minor wave B has a corrective count of seven and subdivides perfectly as a zigzag. Minor wave B is a 172% correction of minor wave A. This is longer than the maximum common length for a B wave within a flat correction at 138%, but within the allowable range of twice the length of minor wave A. Minor wave C may not exhibit a Fibonacci ratio to minor wave A, and I think the target for it to end would best be calculated at minute degree. At this stage I would expect intermediate wave (2) to end close to the 0.618 Fibonacci ratio of intermediate wave (1) at 1,283.27 (*Note: the Fibonacci retracement tool on Motive Wave works when the chart is on an arithmetic scale, so I will change daily charts from semi-log to arithmetic. However, now the maroon channel does not work so I have removed it).
Intermediate wave (1) lasted a Fibonacci 13 weeks. If intermediate wave (2) exhibits a Fibonacci duration it may be 13 weeks to be even with intermediate wave (1). Intermediate wave (2) is now beginning its tenth week.
So far within minor wave C the highest volume is on an up day. This supports the idea that at this stage the trend is up.
The upper maroon trend line is the upper edge of the Elliott channel drawn about this impulse on the weekly chart, and copied over here to the daily chart. See the most recent Gold Historic Analysis to see how this trend line is drawn on the weekly chart. If minor wave C lasts long enough it should find extremely strong resistance at that trend line, I would not expect that trend line to be broken while primary wave 5 is incomplete.
The aqua blue trend line is a simple TA trend line which is showing where price is currently finding (*edited) support. The power of the middle of the upcoming third wave has broken above this trend line.
The target for primary wave 5 at this stage remains the same. At 956.97 it would reach equality in length with primary wave 1. However, if this target is wrong it may be too low. When intermediate waves (1) through to (4) within it are complete I will calculate the target at intermediate degree and if it changes it may move upwards. This is because waves following triangles tend to be more brief and weak than otherwise expected. A perfect example is on this chart: minor wave 5 to end intermediate wave (1) was particularly short and brief after the triangle of minor wave 4.
Within minor wave C now the third wave is underway. Within minuette wave (iii) no second wave correction may move beyond its start below 1,186.29.
Intermediate wave (2) may not move beyond the start of intermediate wave (1) above 1,345.22. I have confidence this price point will not be passed because the structure of primary wave 5 is incomplete because downwards movement from the end of the triangle of primary wave 4 does not fit well as either a complete impulse nor an ending diagonal.
To see a prior example of an expanded flat correction for Gold on the daily chart, and an explanation of this structure, go here.
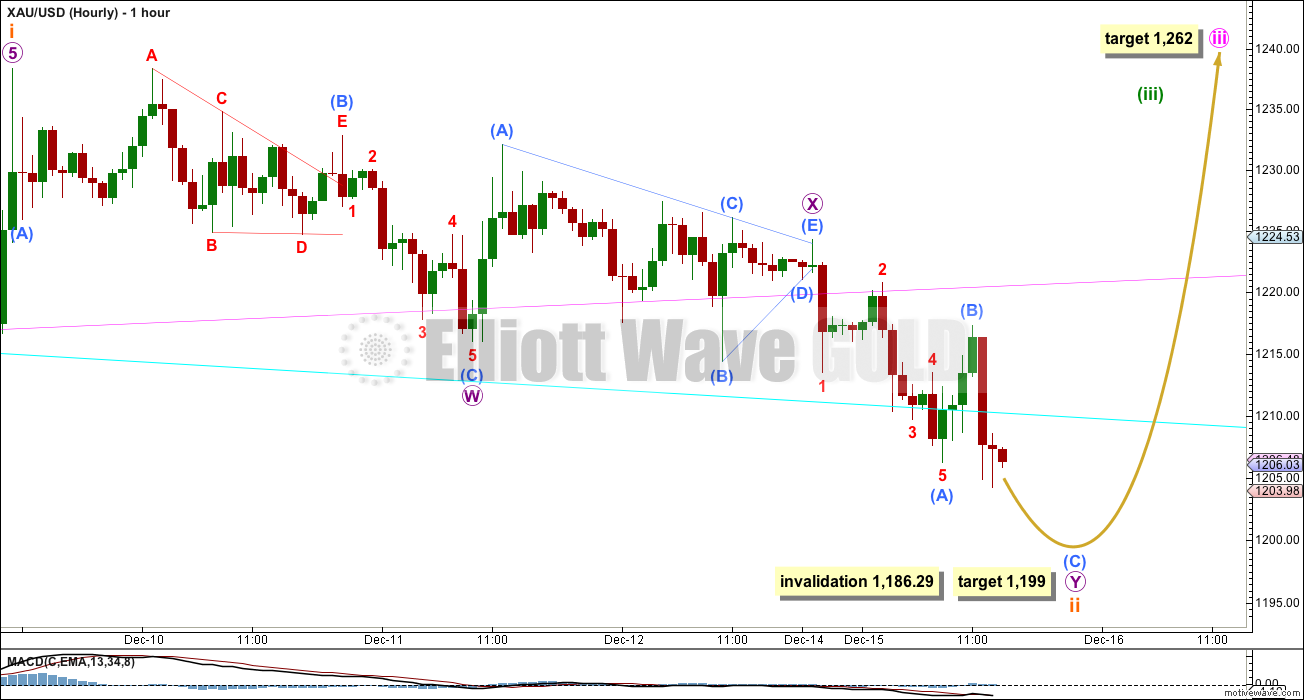
The second wave correction of subminuette wave ii is continuing yet lower, and is now even in duration with minuette wave (ii) one degree higher.
This hourly wave count has changed: I am seeing micro wave X not as a brief zigzag but as a running contracting triangle. This double zigzag for subminuette wave ii is an almost perfect copy of the double zigzag of minuette wave (ii) one degree higher, which also has an X wave that was a triangle.
Within the second zigzag of micro wave Y at 1,199 sub micro wave (C) would reach equality in length with sub micro wave (A).
If this wave count is correct then it has to end there. If subminuette wave ii continues for much longer and takes it into a fifth day (it is nearing the end of its fourth day at the time this analysis is published) then the new alternate wave count below will increase in probability before it is confirmed. I would not expect subminuette wave ii to be longer in duration than minuette wave (ii) one degree higher, which would give the wave count the wrong look.
Subminuette wave ii may not move beyond the start of subminuette wave i below 1,186.29. If this price point is passed I will use the alternate below.
Alternate Wave Count
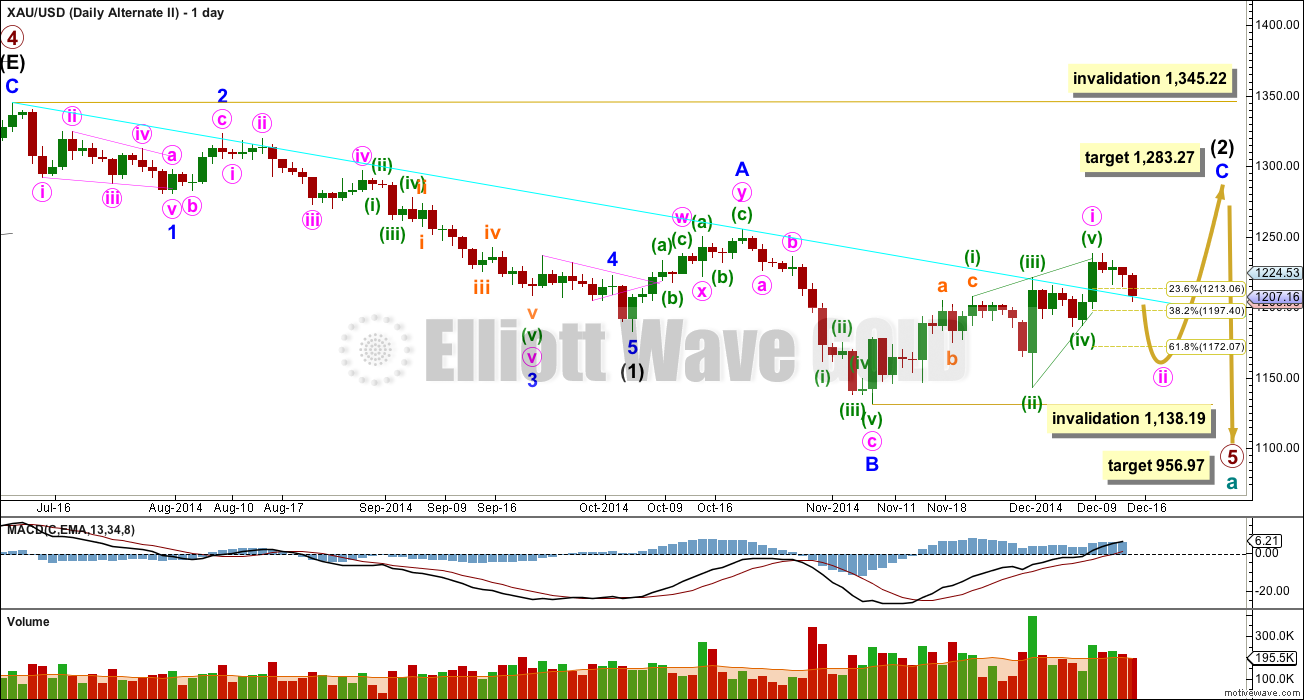
I have tried to see an explanation for this small breach of the aqua blue trend line, which is concerning. I have considered prior alternates, and what if intermediate wave (2) is actually over? That idea has too many problems and has totally the wrong look, so I do not want to publish it.
I am confident of my labelling of intermediate wave (1) as complete and intermediate wave (2) as incomplete. I am also confident of my labelling of minor wave A as a double zigzag structure. This means intermediate wave (2) cannot be a combination, because you can’t have multiples within multiples. So I am also confident of my labelling of intermediate wave (2) as a common expanded flat correction. This means it is extremely likely that minor wave C will move at least slightly above the end of minor wave A at 1,255.40 to avoid a truncation and a very rare running flat.
This wave count still requires upwards movement over coming weeks to complete minor wave C as a five wave structure.
It is possible that within minor wave C minute wave i ended higher as a leading contracting diagonal. Within this structure I am seeing minuette wave (i) as a zigzag, and minuette waves (iii) and (v) probably as impulses. Within leading diagonals the first, third and fifth waves are most commonly zigzags but sometimes they may also be impulses. Within diagonals the fourth wave should overlap the first wave, but may not move beyond the end of the second wave.
Minuette waves (ii) and (iv) subdivide best as double zigzags. There is some confusion (for me at least) over interpretation of diagonals rules in Frost and Prechter (Elliott Wave Principle, 10th edition). I have long held that second and fourth waves within diagonals may only be single zigzags, not doubles. Other Ellioticians hold that because double and triple zigzags may take the place of single zigzags this means second and fourth waves within diagonals may be double or even triple zigzags. The text is unclear.
Within diagonals the second and fourth waves are usually deep, between 0.66 to 0.81 as being the most common length. Here minuette wave (ii) is 0.85 the length of minuette wave (i) and minuette wave (iv) is just 0.43 the length of minuette wave (iii).
When first waves subdivide as leading diagonals they are normally followed by very deep second wave corrections. This wave count would expect minute wave ii to move substantially lower, at least to the 0.618 Fibonacci ratio of minute wave i at 1,172.07 and very likely below this point.
Minute wave ii may not move beyond the start of minute wave i below 1,138.19.
If this invalidation point was to be passed, I would move the degree of labelling of the diagonal up one degree and my wave count would see that as minor wave C in its entirety. Intermediate wave (2) would be a very rare running flat with a substantially truncated C wave of 17.02. The rarity of running flats and the size of this truncation means such a wave count would have an extremely low probability. Also, it is difficult to see how minuette waves (iii) and (v) within the diagonal structure subdivide as zigzags because they look like impulses. Within ending diagonals ALL the sub waves must be zigzags, so this diagonal is more likely to be leading than ending.
This analysis is published about 02:28 p.m. EST.
Thank you Eddie!
my respect to dearest lara. so human wt her words. she readily admits mistakes in her forecast. unlike many others especially talkers on all tv channels. may you being bless always. And being guided.
Lara Today is the fifth day of correction for wave ii. Plus gold so far has not violated the invalidation 1185.
Is it possible to get your impression of today’s wave count by 3:00PM EST?
papudi
How are you playing the movement today.
When gold breaks below invalidation at 1186.29 I am planing on buying some DUST or JDST then sell near 1,172 or before close whichever comes first.
Bot JDST and Dust. Miner index broke or about to break the bottom trend line
Yes. Yes it is.
I’m swapping the wave counts over today. I expect Gold, GDX and Silver to all move lower before the next upwards wave begins.
I may also be publishing a new alt chart for GDX for you.
I’m actually rather unwell today, so the video will necessarily be a bit more brief. I’ll make sure the text is thorough though.
Elliott Wave Forecast Last night December 15, 2014
Gold is in subminuette wave ii correction and if it breaks below the invalidation point of 1,186.29 than gold will drop to at least 1,172, very likely below it. And a few days away from starting back up in subminuette wave iii.
The upper top target is still 1,280 in 1 month. Then head down to 1,000 area in about 3 months. I already sold all my miners ETF this morning.
Agree but struggling to hold/gain momentum after initial surge – sellers came on right at pink resistance
The impulse 3rd wave will it be 5 waves structure??
So gold just had micro wave 1 and and followed by corrections wave 2???? so on in one day till gold reached the target.
Confirmation of 3rd may be IMO will be when gold is over 1226.
I think it’s safe to say the main count is no longer correct. Gold could not keep momentum and hold onto gains.
“If it continues for long enough to take it into a
fifth day then the probability of the new alternate wave count will
substantially increase.”
However the main wave count has not been invalidated below 1186.25 yet.
Yes. I’m swapping the two wave counts over today.
maybe the start of 3rd wave has arrived? i hope!
Bottom line is traders need to wait out the FED FOMC minutes. Reaction from the what FED says is part of Waves.
In Elliott waves one can not predict the immediate reaction of masses. Lara has done best to guide the pathway to where gold is going. Time no one can control.
So we wait till gold closes above 1222 and 1226. Or it closes below 1186.
Any one know what happens if gold invalidates at 1186?
Look at the pmbull daily chart
Click on ‘Gold Price’ in upper left of screen.
In the bottom right corner of the chart click and select 1D for daily time frame.
http://bit.ly/VTzZCu
Since the beginning of November the four times Gold hit the bottom of the daily trend line it rallied that day or the next.
Today when gold wasn’t rallying I noticed that pattern and wondered if that was what was missing that gold hadn’t yet bottomed in daily chart.
By the end of the trading session today Monday Gold hit the the bottom of the daily trend line.
Tuesday we find out if that pattern will repeat itself.
No promises, however the pattern seems to indicate if it didn’t bounce today it would be Tuesday.
Yes I know this isn’t Elliott Wave, however Lara did advise us to feel free to use some additional indicators in our trades.
Always trade in the direction of major trend. Surprises are always in the direction of major trend.
For gold the major trend is down. Waiting for int 2 to end.
For better risk reward let the one day (expected) impulse move to be over then at the top (1248) trade from short side for deep correctivion.
Gold has put in low at 1190. and back testing bottom trend line at 1196. What will be the game changer here for gold to be over Aqua line and/or above 1226.
lol who says 1190 is the low…..at least we hope it is 😀
papudi, very wise trading advice, thank you.
I don’t know about this count either…on GLD it seems there is a perfect expanding triangle ABCDE since Nov 5…which suggests W2 is done??? Could GLD trade a greater volume than the futures we are following here (and therefore lead)? And GDXJ is supposed to lead the GDX (which tried 5 times to break 20 and failed)….GDXJ is already at new lows…disclosure (I’m a little short via JDST) …
We also have stock exchanges in resource rich countries like Canada and Australia moving lower. Gdx will have to climb through a torrent of sellers who will dump anything and everything when major indices break support (despite higher gold prices). I think it will be tough for gdx to make a new corrective high. The timing will have to be perfect during s&p bear market rallies. Maybe Lara could see a potential time slot in her indices analysis.. I dunno, its tough… But i would like a better short position so I’m routing for you Lara!!
Lol… See weekly $tsx and $spasx200 below…
We have NASDAQ, DJIA, S&P500 and FTSE all moving strongly lower too.
Ted
Speaking of volume shares traded Monday
GLD 9 million
GDXJ 30 million
GDX 90 million
GDXJ closed at it’s all time low Monday.
Something is not right. it’s just not adding up, G DX has just crossed the MACD on the daily chart and on the weekly chart this is very bearish
…..now, it could be that gdx will lead gold, that’s possible ….while Gold moves higher gdx could move into a wave 2. In any case the sentiment is changing.
I agree and the more I look at Lara’s main wave count, the more C doesn’t look like an inpulse. It looks corrective, but I can’t put my finger on the exact labeling. Starting to feel like int 3 down early stages.
If todays recent move in gdx is the final move down of an expanded flat correction, it will have to start moving higher pronto tomorrow. This could just stabilize the weekly MACD before all tech savvy traders pick a side , but gold will have to start moving up tonight. Lara’s count could still work but we need a quick change in altitude because I don’t think gdx can handle another day like this, particularly if it is accompanied by a high-volume.
And MACD turns at the ZERO line are especially and notoriously powerful…in either direction..
This one can’t seem to decide which direction. Its moved both up… and now down.
Thx Lara! My fear is this is starting to resemble Int 3 down. I know you hate the count but if Int 2 were over at $1238, it was a perfect 50% retrace and lasted a fib 8 weeks I believe. You would have to confirm. Personally, the alternate has a wrong look IMO. I do not see minute i taking 8 weeks???? On the flip side, it does look like an obvious triangle after $1238. This suggests it’s corrective. I believe we saw the same thing a few weeks back before blasting $80 higher in less than 24 hrs after Swiss Gold Referendum.